Supplemental Digital Content is available in the text
Abstract
Metabolic reprogramming has been regarded as an essential component of malignant transformation. However, the clinical significance of metabolic heterogeneity remains poorly characterized.
The aim of this study was to characterize metabolic heterogeneity in thyroid cancers via the analysis of the expression of mitochondrial ribosomal proteins (MRPs) and genes involved in oxidative phosphorylation (OxPhos), and investigate potential prognostic correlations.
Gene set enrichment analysis (GSEA) verified by reverse transcription polymerase chain reaction and gene network analysis was performed using public repository data. Cross-sectional observational study was conducted to classify papillary thyroid cancer (PTC) by the expression of MRP L44 (MRPL44) messenger RNA (mRNA), and to investigate the clinicopathological features.
GSEA clearly showed that the expression of OxPhos and MRP gene sets was significantly lower in primary thyroid cancer than in matched normal thyroid tissue. However, 8 of 49 primary thyroid tumors (16.3%) in the public repository did not show a reduction in OxPhos mRNA expression. Remarkably, strong positive correlations between MRPL44 expression and those of OxPhos and MRPs such as reduced nicotinamide adenine dinucleotide dehydrogenase (ubiquinone) 1 α subcomplex, 5; succinate dehydrogenase complex, subunit D; cytochrome c, somatic; adenosine triphosphate synthase, H+ transporting, mitochondrial Fo complex, subunit C1 (subunit 9); and MRP S5 (MRPS5) (P < 0.0001) were clearly denoted, suggesting that MRPL44 is a representative marker of OxPhos and MRP expressions. In laboratory experiments, metabolic heterogeneity in oxygen consumption, extracellular acidification rates (ECARs), and amounts of OxPhos complexes were consistently observed in BCPAP, TPC1, HTH-7, and XTC.UC1 cell lines. In PTCs, metabolic phenotype according to OxPhos amount defined by expression of MRPL44 mRNA was significantly related to lymph node metastasis (LNM) (P < 0.001). Furthermore, multivariate analysis clearly indicated that expression of MRPL44 is associated with an increased risk of lateral neck LNM (odds ratio 9.267, 95% confidence interval 1.852–46.371, P = 0.007).
MRPL44 expression may be a representative marker of metabolic phenotype according to OxPhos amount and a useful predictor of LNM.
INTRODUCTION
Papillary thyroid cancer (PTC) is the most common endocrine malignancy whose incidence is rapidly increasing worldwide.1 However, the treatment strategy of PTC is controversial because patients with PTC have widely different prognoses.2 On one hand, an observational study suggested that a watch-and-wait policy may be sufficient to manage patients with small PTCs.3,4 On the other hand, persistent or recurrent PTC occurs in around 10% to 15% of the cases.5 Moreover, as the survival rate of persistent or recurrent PTC is around 50% to 70%, a significant proportion of PTC cases are fatal.6
Many investigators have carried out laboratory and clinical studies with the aim of finding new markers to predict the presence of poor prognostic factors such as extrathyroidal extension (ETE) or lymph node metastasis (LNM) to characterize persistent or recurrent PTC at initial diagnosis. In this regard, the v-Raf murine sarcoma viral oncogene homolog B (BRAF)V600E mutation, galectin-3, and human mesothelial cell 1 are all considered potential candidates for the prediction of prognosis.1,7–10 Nonetheless, the clinical applications of these molecular markers are still limited.
Metabolic reprogramming is an essential component of malignant transformation. Following the discovery of the Warburg effect, cancer cells were shown to produce energy predominantly through higher glycolytic activity (glycolytic phenotype) rather than through oxidative phosphorylation (OxPhos) using the electron transport chain (ETC).11–13 However, in addition to aerobic glycolysis (Warburg effect), glutamine addiction, somatic isocitrate dehydrogenase mutations, glycine/serine addiction, and the reverse Warburg effect suggested the existence of diverse metabolic phenotypes in cancer cells.14–18 In addition, cancer cells generating cellular adenosine triphosphate (ATP) through OxPhos (oxidative phenotype) have been observed.19,20 Taken together, these studies indicate substantial intertumor heterogeneity with respect to cell metabolism, although the mechanism of action and clinical implications of the different metabolic phenotypes are not well characterized.
Herein, we carried out gene set enrichment analysis (GSEA) using public repository data combined with reverse transcription polymerase chain reaction (RT-PCR) verification in a cohort of primary tumors to shed light on metabolic heterogeneity in PTC. We also determined if expression of OxPhos-related genes and mitochondrial ribosomal proteins (MRPs) could be used to identify metabolic phenotypes. In addition, gene network analysis and immunohistochemical staining data of OxPhos-related proteins and MRPs available at the Human Protein Atlas (HPA) were also analyzed. Based on functional analysis using thyroid cancer cell lines, both cell lines and primary tumors were classified as either having a glycolytic phenotype or a combined (glycolytic and oxidative) phenotype. Moreover, the metabolic phenotype according to OxPhos amount could be inferred by measuring the expression of MRP L44 (MRPL44) messenger RNA (mRNA). Interestingly, expression of MRPL44 was associated with the presence of LNM, which suggests that it may be a useful clinical marker for predicting poor prognosis and planning the extent of surgery.
METHODS
Subjects and Clinical Data
This study enrolled 103 patients (20 males and 83 females) undergoing thyroidectomy for classical PTC between January 2012 and December 2013 at Severance Hospital, Yonsei Cancer Center, Seoul, Korea. The study size was calculated by Web-based Sample Size/Power Calculations (http://www.stat.ubc.ca/∼rollin/stats/ssize/). All samples were microscopically dissected at the time of surgery after confirmation of diagnosis using frozen sections. Samples were taken from the central portion of the tumor and from contralateral normal tissue. On histological examination, cellularity was >90%. Slides stained with hematoxylin and eosin were reviewed independently by 2 pathologists and a histological diagnosis was made according to the WHO classification. Patient information and clinicopathological parameters were analyzed. All protocols were approved by the institutional review board of Severance Hospital.
RNA Isolation and RT-PCR
Total RNA was extracted using Trizol (Invitrogen, Carlsbad, CA), and complementary DNA (cDNA) was prepared from total RNA using M-MLV reverse transcriptase (Invitrogen) and oligo-dT primers (Promega, Madison, WI). RT-PCR was performed on cDNA using the Solg 2X PCR Smart mix Kit (Solgent, Daejeon, South Korea). Genes were amplified using the following primers: reduced nicotinamide adenine dinucleotide (NADH) dehydrogenase (ubiquinone) 1 β subcomplex, 3 (NDUFB3), 5′-GGA CAT GAG CAT GGA CAT CA-3′ and 5′-GCA AAG CCA CCC ATG TAT CT-3′; NADH dehydrogenase (ubiquinone) 1 α subcomplex, 5 (NDUFA5), 5′-GGT GTG CTG AAG AAG ACC AC-3′ and 5′-GCA GGA GGC TCT TCC ACT AA-3′; succinate dehydrogenase complex, subunit D (SDHD), 5′-TGT TGC TTC GAA CTC CAG TG-3′ and 5′-CCC AGC AAA GGT TAA AGC TG-3′; cytochrome c1 (CYC1), 5′-CCA AAA CCA TAC CCC AAC AG-3′ and 5′-GTT TTC GAT GGT CGT GCT CT-3′; cytochrome c, somatic (CYCS), 5′-CCA AAA CCA TAC CCC AAC AG-3′ and 5′-GTT TTC GAT GGT CGT GCT CT-3′; cytochrome c oxidase subunit VIa polypeptide 1 (COX6A1), 5′-TTT GTC ATC ACT GGG AAC CA-3′ and 5′-ATG AAC TCG GGT CTC TCG TG-3′; cytochrome c oxidase subunit VIIb (COX7B), 5′-AAG CGC ACT AAA TCG TCT CC-3′ and 5′-TTT GGG GTA ACT CTG CCA AC-3′; ATP synthase, H+ transporting, mitochondrial Fo complex, subunit C1 (subunit 9) (ATP5G1), 5′-GGT GTG CTG AAG AAG ACC AC-3′ and 5′-GCA GGA GGC TCT TCC ACT AA-3′; MRPL44, 5′-GTT CAG AGA AGC CGA ACT GG-3′ and 5′-ACT GCT CCA CAG CCA AGT TT-3′; MRP L45 (MRPL45), 5′-CCC CAT ACC TCA AGG GTT CT-3′ and 5′-CCG GAT TGA CAC TTG TGA TG-3′; MRP S5 (MRPS5), 5′-TTT GTC ATC ACT GGG AAC CA-3′ and 5′-CTG CAC TGC TCC ATT TTT CA-3′; MRP S11 (MRPS11), 5′-AGC ATT TAC CCT CCC ATT CC-3′ and 5′-TGG GGT GTT GTC TGT GAT TG-3′; MRP S28 (MRPS28), 5′-CCC CTA CAG AAG GGT TCT CC-3′ and 5′-TGG ATT CCC AAG AGA ACT GC-3′; MRP S31 (MRPS31), 5′-CAG TCA GGT ACC GCA GTT CA-3′ and 5′-AAG GGA GAG AAT CTG CCA CA-3′; glyceraldehyde-3-phosphate dehydrogenase, 5′-TTG ATT TTG GAG GGA TCT CG-3′ and 5′-GAG TCA ACG GAT TTG GTC GT-3′. RT-PCR experiments were repeated 3 times, and each experiment was performed in triplicate.
Public Data and Statistical Analysis
Microarray data from the Gene Expression Omnibus of NCBI (gene expression data available at www.ncbi.nlm.nih.gov/projects/geo; accession no. GSE6004 and GSE33630) were subjected to GSEA. Analysis of public repository data was performed using the HPA (http://www.proteinatlas.org/) and GeneNetwork (a free scientific web resource, http://www.genenetwork.org/). Statistical analysis was carried out using SPSS version 18.0 for Windows (SPSS Inc, Chicago, IL) or GraphPad Prism (GraphPad Software, Inc, San Diego, CA). Average means were compared with a Mann–Whitney U test. Data are presented as mean ± SD. All P values are 2 sided.
Cell Culture, Oxygen Consumption Rate, and ECAR
HELA, BCPAP, TPC1, HTH-7, and XTC.UC1 cells were cultured in Dulbecco modified Eagle medium (DMEM, Life Technologies, Carlsbad, CA) or Roswell Park Memorial Institute medium (Life Technologies) containing 4.5 g/L glucose, 10% fetal calf serum, 0.1 mM NEAA, and 50 μg/mL gentamicin at 37°C in a 5% CO2 atmosphere.21 The mitochondrial oxygen consumption rate (OCR) was measured using a Seahorse XF-96 extracellular flux analyzer (Seahorse Bioscience Inc, North Billerica, MA).22,23 On the day before the experiment, the sensor cartridge was placed in the calibration buffer supplied by Seahorse Bioscience and incubated at 37°C without CO2. Cells were cultured on Seahorse XF-24 plates at a density of 20,000 cells per well, washed, and incubated with assay medium (DMEM without bicarbonate) at 37°C without CO2 for 1 hour. All media and injection reagents were adjusted to pH 7.4 on the day of the assay. Three baseline measurements of the OCR and ECAR were taken.
Isolation of Mitochondria and BN-PAGE
Isolation of mitochondria and blue native (BN) BN-PAGE was performed as described previously using the NativePAGE Novex Bis-Tris Gel system (Invitrogen).24 Briefly, cells were homogenized in isolation buffer B (210 mM Mannitol, 70 mM sucrose, 1 mM EGTA, 5 mM HEPES, pH 7.2) with a Teflon-glass homogenizer. The homogenate was then centrifuged at 600×g for 10 minutes at 4°C, and the resulting supernatant was recentrifuged at 17,000×g for 10 minutes at 4°C. The mitochondrial fractions, which were recovered in the pellet, were washed with buffer B and resuspended in the same buffer. Mitochondria were either used immediately or stored at −80°C for later use. Isolated mitochondria (50 μg) were solubilized using NativePAGE sample buffer with 0.5% n-dodecyl-β-d-maltoside or 1% digitonin (Invitrogen). The suspensions were centrifuged at 20,000×g for 10 minutes at 4°C. The resulting supernatants were loaded onto a NativePAGE Novex 3% to 12% Bis-Tris gel (Invitrogen). After the run was complete, the gel was transferred to a PVDF membrane using the iBlot Gel Transfer System (Invitrogen). The membrane was fixed with 8% acetic acid. After overnight drying, the membrane was destained with methanol. To detect the OxPhos complex, the Mitoprofile Total OXPHOS Rodent WB Antibody Cocktail, Abcam, Cambridge, MA, USA (Mitosciences/Abcam) was used. After incubation in the primary antibody dilution, the membrane was washed and visualized using the WesternBreeze Chromogenic Western Blot Immunodetection Kit (Invitrogen).
RESULTS
Metabolic Heterogeneity According to mRNA Expression of OxPhos Proteins and MRPs in PTC
To confirm the heterogeneity of mRNA expression of OxPhos and MRPs in PTC, we performed GSEA using public repository data. In the analysis using GSE33630 (n = 105), both the OxPhos gene set (P = 0.0395, false discovery rate (FDR) q value = 0.225, Figure 1A) and the MRP gene set (P = 0.0022, FDR q value = 0.001, Figure 1B) showed statistically significant enrichment in normal thyroid tissues. In addition, in the analysis using GSE6004 (n = 18), the OxPhos and MRP gene sets were consistently enriched in normal thyroid tissues (P = 0.0388, FDR q value < 0.05; P = 0.002, FDR q value < 0.01, respectively; Supplementary Figure 1A and B, http://links.lww.com/MD/A138). In agreement with the Warburg effect (aerobic glycolysis), GSEA clearly indicated a reduction in OxPhos and MRP gene sets, suggesting that cancer cells from both papillary and anaplastic thyroid cancers (ATC) predominantly produce energy via a high rate of glycolysis. However, through careful review of the raw data in GSEA (GSE33630), we found that 8 of 49 PTC cases (16.3%) did not show a reduction in OxPhos mRNA expression (Supplementary Figure 2, http://links.lww.com/MD/A138). In addition, the HPA program (used to explore the entire human proteome using an antibody-based approach funded by the nonprofit organization Knut and Alice Wallenberg Foundation) indicated that expression of MRPL44 was not decreased in all PTCs. As shown in Supplementary Figure 3A, http://links.lww.com/MD/A138, normal thyroid follicular cells showed moderate MRPL44 staining, whereas PTC cells showed low (Supplementary Figure 3B, http://links.lww.com/MD/A138) to moderate (Supplementary Figure 3C, http://links.lww.com/MD/A138) staining, suggesting heterogeneous expression of MRPs in PTCs. In addition, the staining intensity of NDUFA5 was also moderate to strong in PTC (Supplementary Figure 4, http://links.lww.com/MD/A138). To further investigate the observed intertumor heterogeneity of OxPhos protein and MRP expression, we analyzed the correlation between mRNA expression of OxPhos and MRP genes using the raw data from GSE33630. Interestingly, expression of MRP mRNA showed a statistically significant correlation with OxPhos mRNA expression (Figure 2A and B and Supplementary Figure 5, http://links.lww.com/MD/A138). MRPL44 expression also presented strong positive correlations with NDUFA5 (r = 0.1691, P < 0.0001, Figure 2A), SDHD (r = 0.4703, P < 0.0001, Figure 2B), CYCS (r = 0.2441, P < 0.0001, Supplementary Figure 5A, http://links.lww.com/MD/A138), and ATP5G1 (r = 0.2586, P < 0.0001, Supplementary Figure 5B, http://links.lww.com/MD/A138). The data set GSE16780 UCLA Hybrid MDP Liver Affy HT M430A (Sep11) RMA, Supplementary Figure 6A, http://links.lww.com/MD/A138) from GeneNetwork consistently revealed the presence of a strong positive correlation between the expression of Mrpl44 and the expression of ATP synthase, H+ transporting, mitochondrial Fo complex, subunit C2 (subunit 9) (Atp5g2) (Figure 2C and Supplementary Figure 6B, http://links.lww.com/MD/A138), mitochondrial creatine kinase (Ckmt, Figure 2D and Supplementary Figure 6C, http://links.lww.com/MD/A138), and Mrps5 (Figure 2E and Supplementary Figure 6D, http://links.lww.com/MD/A138). Taken together, these data indicated significant intertumor heterogeneity in OxPhos and MRP mRNA expression. Accordingly, MRPs such as MRPL44 may be useful as indicators of the expression pattern of OxPhos and MRPs.
FIGURE 1.
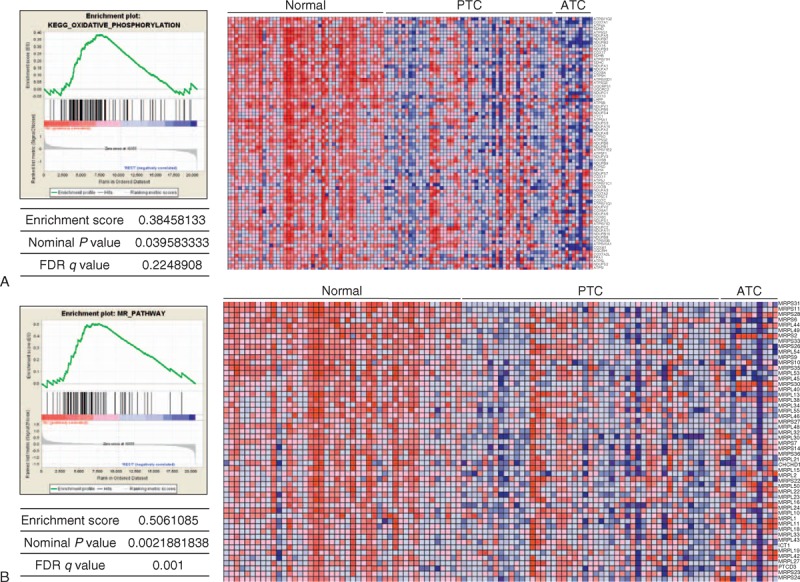
GSEA using public repository data (GSE336300). (A) GSEA for KEGG_OxPhos pathway gene set. (B) GSEA for KEGG_mitochondrial ribosomal pathway gene set. ATC = anaplastic thyroid cancers, FDR = ??, GSEA = gene set enrichment analysis, OxPhos = oxidative phosphorylation, PTC = papillary thyroid cancer.
FIGURE 2.
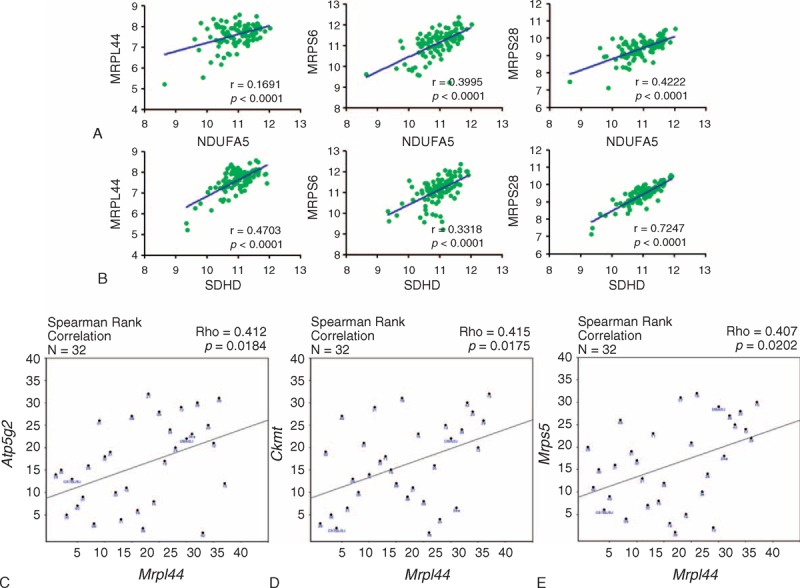
Correlation between OxPhos and MRP gene expression. (A) The relationship between NDUFA5 mRNA expression and MRPL44, MRPLS6, and MRPS28 expressions in GSE336300. (B) The relationship between SDHD mRNA expression and MRPL44, MRPLS6, and MRPS28 expressions in GSE336300. Statistical analysis was carried out using GraphPad Prism. (C–E) Gene network analysis of the relationship between Mrpl44 expression and Atp5g2 (C), Ckmt (D), and Mrps5 (E) expressions using GSE16780 UCLA Hybrid MDP Liver Affy HT M430A (Sep11) RMA. Atp5g2 = ??, Ckmt = creatine kinase, mitochondrial, MRP = mitochondrial ribosomal protein, MRPL44 = MPR L44, MRPS5 = MPR S5, MRPS6 = MPR S6, MRPS28 = MRPS 28, NDUFA5 = NADH dehydrogenase (ubiquinone) 1 α subcomplex, 5, OxPhos = oxidative phosphorylation, SDHD = succinate dehydrogenase complex, subunit D.
Metabolic Phenotype in Thyroid Cancer Cell Lines
Considering the differential expression of OxPhos and MRP genes, we postulated that a certain degree of “metabolic diversity” exists in PTCs. To investigate this possibility, we estimated OCR and ECAR in HELA cells and thyroid cancer cell lines using an XF analyzer. As shown in Figure 3A and B, HELA cells showed a higher OCR and a lower ECAR compared with most thyroid cancer cell lines, suggesting that they generate more ATP via OxPhos (oxidative phenotype) than via glycolysis. BCPAP cells, a BRAFV600E positive PTC cell line, showed a decreased OCR and the highest ECAR, which was in agreement with the higher levels of glycolysis (glycolytic phenotype) in this cell line. TPC1 cells, a PTC cell line harboring a RET/PTC1 rearrangement, had relatively lower levels of both OCR and ECAR, suggesting that this cell line had the lowest metabolic rate (metabolically inactive). Interestingly, HTH-7 cells, an ATC cell line, showed increased OCR and ECAR, suggesting that this cell line generates its ATP via both glycolysis and OxPhos (combined phenotype). XTC.UC1 cells, derived from a Hurthle cell cancer harboring mutations in mitochondrial DNA (mtDNA), had a lower OCR and a higher ECAR, as expected (glycolytic phenotype). In BN-PAGE, HELA cells had the most abundant OxPhos complexes (Figure 3C), whereas complex IV was barely detectable in TPC1 cells (Figure 3C, lower panel). Consistent with the results obtained using the XF analyzer, HTH-7 cells contained more intact OxPhos complexes than TPC1 cells. Thus, the thyroid cancer cell lines displayed substantial metabolic diversity. The classification of thyroid cancer cell lines according to metabolic phenotype is shown in Figure 3D.
FIGURE 3.
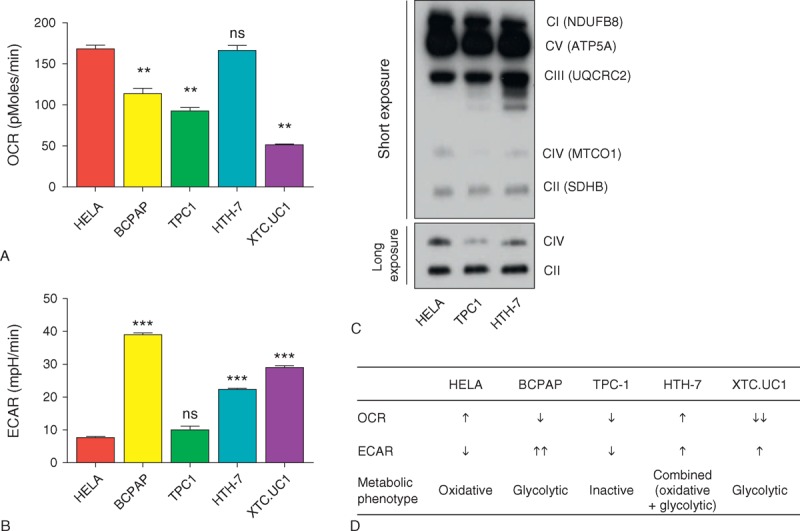
Metabolic typing of thyroid cancer cell lines using an XF analyzer and BN-PAGE. (A and B) Basal OCR (A) and ECAR (B) of HELA and thyroid cancer cell lines. (C) Representative results of BN-PAGE using HELA, TPC1, and HTH-7 cell lines. See Methods for detailed description. (D) Metabolic typing of HELA and thyroid cancer cell lines. Arrows indicate relative up- or downregulation. Comparisons of average means were performed with the Mann–Whitney U test. Data are mean ± SD. ∗∗P < 0.01, ∗∗∗P < 0.001. All P values are 2 sided. ATP5A = ATP synthase, H+ transporting, mitochondrial F1 complex, alpha subunit 1, BN = blue native, ECAR = extracellular acidification rate, HELA = ??, HTH-7 = ??, BCPAP = ??, MTCO1 = mitochondrially encoded cytochrome c oxidase I, NDUFB8 = NADH dehydrogenase (ubiquinone) 1 beta subcomplex, 8, ns = ??, OCR = oxygen consumption rate, SDHB = succinate dehydrogenase complex, subunit B, TPC1 = ??, UQCRC2 = ubiquinol-cytochrome c reductase core protein II, XTC.UC1 = ??.
Heterogeneous Expression of OxPhos and MRPs in PTC
Based on the results obtained using public repository data, RT-PCR was performed using mRNA from primary PTC and matched normal tissues to determine the expression status of OxPhos and MRP genes. First, 12 patients whose preoperative [18F]-fluorodeoxyglucose positron emission tomography (18F-FDG PET) imaging was available were analyzed. Ten of the 12 cases showed a reduction in the expression of OxPhos and MRP genes, including NDUFB3, NDUFA5, SDHD, CYC1, CYCS, COX6A1, COX7B, ATP5G1, MRPL44, MRPL45, MRPS5, MRPS11, MRPS28, and MRPS31. However, 3 cases showed no change in the mRNA expression of OxPhos and MRP genes compared with matched normal thyroid tissues such as a case no. 4 as shown in Figure 4A. Interestingly, 18F-FDG PET imaging indicated that PTCs in all 12 cases had a nodular lesion in the thyroid gland with increased uptake of 18F-FDG (Figure 4B), suggesting high glycolytic activity. RT-PCR and 18F-FDG PET imaging data indicated that the expression of OxPhos and MRP mRNAs was heterogeneous, although glycolytic activity was still higher in PTCs than in normal thyroid tissue.
FIGURE 4.
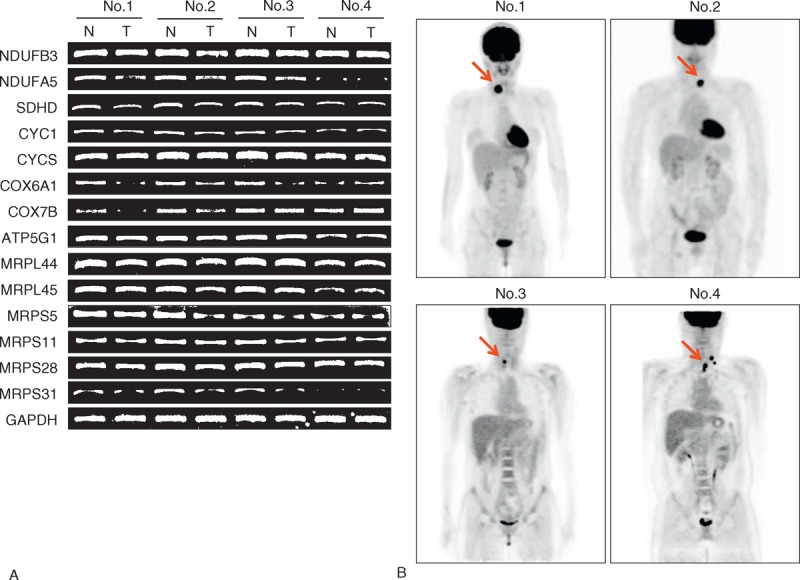
Representative results of RT-PCR analysis of OxPhos and MRP mRNA expression, and 18F-FDG PET CT imaging. (A) Representative results of RT-PCR analysis for NDUFB3, NDUFA5, SDHD, CYC1, CYCS, COX6A1, ATP5G1, MRPL44, MRPL45, MRPS5, MRPS11, MRPS28, MRPS31, and glyceraldehyde-3-phosphate dehydrogenase. All experiments were repeated 3 times, and each experiment was performed in triplicate. (B) Representative preoperative 18F-FDG PET CT image from the same patients mentioned in (A). Arrows indicate thyroid nodular lesions that were confirmed as PTC by ultrasound-guided fine-needle aspiration cytology. 18F-FDG PET = [18F]-fluorodeoxyglucose positron emission tomography, ATP5G1 = ATP synthase, H+ transporting, mitochondrial Fo complex, subunit C1 (subunit 9), COX6A1 = cytochrome c oxidase subunit VIa polypeptide 1, COX7B = cytochrome c oxidase subunit VIIb, CYC1 = cytochrome c1, CYCS = cytochrome c, somatic, GAPDH = glyceraldehyde-3-phosphate dehydrogenase, MRP = mitochondrial ribosomal protein, MRPL44 = MPR L44, MRPL45 = MPR L45, MRPS5 = MPR S5, MRPS11 = MRP S11, MRPS28 = MRP S28, MRPS31 = MRP S31, NDUFA5 = NADH dehydrogenase (ubiquinone) 1 α subcomplex, 5, NDUFB3 = NADH dehydrogenase (ubiquinone) 1 β subcomplex, 3, OxPhos = oxidative phosphorylation, PTC = papillary thyroid cancer, SDHD = succinate dehydrogenase complex, subunit D.
Correlation Between MRPL44 mRNA Expression and Regional LNM
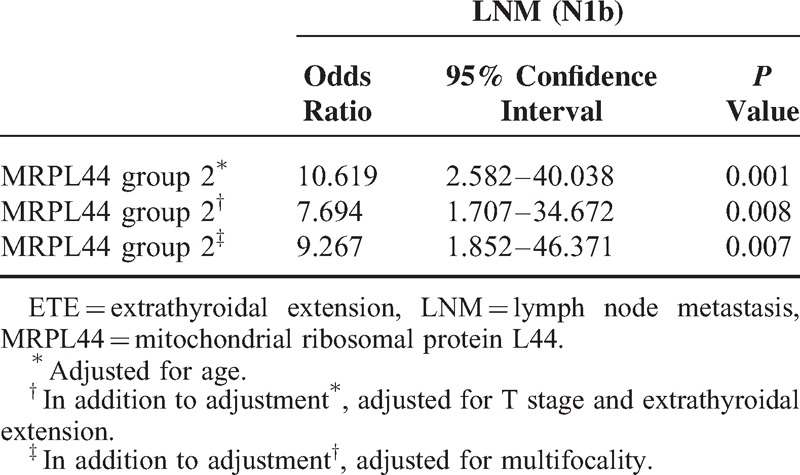
To understand the clinical implications of metabolic diversity in PTC, we analyzed potential correlations between expression of MRPL44 mRNA and clinicopathological parameters. Based on the heterogeneous expression of MRPL44 and NDUFA5, RT-PCR for MRPL44 was performed in 103 primary PTC and matched normal thyroid tissue. Of these, 87 PTCs (84.5%) showed a reduction in MRPL44 expression compared with that in normal tissue, whereas 16 PTCs (15.5%) showed no differences in MRPL44 mRNA expression between tumoral and normal tissues (data not shown). Interestingly, clinicopathological analysis indicated that regional LNM, including lateral neck node metastasis (N1b), was more frequent in PTCs that exhibited no change in expression of MRPL44 mRNA (P = 0.001, Table 1). Moreover, multivariate analysis clearly indicated that no change in MRPL44 expression (indicated as Group 2) increased the risk of lateral neck LNM after adjustment for age, ETE, T-stage, and multifocality (odds ratio 9.267, 95% confidence interval 1.852–46.371, P = 0.007, Table 2).
TABLE 1.
Clinicopathological Characteristics of Patients With PTC According to Expression of MRPL44 mRNA
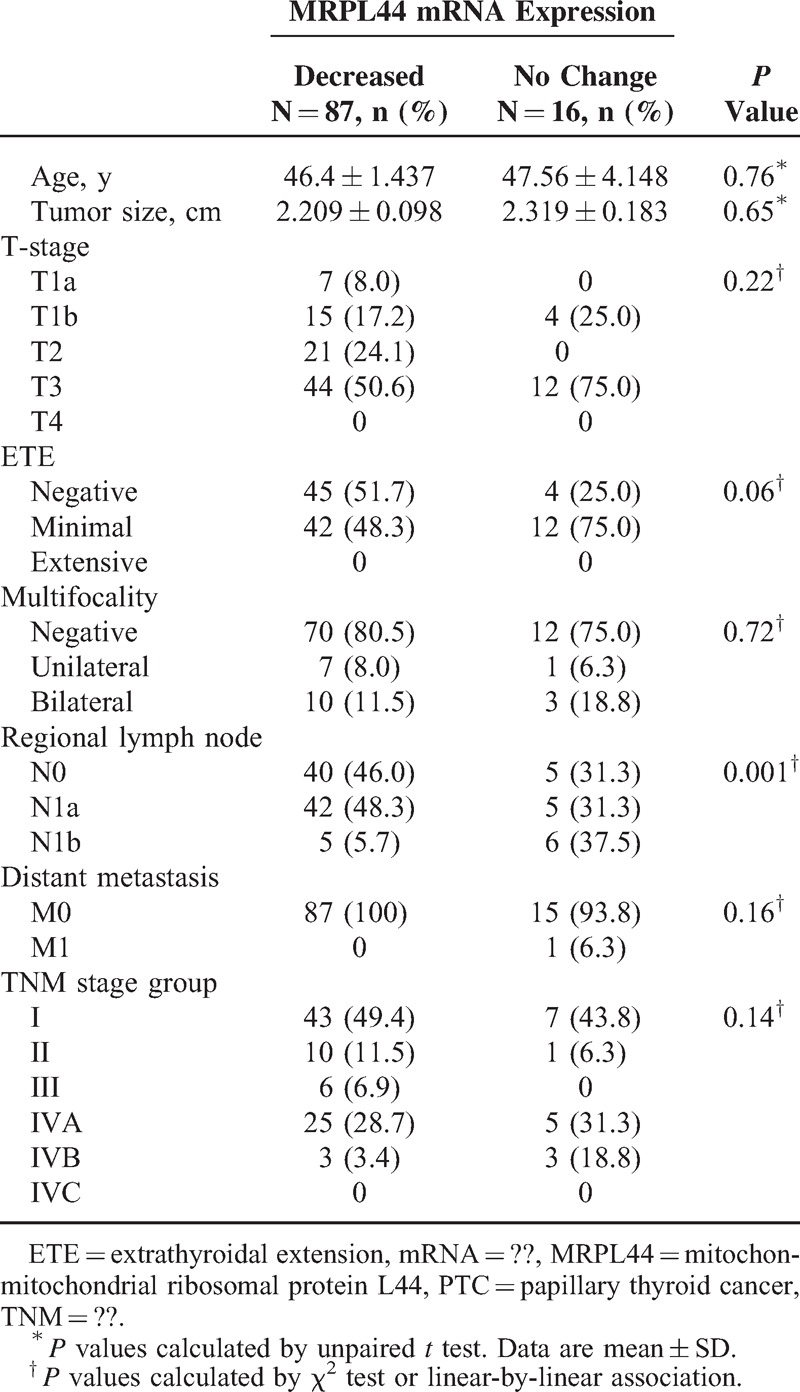
TABLE 2.
Multivariate Analysis of the Association of LNM (N1b) With Levels of Expression of MRPL44
DISCUSSION
Otto Warburg11 discovered that most cancer cells produce cellular ATP using a high rate of glycolysis instead of OxPhos. This observation can be clinically detected by performing uptake imaging using FDG PET as shown in Figure 4B. The Warburg effect might be related to mitochondrial damage in cancer cells, or to adaptation to hypoxia within the tumor microenvironment. Recently, the aberrant expression of glycolytic enzymes, such as overexpression of mitochondrial bound hexokinase and the M2 splice isoform of pyruvate kinase, was reported as a possible cause of the Warburg effect.25,26 However, because mitochondria can produce much more cellular ATP via OxPhos than via glycolysis, cancer cells still use mitochondria to produce ATP for fatty acid synthesis and other biosynthetic processes.20 In agreement with these recent observations concerning mitochondrial metabolism in cancer cells, the GSEA data showed that OxPhos and MR gene sets are coordinately downregulated in most PTCs, indicating that PTC cells rely primarily on aerobic glycolysis for their energy needs. However, 16.3% of PTCs in the GSE33630 data set and 15.5% of PTCs in our cohort had the same amount of OxPhos and MRP mRNA expression as normal thyroid tissues. In line with our data, HPA also indicated that MRPL44 and NDUFA5 expression in a proportion of PTCs was similar to that in normal thyroid tissues.
Proteins in the ETC originate from both nuclear DNA (nDNA-encoded) and mtDNA (mtDNA-encoded).27 Because of the different origins of proteins in the ETC, nDNA-encoded ETC proteins synthesized in the cytosol become localized to mitochondrial matrix via a translocase on the outer mitochondrial membrane and a translocase on the inner mitochondrial membrane complexes.28 After translocation, nDNA-encoded ETC proteins undergo an assembly process with mtDNA-encoded ETC proteins to generate an intact OxPhos complex.29 During this process, transcription and translation processes from mtDNA must be coordinated with cytosolic synthesis, transport, and assembly of nDNA-encoded ETC proteins.30 For this reason, we found a strong positive correlation between MRPs and ETC proteins in the results of our correlation assay and gene network analyses (Figure 2), which support our hypothesis that MRPL44 is a representative marker of OxPhos.
HELA cells are used as a control cell line for the oxidative phenotype because they have abundant mitochondria,31 whereas XTC.UC1 cells, originating from a Hurthle cell cancer, are used as representatives of the glycolytic phenotype.32 As expected, HELA cells had the highest OCR and the lowest ECAR, whereas XTC.UC1 had the lowest OCR and the highest ECAR. BCPAP cells, a BRAFV600E-positive PTC cell line, had the glycolytic phenotype. However, HTH-7, which is a cell line derived from an ATC, had a high OCR and a high ECAR, indicating that although these cells rely on glycolysis, they also use oxidative respiration (combined oxidative and glycolytic phenotype). In support of the results of the functional analysis using the XF analyzer, BN-PAGE also showed differences in the amounts of OxPhos complexes between TPC1 (metabolically inactive in our study) and HTH-7 cells. Based on these observations, we hypothesize that PTCs and thyroid cancer cell lines can be separated into 2 groups with distinct metabolic phenotypes, namely, a glycolytic phenotype group and a combined (oxidative and glycolytic) phenotype group.
One of the most interesting findings in the present study is that MRPL44 expression correlates with the presence of LNM. The expression of MRPL44 can be used to identify the metabolic phenotype in PTC; low expression indicates a glycolytic phenotype, whereas high expression indicates a combined phenotype. PTC with a combined metabolic phenotype, indicated by a high level of MRPL44 expression and a high FDG uptake, might have a growth advantage because of the high amounts of ATP and abundant precursors of fatty acid synthesis produced. However, because a functional assay using primary PTC cells was not performed, we cannot definitively conclude that the ETC functions properly in PTCs with abundant MRPL44 expression. In addition, we did not investigate other factors that affect metabolism, such as glutamine addiction, somatic isocitrate dehydrogenase mutations, or glycine/serine addiction in PTCs. These limitations will be explored in future studies.
In conclusion, our data suggest that a proportion of PTCs have a combined (oxidative and glycolytic) metabolic phenotype, even though they still rely on glycolytic activity for ATP generation. In addition, the metabolic phenotype can be determined by measuring the expression of MRPL44, which we show to be a promising marker for the prediction of lateral neck LNM. Future studies should focus on the metabolic phenotyping of PTCs according to their level of MRPL44 expression.
Acknowledgments
We are grateful to Moon Min Jeong for technical assistance.
Footnotes
Abbreviations: 18F-FDG PET = [18F]-fluorodeoxyglucose positron emission tomography, ATP5G1 = ATP synthase, H+ transporting, mitochondrial Fo complex, subunit C1 (subunit 9), Ckmt = creatine kinase, mitochondrial, CYCS = cytochrome c, somatic, ETCe = lectron transport chain, ETE = extrathyroidal extension, GSEA = gene set enrichment analysis, LNM = lymph node metastasis, MRP = mitochondrial ribosomal protein, MRPL44 = MRP L44, MRPS5 = MRP S5, NDUFA5 = NADHdehydrogenase (ubiquinone) 1 α subcomplex, 5, OxPhos = oxidative phosphorylation, PTC = papillary thyroid cancer, SDHD = succinate dehydrogenase complex, subunit D.
This study was supported by the National Research Foundation of Korea grant funded by the Korea government (MEST) (2012R1A2A2A01014672).
The authors have no conflicts of interest to disclose.
Supplemental digital content is available for this article. Direct URL citations appear in the printed text and are provided in the HTML and PDF versions of this article on the journal's Website (www.md-journal.com).
REFERENCES
- 1.Jung CK, Little MP, Lubin JH, et al. The increase in thyroid cancer incidence during the last four decades is accompanied by a high frequency of BRAF mutations and a sharp increase in RAS mutations. J Clin Endocrinol Metab 2014; 99:E276–E285. [DOI] [PMC free article] [PubMed] [Google Scholar]
- 2.Cooper DS, et al. American Thyroid Association Guidelines Taskforce on Thyroid N. Differentiated Thyroid C. Revised American Thyroid Association management guidelines for patients with thyroid nodules and differentiated thyroid cancer. Thyroid 2009; 19:1167–1214. [DOI] [PubMed] [Google Scholar]
- 3.Noguchi S, Yamashita H, Uchino S, et al. Papillary microcarcinoma. World J Surg 2008; 32:747–753. [DOI] [PMC free article] [PubMed] [Google Scholar]
- 4.Mazzaferri EL, Sipos J. Should all patients with subcentimeter thyroid nodules undergo fine-needle aspiration biopsy and preoperative neck ultrasonography to define the extent of tumor invasion? Thyroid 2008; 18:597–602. [DOI] [PubMed] [Google Scholar]
- 5.Bilimoria KY, Bentrem DJ, Ko CY, et al. Extent of surgery affects survival for papillary thyroid cancer. Ann Surg 2007; 246:375–381. [DOI] [PMC free article] [PubMed] [Google Scholar]
- 6.Cho BY, Choi HS, Park YJ, et al. Changes in the clinicopathological characteristics and outcomes of thyroid cancer in Korea over the past four decades. Thyroid 2013; 23:797–804. [DOI] [PMC free article] [PubMed] [Google Scholar]
- 7.Hsiao SJ, Nikiforov Y. Molecular approaches to thyroid cancer diagnosis. Endocr Relat Cancer 2014; 21:T30–T313. [DOI] [PMC free article] [PubMed] [Google Scholar]
- 8.Orlandi F, Saggiorato E, Pivano G, et al. Galectin-3 is a presurgical marker of human thyroid carcinoma. Cancer Res 1998; 58:3015–3020. [PubMed] [Google Scholar]
- 9.Liu YY, Morreau H, Kievit J, et al. Combined immunostaining with galectin-3, fibronectin-1, CITED-1, Hector Battifora mesothelial-1, cytokeratin-19, peroxisome proliferator-activated receptor-{gamma}, and sodium/iodide symporter antibodies for the differential diagnosis of non-medullary thyroid carcinoma. Eur J Endocrinol 2008; 158:375–384. [DOI] [PubMed] [Google Scholar]
- 10.Miettinen M, Karkkainen P. Differential reactivity of HBME-1 and CD15 antibodies in benign and malignant thyroid tumours. Preferential reactivity with malignant tumours. Virchows Arch 1996; 429:213–219. [DOI] [PubMed] [Google Scholar]
- 11.Warburg O. On the origin of cancer cells. Science 1956; 123:309–314. [DOI] [PubMed] [Google Scholar]
- 12.Gatenby RA, Gillies RJ. Why do cancers have high aerobic glycolysis? Nat Rev Cancer 2004; 4:891–899. [DOI] [PubMed] [Google Scholar]
- 13.Kim JW, Dang CV. Cancer's molecular sweet tooth and the Warburg effect. Cancer Res 2006; 66:8927–8930. [DOI] [PubMed] [Google Scholar]
- 14.Wise DR, Thompson CB. Glutamine addiction: a new therapeutic target in cancer. Trends Biochem Sci 2010; 35:427–433. [DOI] [PMC free article] [PubMed] [Google Scholar]
- 15.Yan H, Parsons DW, Jin G, et al. IDH1 and IDH2 mutations in gliomas. N Engl J Med 2009; 360:765–773. [DOI] [PMC free article] [PubMed] [Google Scholar]
- 16.Mardis ER, Ding L, Dooling DJ, et al. Recurring mutations found by sequencing an acute myeloid leukemia genome. N Engl J Med 2009; 361:1058–1066. [DOI] [PMC free article] [PubMed] [Google Scholar]
- 17.Galluzzi L, Kepp O, Vander Heiden MG, et al. Metabolic targets for cancer therapy. Nat Rev Drug Discov 2013; 12:829–846. [DOI] [PubMed] [Google Scholar]
- 18.Pavlides S, Whitaker-Menezes D, Castello-Cros R, et al. The reverse Warburg effect: aerobic glycolysis in cancer associated fibroblasts and the tumor stroma. Cell Cycle 2009; 8:3984–4001. [DOI] [PubMed] [Google Scholar]
- 19.Unwin RD, Craven RA, Harnden P, et al. Proteomic changes in renal cancer and co-ordinate demonstration of both the glycolytic and mitochondrial aspects of the Warburg effect. Proteomics 2003; 3:1620–1632. [DOI] [PubMed] [Google Scholar]
- 20.Pollak M. Targeting oxidative phosphorylation: why, when, and how. Cancer Cell 2013; 23:263–264. [DOI] [PubMed] [Google Scholar]
- 21.Schweppe RE, Klopper JP, Korch C, et al. Deoxyribonucleic acid profiling analysis of 40 human thyroid cancer cell lines reveals cross-contamination resulting in cell line redundancy and misidentification. J Clin Endocrinol Metab 2008; 93:4331–4341. [DOI] [PMC free article] [PubMed] [Google Scholar]
- 22.Mouchiroud L, Houtkooper RH, Moullan N, et al. The NAD(+)/sirtuin pathway modulates longevity through activation of mitochondrial UPR and FOXO signaling. Cell 2013; 154:430–441. [DOI] [PMC free article] [PubMed] [Google Scholar]
- 23.Houtkooper RH, Mouchiroud L, Ryu D, et al. Mitonuclear protein imbalance as a conserved longevity mechanism. Nature 2013; 497:451–457. [DOI] [PMC free article] [PubMed] [Google Scholar]
- 24.Kim SJ, Kwon MC, Ryu MJ, et al. CRIF1 is essential for the synthesis and insertion of oxidative phosphorylation polypeptides in the mammalian mitochondrial membrane. Cell Metab 2012; 16:274–283. [DOI] [PubMed] [Google Scholar]
- 25.Bustamante E, Pedersen PL. High aerobic glycolysis of rat hepatoma cells in culture: role of mitochondrial hexokinase. Proc Natl Acad Sci U S A 1977; 74:3735–3739. [DOI] [PMC free article] [PubMed] [Google Scholar]
- 26.Christofk HR, Vander Heiden MG, Harris MH, et al. The M2 splice isoform of pyruvate kinase is important for cancer metabolism and tumour growth. Nature 2008; 452:230–233. [DOI] [PubMed] [Google Scholar]
- 27.Acin-Perez R, Fernandez-Silva P, Peleato ML, et al. Respiratory active mitochondrial supercomplexes. Mol Cell 2008; 32:529–539. [DOI] [PubMed] [Google Scholar]
- 28.Bauerschmitt H, Funes S, Herrmann JM. Synthesis and sorting of mitochondrial translation products. Methods Mol Biol 2008; 457:95–112. [DOI] [PubMed] [Google Scholar]
- 29.Dudkina NV, Eubel H, Keegstra W, et al. Structure of a mitochondrial supercomplex formed by respiratory-chain complexes I and III. Proc Natl Acad Sci U S A 2005; 102:3225–3229. [DOI] [PMC free article] [PubMed] [Google Scholar]
- 30.Kramer G, Boehringer D, Ban N, et al. The ribosome as a platform for co-translational processing, folding and targeting of newly synthesized proteins. Nat Struct Mol Biol 2009; 16:589–597. [DOI] [PubMed] [Google Scholar]
- 31.Galper JB. Mitochondrial protein synthesis in HeLa cells. J Cell Biol 1974; 60:755–763. [DOI] [PMC free article] [PubMed] [Google Scholar]
- 32.Savagner F, Chevrollier A, Loiseau D, et al. Mitochondrial activity in XTC.UC1 cells derived from thyroid oncocytoma. Thyroid 2001; 11:327–333. [DOI] [PubMed] [Google Scholar]


