Supplemental Digital Content is available in the text
Abstract
The objective of this study was to examine the repeatability of blood gas (BG) parameters and their derived variables such as the central venous-to-arterial carbon dioxide tension difference (▵Pco2) and the ratio of ▵Pco2 over the central arteriovenous oxygen content difference (▵Pco2/C(a-cv)O2) and to determine the smallest detectable changes in individual patients.
A total of 192 patients with arterial and central venous catheters were included prospectively. Two subsequent arterial and central venous blood samples were collected immediately one after the other and analyzed using the same point-of-care BG analyzer. The samples were analyzed for arterial and venous BG parameters, ▵Pco2, and ▵Pco2/C(a-cv)O2 ratio. Repeatability was expressed as the smallest detectable difference (SDD) and the least significant change (LSC). A change in value of these parameters exceeding the SDD or the LSC should be regarded as real.
The SDDs for arterial carbon dioxide tension, arterial oxygen saturation, central venous oxygen saturation (ScvO2), and ▵Pco2 were small: ±2.06 mm Hg, ±1.23%, 2.92%, and ±1.98 mm Hg, respectively, whereas the SDDs for arterial oxygen tension (Pao2) and ▵Pco2/C(a-cv)O2 were high: ±9.09 mm Hg and ±0.57 mm Hg/mL, respectively. The LSCs (%) for these variables were 5.06, 1.27, 4.44, 32.4, 9.51, and 38.5, respectively.
The repeatability of all these variables was good except for Pao2 and ▵Pco2/C(a-cv)O2 ratio for which we observed an important inherent variability. Expressed as SDD, a ScvO2 change value of at least ±3% should be considered as true. The clinician must be aware that an apparent change in these variables in an individual patient might represent only an inherent variation.
INTRODUCTION
Serial blood gas (BG) analyses are needed to assess oxygenation and ventilation, monitor progress, and evaluate the effect of therapeutic intervention. For any given individual, when BG measurements are repeated over time, some degree of variation will be detected. Variation may result from any combination of within-subject variability and deterioration or amelioration of the patient's condition. The repeatability of BG parameters (the degree to which repeated measurements are similar in the absence of any clinical change) depends on the first components. Knowing the repeatability of the measure by determining the magnitude of the intraindividual component of variation is necessary in order to detect a true change in the clinical condition of a given patient and enable appropriate decision-making. Thus, repeatability is of paramount importance. Previously, it has been shown that the spontaneous variability of arterial BG values was substantial in stable critically ill patients.1–3 However, clinicians may consider the current evidence as based on too small or potentially outdated studies.
The monitoring of central venous oxygen saturation (ScvO2) is recommended in the management of severe sepsis.4,5 However, to the best of our knowledge, there are no data on the repeatability of ScvO2 in intensive care unit (ICU) patients. This is crucial to consider in order to determine whether changes in ScvO2 during resuscitation can be considered as real or only due to the within-subject variability. Recently, there has been a growing interest in the use of central venous-to-arterial carbon dioxide tension difference (▵Pco2) as a tool to evaluate the adequacy of cardiac output to global metabolic demand in critically ill patients.6–10 Furthermore, the ratio of ▵Pco2 over the central arteriovenous oxygen content difference (▵Pco2/C[a-cv]O2) has been found to predict an increase in oxygen consumption in fluid responders.11 Data on the repeatability of the calculated parameters are also lacking. Therefore, we sought to determine the repeatability and the smallest detectable difference (SDD) of BG parameters, ▵Pco2, and ▵Pco2/C(a-cv)O2 ratio in ICU patients.
MATERIALS AND METHODS
This prospective and observational study was conducted in a single, mixed medical, and surgical adult ICU with 15 beds. The study was approved by the local institutional ethics committee (comité d’éthique du centre hospitalier du Dr Shaffner de Lens). Informed consent was obtained from the next of kin of each patient.
Patients
Patients were included if they met all of the following criteria: age >18 years, catheter inserted either in a radial or femoral artery, and central line with the tip confirmed by x-ray to be in the superior vena cava near or at the right atrium. Exclusion criteria were pregnancy and unstable condition, the latter being defined by >10% variation in heart rate, mean arterial pressure, and the need for clinical intervention within 30-minute period before sampling.
Procedure
Arterial and venous BGs were sampled twice immediately one after the other to assess the repeatability of these variables. Arterial and venous BG samples were obtained from the arterial and central venous cannula, respectively, using a preheparinized 3-mL BG syringe (RAPIDLyte; Siemens Healthcare Diagnostic Inc, Deerfield, IL USA). Immediately before sampling, the intra-arterial and intravenous catheters were flushed using the standard flush solution of 0.9% sodium chloride without heparin. To reduce dilution effects, a 10-mL sample of blood was withdrawn (from each arterial and venous system) into the syringe and discarded prior to drawing the 3-mL test samples. The tap in between the sampling port and administration set tubing was turned 45° while changing syringes to ensure that the solution from the proximal tubing could not enter the deadspace. Air bubbles were expressed and the syringes were cupped and analyzed immediately, without temperature correction, using the GEM Premier 3000 (Instrumentation Laboratory Co, Paris, France). Maintenance, calibration, and quality control are performed on a regular basis by the central hospital laboratory. The analytical performance of this analyzer is described in the supplementary digital content (http://links.lww.com/MD/A161). The deadspace was 1.1 mL for the arterial system and 1.9 mL for the venous system.
No medical or nursing interventions were allowed while sampling was being performed.
Data Collection
Demographic data, ICU admission diagnosis, and the Simplified Acute Physiology Score were obtained on the day of enrollment. Mean arterial pressure, the ventilation (mechanical or spontaneous), and the use of vasopressor drugs were also registered.
Arterial BGs (Pao2, arterial carbon dioxide tension [Paco2], and arterial oxygen saturation [Sao2]) and central venous BGs (central venous oxygen tension [PcvO2], central venous carbon dioxide tension [PcvCO2], and ScvO2) were measured using the GEM Premier 3000 (Instrumentation Laboratory Co). The ▵Pco2 was calculated as the difference between PcvCO2 and Paco2. The arterial blood hemoglobin concentration (Hb) was also measured on a GEM Premier 3000. This analyzer measures hematocrit using a technology called conductivity and then calculates Hb (Hb = 0.31 × hematocrit). The first and second measurements of arterial Hb concentrations were used to determine the oxygen content (arterial and venous) of each sample, respectively. The arterial oxygen content was calculated as CaO2 (mL) = 1.34 × Sao2 × Hb (g/dL) + 0.003 × Pao2 (mm Hg). The central venous oxygen content was calculated as CcvO2 (mL) = 1.34 × ScvO2 × Hb (g/dL) + 0.003 × PcvO2 (mm Hg). The C(a-cv)O2 was calculated as C(a-cv)O2 (mL) = CaO2 − CcvO2.
Statistical Analysis
The measurement error was calculated using the Bland–Altman method12 and the within-subject coefficient of variation (CVw). According to Bland and Altman, most disagreements between measurements are expected to fall between limits called “limits of agreement” defined as d ± 1.96 standard deviation of the difference (SDdiff), where d is the mean difference between the pairs of measurements.12 In this case, where there are 2 observations for each subject, the SDdiff estimates the within-subject variability of the measurements (SDdiff = √2 × within-subject SD). Precision expressed according to the Bland–Altman method12 gives an absolute and metric estimate of random measurement error, also called the SDD. Thus, a test is considered to be capable of detecting a difference, in absolute units, of at least the magnitude of the limits of agreement (±1.96 SDdiff). The within-subject SD that was used to determine the 95% range for an individual “true” value is as follows: 95% range = within-subject SD × 1.96.13 This will indicate that the “true” value for 95% of the subjects lies within this range, above, and below the actual value of the taken measurement. This indicates, how much reliance, say for diagnosis, can be placed on that reading.
A rank correlation coefficient for the mean versus differences plot, called Kendall correlation coefficient, was used to assess whether the differences were related to the size of the measurement.
The CVw is the SD corrected for the mean of paired measurements. CVw was calculated as CVw% = √{[∑(a−b)2)/2n]}/[(Ma + Mb)/2] × 100, where a and b are the first and second measurements, Ma and Mb are the mean values for the 2 groups, and n is the number of paired observations.14 The least significant change (LSC) is the minimum change that needs to be measured by a laboratory analyzer in order to recognize a real change of measurement.15 The LSC (%) was calculated using the following equation: LSC = CVw × 1.96 × √2.
A sample size of 192 subjects is required to give good precision for estimating repeatability from 2 measurements with the width of the 95% confidence interval of the within-subject SD no wider than ±10%.16,17 Statistical analyses were performed using SPSS (SPSS for windows release 17.0, Chicago, IL). P < 0.05 was considered statistically significant.
RESULTS
During the study period (December 2012 to January 2014), 488 patients were admitted to our ICU. Among them, 296 patients were not included because of absence of a central line in the superior vena cave (n = 156), absence of an arterial catheter (n = 117), and 23 patients were in unstable condition. Thus, 192 patients were included in this study, and their characteristics are shown in Table 1.
TABLE 1.
Characteristics of the Patients (n = 192)
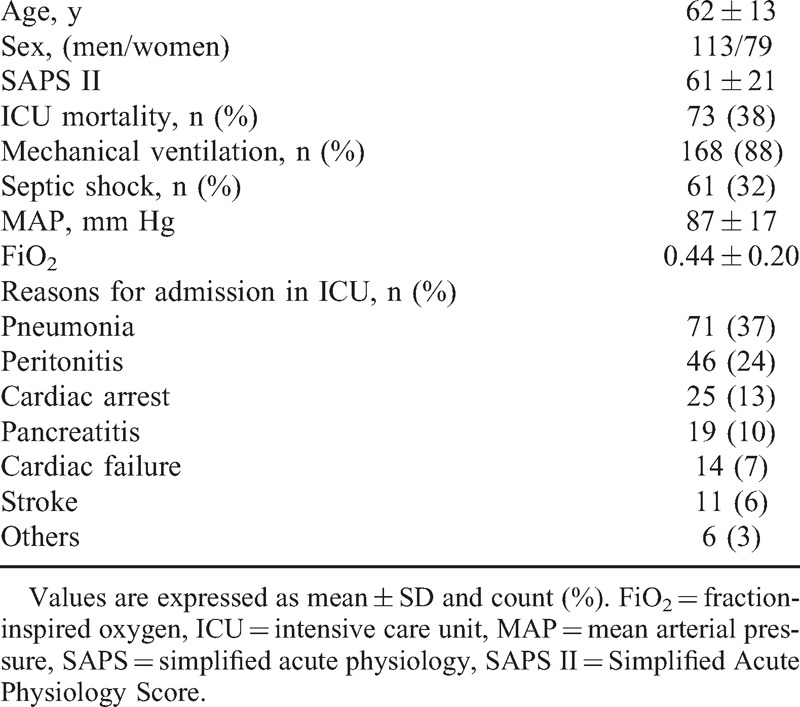
Table 2 summarizes the results of the various methods of calculating the variability in arterial and venous BG analyses. The variability in Pao2 was particularly high because of the high 95% range (≈6 mm Hg) and the wide limits of agreement (SDD≈9 mm Hg) found (Figure 1), reflecting a poor repeatability between measurements, although the CVw was low for this variable (<5%). Additional results on the variability of Pao2 in patients with Sao2 < 94% and patients ventilated with high positive end-expiratory pressure (PEEP > 10 cmH2O) and a high fraction inspired oxygen (FiO2 > 50%) are provided in Tables S1 and S2, respectively (supplementary content, http://links.lww.com/MD/A162, http://links.lww.com/MD/A163). The repeatability of the other variables was, nevertheless, very good (Table 2).
TABLE 2.
Mean Values and Repeatability of Arterial and Venous BG Variables
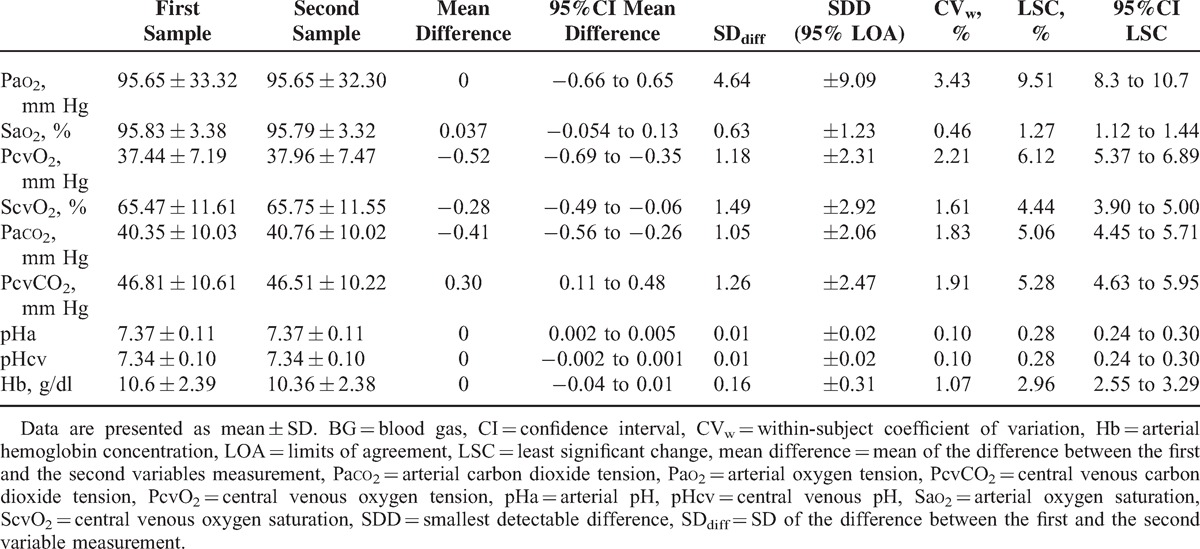
FIGURE 1.
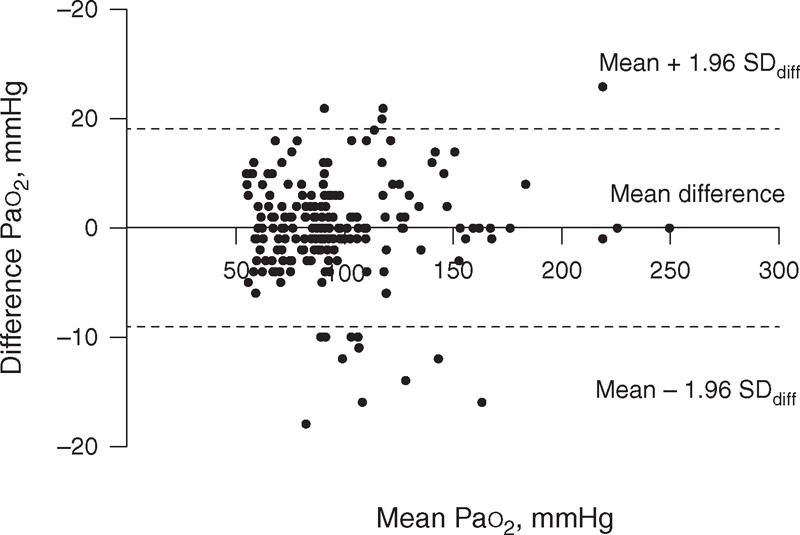
Bland–Altman plot of the difference against the mean of the 2 Pao2 measurements. Pao2 = arterial oxygen tension.
Figures 2 and 3 show the Bland–Altman diagrams for ▵Pco2, and ▵Pco2/C(a-cv)O2 ratio, respectively. Results for repeatability of calculated variables are presented in Table 3. Although the variability of ▵Pco2 expressed as the CVw and LSC was high, the 95% range, and also the limits of agreement (SDD) for this calculated variable were small (Figure 2). Indeed, the 95% range for ▵Pco2 was 1.4 mm Hg, that is, for a patient whose ▵Pco2 was measured as 6 mm Hg, the patient's “true” value lies between 4.6 mm Hg (≈5) and 7.4 mm Hg (≈7). This suggests that the repeatability of ▵Pco2 was good. However, the 95% range for the ▵Pco2/C(a-cv)O2 ratio was 0.4 mm Hg/mL. Thus, if a patient has a ▵Pco2/C(a-cv)O2 of 1.4 mm Hg/mL, the ▵Pco2/C(a-cv)O2 could be as low as 1 mm Hg/mL or as high as 1.8 mm Hg/mL. This indicates that the inherent variability of this ratio was important. There were no correlations between SDdiff and the averages of the first and second measurements for all measured and calculated variables (see Table S3, supplementary content, http://links.lww.com/MD/A164). Additional results on the repeatability of the measured and calculated variables in patients with septic shock are shown in Table S4 (supplementary content, http://links.lww.com/MD/A165).
FIGURE 2.
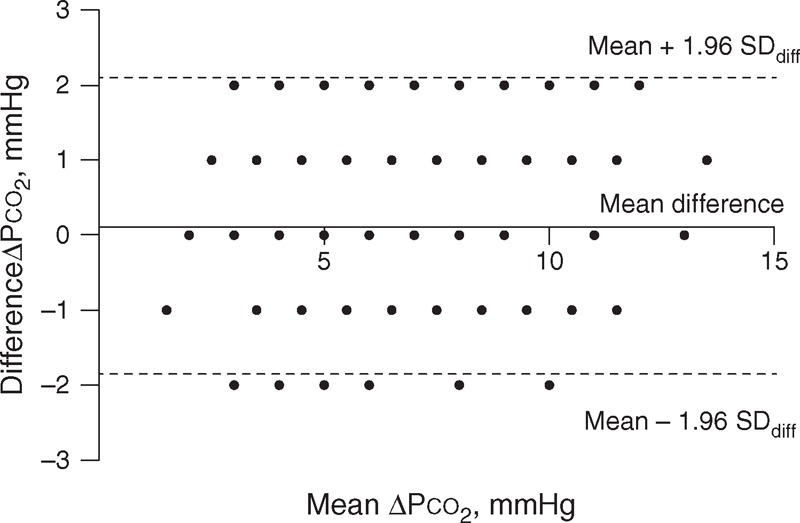
Bland–Altman plot of the difference against the mean of the 2 ▵Pco2. The dots are less than the number of patients included (192) because many of these patients had the same difference values. ▵Pco2 = central venous-to-arterial carbon dioxide tension differences.
FIGURE 3.
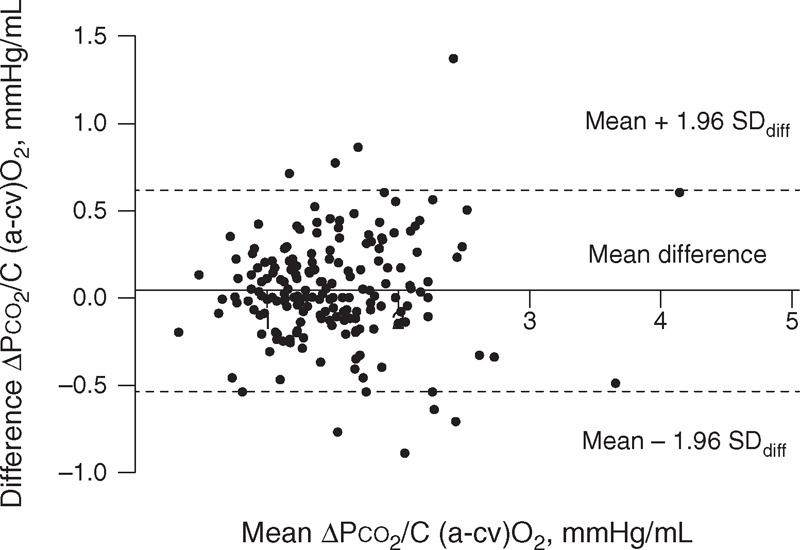
Bland–Altman plot of the difference against the mean of the 2 ▵Pco2 over the central arteriovenous oxygen content difference (▵Pco2/C(a-cv)O2) ratio. ▵Pco2 = central venous-to-arterial carbon dioxide tension differences, ▵Pco2/C(a-cv)O2 = ratio of ▵Pco2 over the central arteriovenous oxygen content difference.
TABLE 3.
Mean Values and Repeatability of Calculated Variables

DISCUSSION
The most important findings of our study are as follows: the repeatability of Sao2, ScvO2, Pco2, and pH was very good, whereas the inherent natural variability of Pao2 and Pao2/FiO2 was considerable; ▵Pco2 was found to be repeatable, whereas the repeatability of ▵Pco2/C(a-cv)O2 was poorer.
All BG analytes assayed on point-of-care testing analyzers are measured with uncertainty due to random variation. Laboratory analytes are subject to 3 main sources of variations: preanalytical, analytical, and biological. Therefore, the results of these analytes change with time and the numbers we obtain are not constant. Preanalytical, analytical, and biological variations are included in the within-subject variation, which results from random fluctuation around an individual homeostatic set point.18,19 The magnitude of this variability must be known by the physicians to correctly interpret the results. The repeatability is the degree to which repeated measurements of the same parameter are similar when carried out under the same conditions of measurements.20 In this study, we chose to evaluate the repeatability by taking 2 blood samples immediately one after the other in stable patients to avoid a real modification in the patient's condition. Furthermore, preanalytical and analytical factors were the only 2 sources of variation that we could act on to minimize the within-subject variation and studied the repeatability of each variable reliably. In our study, we used the same preheparinized BG syringe with the same volume and preparation conditions for the 2 blood samples. Also, blood discard volumes of >3 times the deadspace of catheters were withdrawn to avoid the risk of diluting the samples with flush solution.21 Also, special care was taken to dislodge any air bubbles by gently tapping the sides of the samplers. Moreover, the 2 different samples were analyzed immediately after being taken. Therefore, taking all these precautions, we believe that the preanalytical errors were minimized in this study. Similarly, analytical errors were lessened as BG analyzer was calibrated several times a day. Furthermore, GEM Premier 3000 (Instrumentation Laboratory Co) has an active automated performance quality control program termed Intelligent Quality Management, which continually controls the entire process of sample analysis, enables instantaneous error detection, and performs corrective actions for error elimination.
Repeatability measurements could be reported by multiple statistical methods. In this work, we used the Bland–Altman method and the CVw. The CVw is the ratio of within-subject SD to the mean value of the 2 measurements. Thus, the interpretation of the CVw is as a percentage. However, this figure implies that there is a systematic error even in data sets in which no such bias exists (like our data) because the percentage value (eg, 11.7%) of the lowest measurement in the data set is much smaller than 11.7% of the highest measurement. In this study, we found no correlation between mean versus difference for all measured and calculated variables, which confirms the lack of any systematic bias (Table S2, http://links.lww.com/MD/A163). Therefore, the repeatability expressed in absolute units (SDD) was not related to the size of the measurements, and it is a preferable measure for use in daily practice as compared with the CVw and the derived LSC.
The variability that we found in Pao2 was substantial but lesser to that previously reported.1–3 Indeed, our results indicate that if a patient has a reported Pao2 of 70 mm Hg, the Pao2 could be as low as 64 mm Hg or as high as 76 mm Hg due only to inherent variability. Also, in an individual patient, a Pao2 change can be considered significant only if the change between the measurements exceeds 9 mm Hg (Figure 1). The spontaneous variability expressed as mean CVs found in the previous studies ranged from 4.6% to 6.1% for Pao2 and from 3% to 4.7% for Paco2.1–3 Conversely, in our study, the repeatability was very good for Paco2 (Table 2). Differences between our and those studies may stem from several factors. First, in the previous studies,1–3 the variability of arterial BGs was evaluated over a time period of about 1 hour. The occurrence of minor alterations in the patient's condition (microatelectasis, mismatch between pulmonary ventilation and perfusion, changes in respiratory rate and oxygen consumption), even in apparently stable patients, cannot completely be excluded during this time. Thus, these changes could have contributed to the increased variability of Pao2 and Paco2 measurements reported in those studies. Second, our study included a greater number of patients with various types of pathologies; therefore, it was more representative of ICU patients than the previous studies,1–3 among which the largest sample size was only of 29 patients. We cannot explain why we found an important within-subject variability for Pao2. However, our study was designed to evaluate the magnitude of the variability of BG parameters and was not designed to determine the causes of the variability. Moreover, we found that the variability in Pao2 was not reflected in the variability of Sao2 (Table 2). The sigmoidal shape of the oxygen–hemoglobin dissociation curve can explain the very low variability in Sao2. Indeed, at the Pao2 values seen in our study, the dissociation curve is relatively flat, which means that Sao2 does not change significantly, even with large variations in the Pao2. Furthermore, even in patients with Sao2 values no longer on the flat portion of the oxyhemoglobin curve (Sao2 < 94%), the variability of Sao2 remained low, (SDD≈2%) whereas the variability of Pao2 was still significant (SDD≈7 mm Hg) (Table S1, http://links.lww.com/MD/A162). The same results were found in patients ventilated with high PEEP and high FiO2 (Table S2, http://links.lww.com/MD/A163). Thus, in clinical practice, it is probably better to rely on Sao2 values rather than Pao2 when assessing the oxygenation status of patients. However, Sao2 that is provided by GEM Premier 3000 (Instrumentation Laboratory Co) is a calculated and not a measured parameter. Thus, our results regarding Sao2 might not be applicable to other devices that directly measure Sao2 (co-oximeter). These devices, based on spectrophotometric principles, utilize numerous wavelengths of light to measure the concentrations of oxy-hemoglobin saturation directly. Thus, the within-subject variability of a measured Sao2 will depend on the intraindividual variability of parameters that influence the oxy-hemoglobin dissociation curve such as pH, temperature, and 2,3 DPG. In our study, the within-subject variability of pH was minuscule as shown in Table 2. Furthermore, there is no reason to believe that the temperature of the patient has changed over the sampling period. It is for these reasons that we do not think that the within-subject variability of measured Sao2 would be greater than the calculated Sao2. However, further studies are needed to validate this hypothesis.
It is of interest to note that the repeatability of ScvO2 was found to be good and was most likely due to the low variability in PcvO2 (Table 2). Indeed, the 95% range for an individual true value of ScvO2 was small (±2%). For a patient whose ScvO2 was measured as 70%, the “true” value lies between 68% and 72%. Therefore, the reliance that we can place on reading a value of ScvO2 is good. This finding is of clinical importance since implementation of ScvO2 as a resuscitation goal was associated with decreased mortality in septic shock patients.4,22
To our knowledge, this is the first study investigating the spontaneous variability of ScvO2, ▵Pco2, and ▵Pco2/C(a-cv)O2 ratio in critically ill patients. We found a good repeatability of ▵Pco2 related to the small within-subject variability of the parameters on which it depends. It is well known that when a reported result is derived from >1 actual measurement through their addition, subtraction, multiplication, or division, the uncertainty of the final result can be calculated by summing the uncertainty components of the contributing measurements.18 Therefore, the more variables in the formula, the more uncertainty exists in the result. This may explain why the inherent variability of ▵Pco2/C(a-cv)O2 ratio was found to be significant (Table 3), even though the within-subject variability of the parameters on which it depends were small. Monnet et al11 suggested that considering the ▵Pco2/C(a-cv)O2 ratio as a surrogate of the respiratory quotient, this ratio could be used as a marker of global anaerobic metabolism in critically ill patients. They found that a ▵Pco2/C(a-cv)O2 ratio at baseline ≥1.8 mm Hg/mL predicted with high sensitivity and specificity an increase of oxygen consumption in patients whose oxygen delivery increased after fluid administration. However, according to our results, this threshold value could be as low as 1.4 mm Hg/mL or as high as 2.2 mm Hg/mL (Table 3). This ratio is not trustworthy and therefore probably not reliable for use at the bedside.
How significant is an observed change between 2 successive measurements? This must be a common problem in the clinical interpretation of BG monitoring. Changes in results are often interpreted against empirical criteria. For example, the difference may be considered significant when the test result has doubled or tripled. Changes in results are caused by within-subject variation as well as by deterioration or improvement of the patient's condition. The magnitude of the “critical difference” between results—that is, a change that must occur before significance can be claimed—may be calculated as the SDD or LSC. This means that in an individual patient, in 95% of cases, a ▵Pco2 change value >2 mm Hg or 32.4% is a true ▵Pco2 change and is not due to natural variation.
Our study has several limitations. First, it is a single-center study. Our findings might not apply to other populations. However, our ICU admits a variety of medical and surgical patients, and our population is likely to be representative of other general ICU populations. Second, our results depend on the point-of-care BG analyzer used (GEM Premier 3000; Instrumentation Laboratory Co) and might not be applicable to other devices. Nevertheless, the analytical performance of this device is considered well comparable with most established central laboratory BG analyzers.23,24 Interestingly, the SDdiff of duplicate analyses of whole blood samples obtained from the operating rooms, the ICU, or the emergency department showed no differences between the GEM Premier 3000 and reference central laboratory instruments.25 The GEM Premier 3000 is also the device that is used in our central laboratory hospital for BG analysis. Furthermore, this analyzer is used by hundreds of hospitals in Western countries, making our findings highly relevant to medical practice in many institutions. According to the manufacturer, over 12,000 point-of-care machines just like ours are currently in use all over the world. Therefore, we believe that the principles established by our observations are likely to be generalizable.
CONCLUSION
The short-term repeatability of BGs was good except for Pao2 even in stable ICU patients not undergoing therapeutic intervention. Significant spontaneous variation in the ▵Pco2/C(a-cv)O2 ratio occurred over short-time intervals, whereas the repeatability of ▵Pco2 was good. The clinician should take into account this inherent variability as well as the clinical spectrum of a patient and make informed clinical decisions based on them.
Acknowledgments
The authors thank the nursing staff of the ICU. Without their participation, this work would not have been possible.
Footnotes
Abbreviations: ▵PCO2 = central venous-to-arterial carbon dioxide tension difference, ▵PCO2/C(a-cv)O2 = ratio of ▵PCO2 over the central arteriovenous oxygen content difference, BG = blood gas, CVw = within-subject coefficient of variation, FiO2 = fraction-inspired oxygen, ICU = intensive care unit, LSC = least significant change, PaCO2 = arterial carbon dioxide tension, PaO2 = arterial oxygen tension, PcvCO2 = central venous carbon dioxide tension, PcvO2 = central venous oxygen tension, SaO2 = arterial oxygen saturation, ScvO2 = central venous oxygen saturation, SDD = smallest detectable difference, SDdiff = standard deviation of the difference.
JM and AL contributed to the design of the study. All authors contributed to the acquisition, analysis, and interpretation of data. JM designed and performed the statistical analysis of the data. All authors were involved in revising the draft. All authors read and approved the final article for publication.
The authors have no funding and conflicts of interest to disclose.
Supplemental digital content is available for this article. Direct URL citations appear in the printed text and are provided in the HTML and PDF versions of this article on the journal's Website (www.md-journal.com).
REFERENCES
- 1.Thorson SH, Marini JJ, Pierson DJ, et al. Variability of arterial blood gas values in stable patients in the ICU. Chest 1983; 84:14–18. [DOI] [PubMed] [Google Scholar]
- 2.Hess D, Agarwal NN. Variability of blood gases, pulse oximeter saturation, and end-tidal carbon dioxide pressure in stable, mechanically ventilated trauma patients. J Clin Monit 1992; 8:111–115. [DOI] [PubMed] [Google Scholar]
- 3.Sasse SA, Chen PA, Mahutte CK. Variability of arterial blood gas values over time in stable medical ICU patients. Chest 1994; 106:187–193. [DOI] [PubMed] [Google Scholar]
- 4.Rivers E, Nguyen B, Havstad S, et al. Early goal-directed therapy in the treatment of severe sepsis and septic shock. N Engl J Med 2001; 345:1368–1377. [DOI] [PubMed] [Google Scholar]
- 5.Dellinger RP, Levy MM, Rhodes A, et al. Surviving sepsis campaign: international guidelines for management of severe sepsis and septic shock: 2012. Crit Care Med 2013; 41:580–637. [DOI] [PubMed] [Google Scholar]
- 6.Vallée F, Vallet B, Mathe O, et al. Central venous-to-arterial carbon dioxide difference: an additional target for goal-directed therapy in septic shock? Intensive Care Med 2008; 34:2218–2225. [DOI] [PubMed] [Google Scholar]
- 7.van Beest PA, Lont MC, Holman ND, et al. Central venous-arterial Pco2 difference as a tool in resuscitation of septic patients. Intensive Care Med 2013; 39:1034–1039. [DOI] [PubMed] [Google Scholar]
- 8.Mallat J, Benzidi Y, Salleron J, et al. Time course of central venous-to-arterial carbon dioxide tension difference in septic shock patients receiving incremental doses of dobutamine. Intensive Care Med 2013; 40:404–411. [DOI] [PubMed] [Google Scholar]
- 9.Du W, Liu DW, Wang XT, et al. Combining central venous-to-arterial partial pressure of carbon dioxide difference and central venous oxygen saturation to guide resuscitation in septic shock. J Crit Care 2013; 28:e1–5. [DOI] [PubMed] [Google Scholar]
- 10.Mallat J, Pepy F, Lemyze M, et al. Central venous-to-arterial carbon dioxide partial pressure difference in early resuscitation from septic shock: a prospective observational study. Eur J Anaesthesiol 2014; 31:371–380. [DOI] [PubMed] [Google Scholar]
- 11.Monnet X, Julien F, Ait-Hamou N, et al. Lactate and venoarterial carbon dioxide difference/arterial-venous oxygen difference ratio, but not central venous oxygen saturation, predict increase in oxygen consumption in fluid responders. Crit Care Med 2013; 41:1412–1420. [DOI] [PubMed] [Google Scholar]
- 12.Bland JM, Altman DG. Statistical methods for assessing agreement between two methods of clinical measurement. Lancet 1986; 1:307–310. [PubMed] [Google Scholar]
- 13.Chinn S. Statistics in respiratory medicine. 2. Repeatability and method comparison. Thorax 1991; 46:454–456. [DOI] [PMC free article] [PubMed] [Google Scholar]
- 14.Lodder MC, Lems WF, Ader HJ, et al. Reproducibility of bone mineral density measurement in daily practice. Ann Rheum Dis 2004; 63:285–289. [DOI] [PMC free article] [PubMed] [Google Scholar]
- 15.Glüer CC. Monitoring skeletal changes by radiological techniques. J Bone Miner Res 1999; 14:1952–1962. [DOI] [PubMed] [Google Scholar]
- 16.Bland JM, Altman DG. Measurement error. Br Med J 1996; 312:1654. [DOI] [PMC free article] [PubMed] [Google Scholar]
- 17.How can I decide the sample size for a repeatability study? http://www-users.york.ac.uk/∼mb55/meas/sizerep.htm. Last updated May 17, 2010 Accessed December 1, 2012. [Google Scholar]
- 18.White GH, Farrance I. Uncertainty of measurement in quantitative medical testing: a laboratory implementation guide. Clin Biochem Rev 2004; 25:S1–24. [PMC free article] [PubMed] [Google Scholar]
- 19.Houillier P, Coste J, Froissart M. How many measurements to make a decision? Clin J Am Soc Nephrol 2010; 5:1161–1162. [DOI] [PubMed] [Google Scholar]
- 20.British Standard Institution. Precision of test methods 1: guide for the determination of repeatability and reproducibility for a standard test method, BS 5497-1. London: British Standard Institution; 1979. [Google Scholar]
- 21.Rickard CM, Couchman BA, Schmidt SJ, et al. A discard volume of twice the deadspace ensures clinically accurate arterial blood gases and electrolytes and prevents unnecessary blood loss. Crit Care Med 2003; 31:1654–1658. [DOI] [PubMed] [Google Scholar]
- 22.Nguyen HB, Corbett SW, Steele R, et al. Implementation of a bundle of quality indicators for the early management of severe sepsis and septic shock is associated with decreased mortality. Crit Care Med 2007; 35:1105–1112. [DOI] [PubMed] [Google Scholar]
- 23.Bénéteau-Burnat B, Bocque MC, Lorin A, et al. Evaluation of the blood gas analyzer Gem PREMIER 3000. Clin Chem Lab Med 2004; 42:96–101. [DOI] [PubMed] [Google Scholar]
- 24.Steinfelder-Visscher J, Weerwind PW, Teerenstra S, et al. Reliability of point-of-care hematocrit, blood gas, electrolyte, lactate and glucose measurement during cardiopulmonary bypass. Perfusion 2006; 21:33–37. [DOI] [PubMed] [Google Scholar]
- 25.Jacobs E, Ancy JJ, Smith M. Multi-site performance evaluation of pH, blood gas, electrolyte, glucose, and lactate determinations with the GEM Premier 3000 critical care analyzer. Point of Care 2002; 3:135–144. [Google Scholar]


