Supplemental Digital Content is available in the text
Abstract
In the zero ischemia era of nephron-sparing surgery (NSS), a new anatomic classification system (ACS) is needed to adjust to these new surgical techniques. We devised a novel and simple ACS, and compared it with the RENAL and PADUA scores to predict the risk of NSS outcomes.
We retrospectively evaluated 789 patients who underwent NSS with available imaging between January 2007 and July 2014. Demographic and clinical data were assessed. The Zhongshan (ZS) score consisted of three parameters.
RENAL, PADUA, and ZS scores are divided into three groups, that is, high, moderate, and low scores. For operative time (OT), significant differences were seen between any two groups of ZS score and PADUA score (all P < 0.05). For ZS score, patients with moderate and high scores had longer warm ischemia time (WIT) and greater increase in SCr compared with low score (all P < 0.05). What is more, the differences between moderate and high scores classified by ZS score were borderline but trending toward significance in WIT (P = 0.064) and increase in SCr (P = 0.052). Interestingly, RENAL showed no significant difference between moderate and high complexity in OT, WIT, estimated blood loss, and increase in SCr. Compared with patients with a low score of ZS, those with a high or moderate score had 8.1-fold or 3.3-fold higher risk of surgical complications, respectively (all P < 0.05). As for RENAL score, patients with a high or moderate score had 5.7-fold or 1.9-fold higher risk of surgical complications, respectively (all P < 0.05). Patients with a high or moderate score of PADUA had 2.3-fold or 2.8-fold higher risk of surgical complications, respectively (all P < 0.05). In the ROC curve analysis, ZS score had the greatest AUC for surgical complications (AUC = 0.632) and the conversion to radical nephrectomy (AUC = 0.845) (all P < 0.05).
In conclusion, the ability of ZS score to predict the surgical complexity and surgical complications of NSS is better than RENAL and PADUA scores. ZS score could be used to reflect the surgical complexity and predict the risk of surgical complications in patients undergoing NSS.
INTRODUCTION
In accordance with European Association of Urology guidelines for the management of the clinical T1 renal mass, nephron-sparing surgery (NSS) has become the “gold standard” treatment for renal tumors <7 cm.1 When surgery becomes an option, both the technical ability of the surgeon and the anatomic findings of the renal tumor are important factors. Since 2009, seven distinct objective anatomic classification systems (ACSs) of renal tumors, such as radius.exophyic/endophytic.nearness.anterior/posterior.location (RENAL),2 preoperative aspects and dimensions used for anatomic (PADUA),3 C-index,4 diameter axial polar (DAP),5 nearness.physical.radius.organization,6 surgical approach renal ranking (SARR),7 and renal tumour invasion index,8 have been proposed, aiming to standardize the description of renal tumors. The use of an ACS for renal tumors is helpful since it allows for an objective prediction of potential surgical complications of NSS and valid comparison of different cohorts. However, the present ACSs may include some relatively unimportant components and may be complicated to use in practice. As a result, this sometimes limits their abilities to effectively reflect the surgical complexity and predict the risk of surgical complications. Nowadays, an increasingly important issue during NSS is undesirable ischemic injury to the renal remnant.9–11 Recent advancements in surgical technique now make it possible to eliminate global renal ischemia completely during NSS, such as segmental renal artery clamping,12 zero ischemia,11 zero ischemia with vascular microdissection technique,13 and a nonclamping technique.14 Besides, in the zero ischemia era of NSS, a new ACS is needed to adjust to these new surgical techniques.
The objectives of this study were to propose a novel and simple ACS of renal tumors. This novel ACS, called the Zhongshan (ZS) score, was used to predict the risk of NSS outcomes in a rigorously standardized fashion and compared with the most widely used ACSs (RENAL and PADUA scores).
PATIENTS AND METHODS
After approved by our institutional review board, we evaluated prospectively 1231 patients who underwent NSS between January 2007 and July 2014. Of these, 789 patients, including 64 cases converted to radical nephrectomy (RN), had available cross-sectional imaging for assessment. Surgical procedures included traditional open, mini-incision open,15 laparoscopic and robot-assisted partial nephrectomy. Demographic, clinical, and operative data included patient age, gender, body mass index (BMI), American Society of Anesthesiologists (ASA) score, tumor size, procedure type, operative time (OT), warm ischemia time (WIT), estimated blood loss (EBL), hospital length of stay (LOS), pathologic data, RENAL score,2 and PADUA score.3 All score assignments were performed by at least two investigators with conflicting data reviewed.
Estimated glomerular filtration rate was calculated using the Chronic Kidney Disease Epidemiology Collaboration (CKD-EPI) equation.16 For postoperative estimated glomerular filtration rate (GFR), the serum creatinine (SCr) nadir during the period from 1 to 6 months after surgery was used whenever available, and otherwise the nadir from the immediate postoperative period was used.17 Complications within 30 perioperative days were prospectively collected according to Clavien–Dindo classification.18 Surgical complications included intraoperative transfusion, postoperative hemorrhage, pseudoaneurysm, urinary leak, and acute kidney injury (AKI). Postoperative hemorrhage was defined as any postoperative acute bleeding episode that resulted in a decrease in serum hemoglobin below 8 mg/dL or hemodynamic instability. Urinary leak was recorded if there was persistent leakage from the drainage for 1 week or greater, and a biochemical analysis of the drain fluid consistent with urine (drainage fluid-to-SCr ratio greater than 2). According to the Acute Dialysis Quality Initiative definition, AKI was defined as an SCr increase to twofold from baseline on discharge from hospital.19 Nonsurgical complications, such as atrial fibrillation, atelectasis, ileus, wound infection, and deep venous thrombosis, were verified based on routine diagnostic studies.
ZS Score Methodology
We created a novel ACS, namely ZS score, which was based on three parameters. Details of this ACS were shown in Figures 1 and 2.
FIGURE 1.
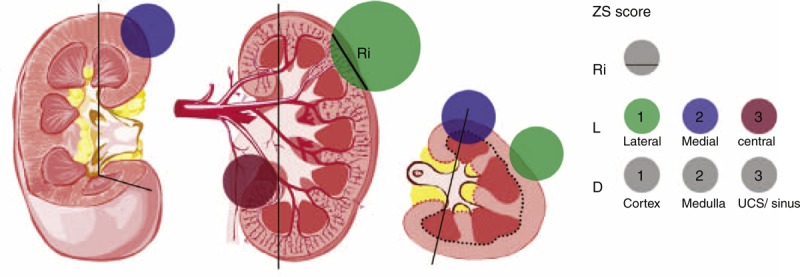
ZS score. Black vertical lines represent the medial lines; black and red dotted lines represent the depth of tumor invasion; green, purple, and red circles represent the lateral, medial, and central tumors, respectively. Arabic numerals represent the score points. Ri represents the maximum tumor diameter within renal parenchyma. L represents the physical location of the tumor. D represents the depth of tumor invasion.
FIGURE 2.
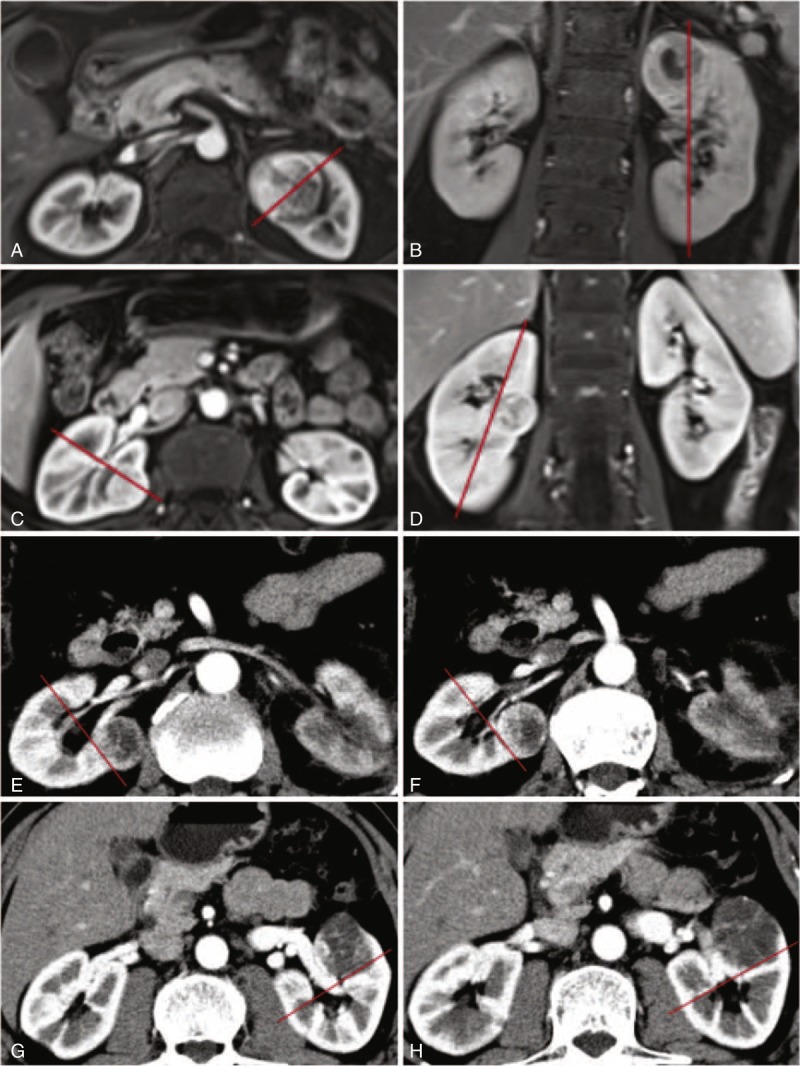
Definition of the medial line. A, B: medial location above higher polar line; C, D: medial location between polar lines; E, F: central location touching intrarenal segmental vessels; G, H: central location touching extrarenal and intrarenal vessels.
The first parameter was based on the maximum tumor diameter within renal parenchyma (Ri). The rounded value of Ri was included into the total scores.
The second parameter was the physical location (L) of the tumor. To define the physical location, the medial line was used as a topographical landmark to subdivide the kidney into lateral and medial zones. The medial line was an imaginary vertical line passing through the junctional area between medial cortex and medial calix. The lateral zone was assigned to a tumor located lateral to the medial line. The medial zone was assigned to a tumor touching the medial line. The medial line in the axial section was perpendicular to the one in the coronal section, which could form the medial plane. A renal tumor was defined as central location when it touched the extrarenal vessels (artery or/and vein) and/or intrarenal segmental vessels (artery or/and vein). Lateral location was assigned one point, medial location two points, and central location three points.
The final parameter was the depth (D) of tumor invasion. If the tumor was located solely within the renal cortex, it was assigned one point; if the tumor touched the renal medulla, it was given two points. Finally, if the tumor touched the urinary collecting system (UCS) and/or the renal sinus, it was given three points.
These three variables were then summed and tumors were stratified into three complexity levels. Low-risk tumors were scored between three and four, whereas moderate tumors were scored between five and seven, and high-risk tumors were scored greater than or equal to eight.
Statistical Analysis
Cases of conversion to RN (n = 64) were excluded from the analysis of patient demographics and clinical outcomes to avoid selection bias, but only included in the analysis of the conversion to RN. Patient demographics were investigated by generating the means, ranges, and standard deviation (SD) for each characteristic. Pearson correlation was used for parametric data. Spearman or phi correlation was used for nonparametric data. The point-biserial correlation was used for the correlation between a binary and continuous variable. Kruskal–Wallis test analyses were used to assess the relationships between categorized scores (low, moderate, and high complexity) and the perioperative variables. On finding a significant difference, Bonferroni adjusted pairwise comparisons were conducted using Mann–Whitney tests. Multivariate binary logistic regression analysis was used to study how the ACSs predicted the risk of complications when adjusted for clinical variables with a statistical significance. Receiver operating characteristic (ROC) curves were plotted and areas under the curve (AUCs) were calculated using a nonparametric distribution assumption for ACSs to predict complications. Interobserver concordance for calculating ZS score was assessed between two urologists. These two observers evaluated 89 patients who underwent NSS during 2014 in blinded fashion. Correlation between observers was measured using the Spearman correlation coefficient. A two-sided P < 0.05 was considered statistically significant. The data were analyzed using SPSS software version 20 (IBM Corp., Armonk, NY, USA).
RESULTS
In this study, 432 patients (59.6%) were men and 293 patients (40.4%) were women. The mean age was 51.2 (SD ± 12.3) years, and the mean BMI was 23.7 (SD ± 3.1) kg/m2. The mean of maximum tumor diameter was 3.0 (SD ± 1.9) cm and the mean of Ri was 2.2 (SD ± 1.0) cm (Supplementary Table S1, http://links.lww.com/MD/A198).
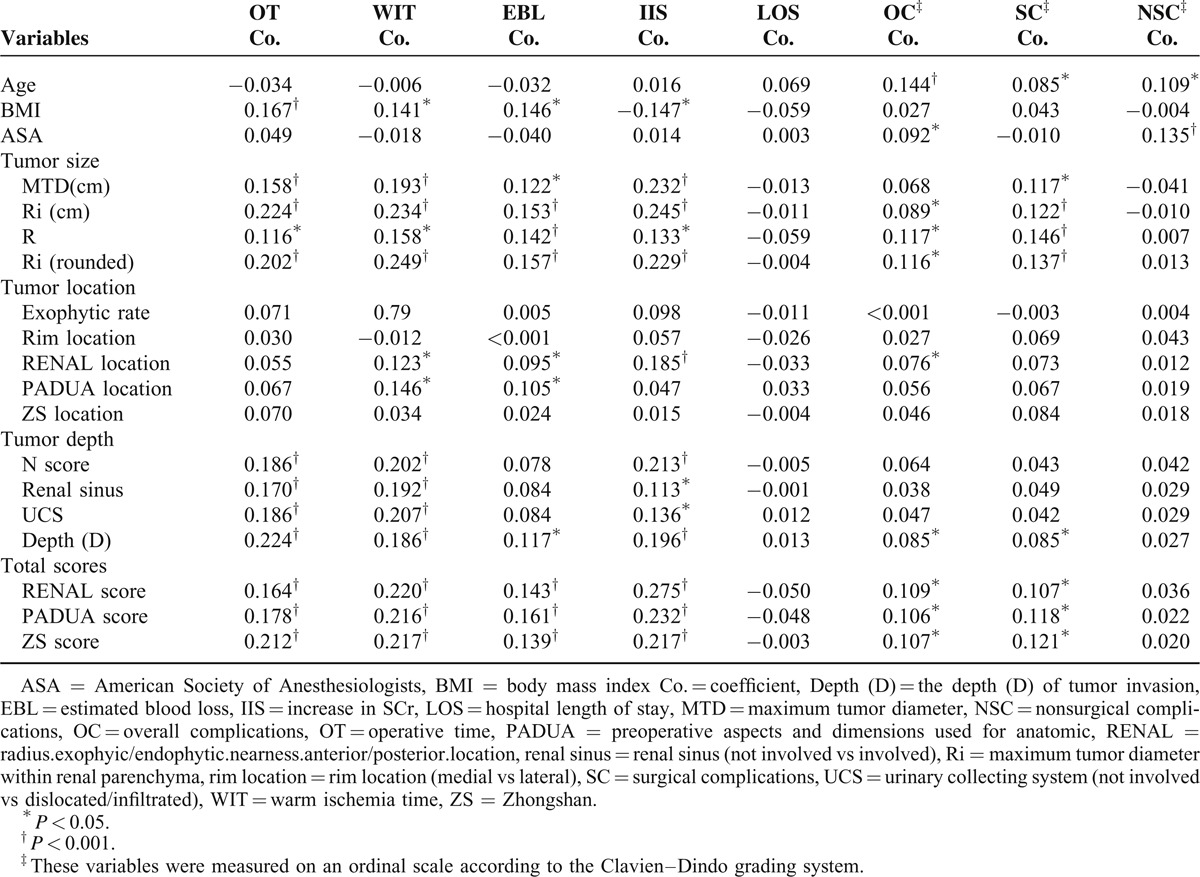
Of the independent variables we analyzed Ri had the highest correlation coefficients with OT (coefficient = 0.224) and increase in SCr (coefficient = 0.245) (all P < 0.001). Ri (rounded) had the highest correlation coefficients with WIT (coefficient = 0.249) and EBL (coefficient = 0.157) (all P < 0.001). Patient age showed significant correlation with overall, surgical, and nonsurgical complications, and had the highest correlation coefficient with overall complications (coefficient = 0.144) (all P < 0.05). ASA showed significant correlation with overall complications and nonsurgical complications, and had the highest correlation coefficient with nonsurgical complications (coefficient = 0.135) (all P < 0.05). Compared to the individual component, these three ACSs all performed at least somewhat better. However, the correlation coefficients were all less than 0.3, suggesting a weak correlation (Table 1).
TABLE 1.
Correlation Between Preoperative Variables and Clinical Outcomes
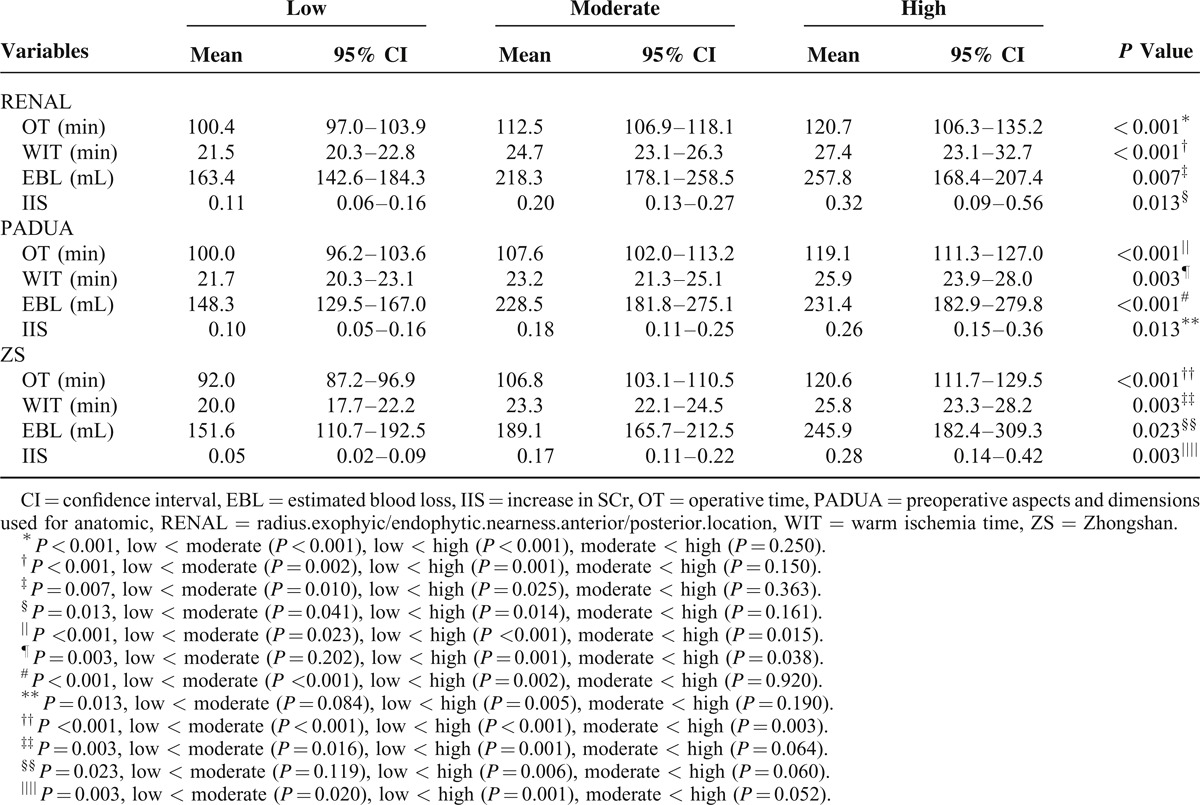
RENAL, PADUA, and ZS scores were divided into three groups, that is, high, moderate, and low scores. For OT, significant differences were seen between any two groups of ZS score and PADUA score (all P < 0.05) (Table 2). For ZS score, patients with moderate and high complexity tumors had longer WIT and greater increase in SCr compared with low complexity tumors (all P < 0.05). What is more, the differences between moderate and high complexity classified by ZS score were borderline but trending toward significance in WIT (P = 0.064) and increase in SCr (P = 0.052). For PADUA score, patients with moderate and low complexity tumors had shorter WIT compared with high complexity tumors (all P < 0.05). Interestingly, RENAL showed no significant difference between moderate and high complexity in OT, WIT, EBL, and increase in SCr.
TABLE 2.
Comparisons of Perioperative Results for Low, Moderate, and High RENAL, PADUA, and ZS Scores
Perioperative complications occurred in 94 patients (13.0%); of these, 52 (7.2%) were surgical complications and 42 (5.8%) nonsurgical complications. The proportion of patients incurring minor and major complications was 11.0% (n = 80) and 1.9% (n = 14), respectively (Supplementary table S2, http://links.lww.com/MD/A198). Multivariate binary logistic regression analysis (Table 3) was used to study how the ACSs predicted the risk of complications when adjusted for clinical variables with a statistical significance (patient age and ASA score, seen in Table 1). Compared with patients with a low score of ZS, those with a high or moderate score had 8.1-fold or 3.3-fold higher risk of surgical complications, respectively (all P < 0.05) (Table 3). As for RENAL score, patients with a high or moderate score had 5.7-fold or 1.9-fold higher risk of surgical complications, respectively (all P < 0.05). Interestingly, patients with a high or moderate score of PADUA had 2.3-fold or 2.8-fold higher risk of surgical complications, respectively (all P < 0.05). What is more, ZS score had the greatest AUC for surgical complications (AUC = 0.632, P = 0.002) and the conversion to RN (AUC = 0.845, P < 0.001) (Figure 3). In addition, patient age had the highest AUC for overall complications (AUC = 0.622, P < 0.001), and ASA score had the highest AUC for nonsurgical complications (AUC = 0.647, P = 0.002).
TABLE 3.
Multivariate Analysis to Predict Overall Complications, Surgical Complications and Nonsurgical Complications
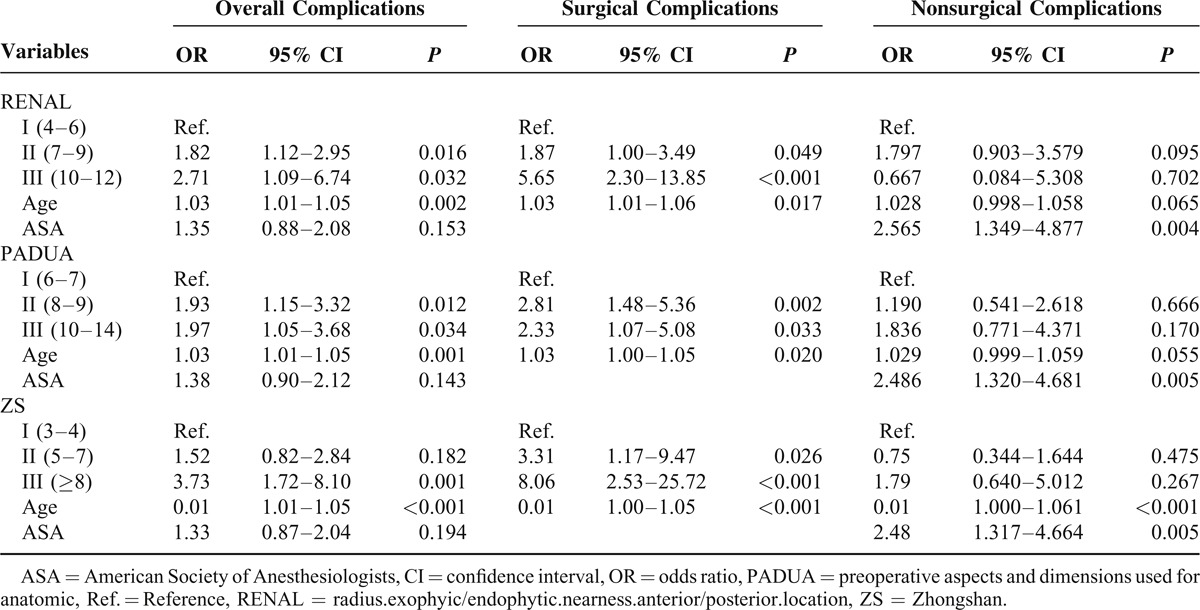
FIGURE 3.
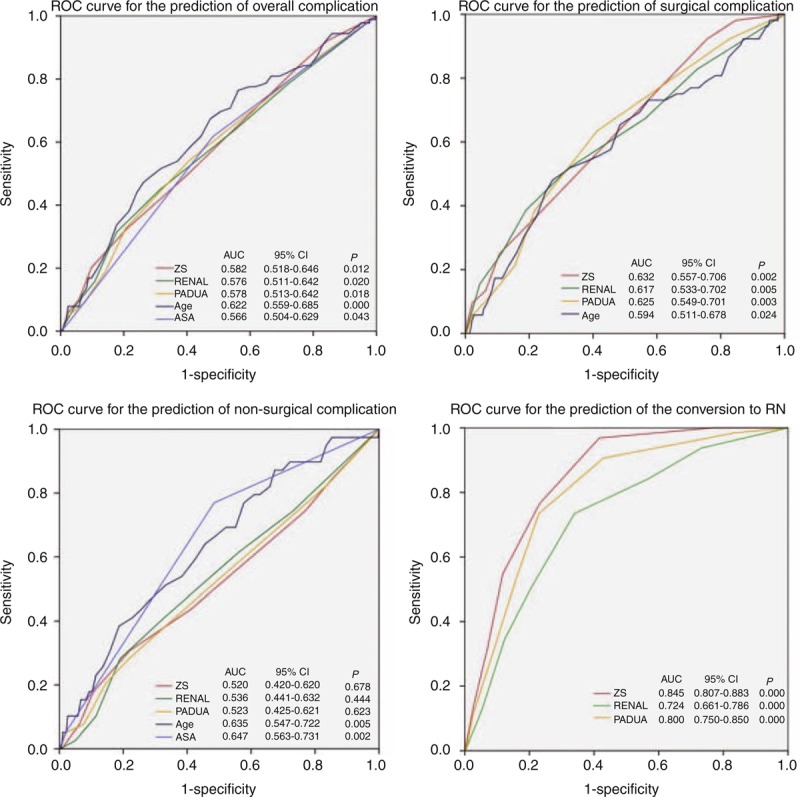
ROC curve for the prediction of complications and the conversion to RN. AUC = area under the curve, ASA = American Society of Anesthesiologists, CI = confidence interval, PADUA = preoperative aspects and dimensions used for anatomic, RENAL = radius.exophyic/endophytic.nearness.anterior/posterior.location, ROC = receiver operating characteristic, ZS = Zhongshan.
To assess for independent predictors of surgical complications, we started with a full logistic regression model including age, gender, BMI, ASA score, surgical approach, and ZS complexity groups (Supplementary table S3, http://links.lww.com/MD/A198). Age (OR: 1.04; 95% CI: 1.00–1.07; P = 0.03), male gender (OR: 2.75; 95% CI: 1.07–7.08; P = 0.035), minimally invasive surgery (OR: 0.001; 95% CI: 0.54–3.35; P < 0.001), and high-complexity category (OR: 9.80; 95% CI: 1.95–49.34; P = 0.006) were significantly associated with an increased risk of incurring a surgical complication. The moderate complexity had borderline predictive power of surgical complication rate (OR: 3.93; 95% CI: 0.89–17.25; P = 0.07).
The RENAL and PADUA systems were much more highly correlated for total score (0.848) and complexity score (0.820) than either was with ZS score (Supplementary table S4, http://links.lww.com/MD/A198). This suggests that while each system purports to capture the essence of surgical complexity, they are not all measuring the same characteristics in these tumors. Interobserver concordance of measurements was 95% for Ri, 85% for tumor location (L), 89% for tumor depth (D), and 95% for the sum ZS score in this study (all P < 0.001).
DISCUSSION
Although RENAL2 score and PADUA3 score were first proposed in 2009, being first never meant being best. In the ZS score, we redefined renal tumor size, location, and depth in a rigorously standardized fashion. Our analyses were performed on a large retrospective series of patients treated with either open or minimally invasive partial nephrectomy. To date, this is the largest retrospective analysis of comparison of different ACSs.
A previous publication reported evidence that increasing three-dimensional tumor volume of renal cell carcinoma (RCC) provided more prognostic information than tumor size alone in patients with pT1a RCC.20 However, the current TNM staging system uses greatest tumor diameter for size, and this raises the question of whether largest tumor size can be accurately used to estimate tumor volume. The main innovation in ZS score is the introduction of Ri, which is defined as the maximum tumor diameter within renal parenchyma. We found Ri had the highest correlation coefficients with OT, WIT, EBL, and increase in SCr (Table 1). It is logical that Ri is more correlated with the size of the renal defect caused by NSS than the maximum tumor diameter, and the size of the renal defect determines OT, WIT, EBL, and increase in SCr.
Nearly all the existing ACSs were focus on polar lines, which were used to subdivide the kidney into a superior pole, an inferior pole, and a midportion. However, these lines provided little meaningful information for surgeons. For NSS, medial tumors are more difficult than lateral tumors. The concept of rim location (medial vs lateral) was first presented in the PADUA score,3 but without clear definition. To define the lateral and the medial rims, we used the medial line as a topographical landmark to subdivide the kidney into lateral and medial zones. The medial line is an easily recognizable landmark on both axial and coronal images.
Graves21 presented the first detailed description of renal vascular segmentation in 1954 and depicted four renal segments, namely, apical, upper, middle, and posterior, supplied by their own segmental arteries with no collateral arterial supply between these segments. Further, Weld et al22 defined a presegmental vessel as a branch of the main renal artery that divided into two or more segmental arteries. The extrarenal arterial anatomy consists of presegmental and segmental branches of the main renal artery. Segmental artery clamping is anatomically feasible and minimizes the number of nephrons exposed to potential ischemic injury. Several varying definitions of a central/hilar tumor have been proposed in the literature.23–27 According to RENAL score, tumors that touch the main renal artery or vein are defined as hilar tumors.2 However, this definition ignores the branching pattern of the renal artery. Given the lack of a strict definition of central/hilar tumors as well as the importance of this issue for oncological and clinical outcome analysis, we defined a renal tumor as central location when it touched the extrarenal vessels and/or intrarenal segmental vessels. In other words, the branching pattern of the renal artery can be integrated with ZS score, thus facilitating NSS for precise segmental artery clamping.
The depth of tumor invasion has been well identified as an important variable that affects the facility of NSS and the postoperative complication rate.7,8,28 As for RENAL score, the parameter of tumor depth was based on proximity of the tumor edge to both collecting system and renal sinus, and was often difficult to accurately measure. As for PADUA, the correlation coefficient between renal sinus and UCS was 0.923 (P < 0.001), suggesting that it could be more appropriate to integrate these two parameters into one parameter. In the ZS score, the depth of tumor invasion is an intuitive parameter without measuring the distance, and easily recognized on both axial and coronal images. It is worth mentioning that the diameter of renal vessels increases with the depth of tumor invasion. In the renal sinus (the third level of depth), the segmental arteries branch into lobar arteries, which further subdivide in the renal parenchyma (the second level of depth) to form interlobar arteries. In the peripheral renal cortex (the first level of depth), the interlobar arteries branch into arcuate and interlobular arteries.
Although the previous ACSs have already been validated externally to some extent,29,30 the problem is that no standard defines the reporting of NSS outcomes for evaluating and comparing the efficacy of different ACSs. The safety profile of NSS was evaluated using the modified Clavien–Dindo classification.18 Recently, Buffi et al have proposed a new system, combining margin status of the tumor, ischemia time, and presence of perioperative complications to identify patients reaching the best early results after NSS.31 However, the more appropriate methods to evaluate NSS outcomes are still not standardized. The term “complication” is extremely broad and requires further classification. Previous observation found that longer anesthesia was associated with an increase in the incidence of perioperative nonurological complications.32 For this reason, we further classified the complication into surgical complication and nonsurgical complication. We found that ZS score had more predictive power of surgical complications than RENAL and PADUA. Compared with these three ACSs, patient age and ASA score had more predictive power of overall complications and nonsurgical complication. It is logical that a high complexity score has a direct relationship with increased risk of intraoperative transfusion, postoperative hemorrhage, urine leak, and AKI, while had only an indirect correlation with nonsurgical complications.
Over the last decade, the perception of “safe” WIT has decreased from 55–40 min to 30–20 min.33 Recently, Thompson et al have contended that every minute of ischemia counted.10 In some ways, WIT can reflect surgical complexity of NSS. As for OT, WIT, and increase in SCr, the classifying performance of ZS score is better than RENAL and PADUA (Table 2). Interestingly, RENAL showed no significant difference between moderate and high complexity in OT, WIT, EBL, and increase in SCr. Similarly, Okhunov et al34 found that RENAL and PAUDA scores could only differentiate tumors with low versus moderate/high complexity but not between tumors with moderate versus high complexity, suggesting that a two-tiered complexity classification may be more valid. What is more, ZS score had the greatest AUC for the occurrence of the conversion to RN (AUC = 0.85, P < 0.001). In our study, the ability of ZS score to predict the surgical complexity of NSS is better than RENAL and PADUA.
There are several limitations to the present study. First, our study is limited by the fact that it is retrospective in design, which imparts an inherent selection bias. Second, only patients with available cross-sectional imaging were included in this cohort. This could have incorporated an unintended bias into the dataset. Another potential drawback of this study is the validation of the ZS, RENAL, and PADUA scores only, not evaluating other ACSs.
In summary, ZS score is based on only three parameters and all of them are intuitive. Even junior doctor could easily master this system and it can be measured on axial or coronal images. ZS score is a simple ACS and could be used to reflect the surgical complexity and predict the risk of surgical complications in patients undergoing NSS.
Acknowledgments
We thank Yeqing Xu for his valuable collaboration with pictures. We thank Tingchang Bian and Yaohui Li for clinical data collection.
Footnotes
Abbreviations: ACS = anatomic classification system, AKI = acute kidney injury, ASA = American Society of Anesthesiologists, AUC = area under the curve, BMI = body mass index, CKD-EPI = Chronic Kidney Disease Epidemiology Collaboration, D = depth, EBL = estimated blood loss, GFR = glomerular filtration rate, L = location, LOS = length of stay, NSS = nephron-sparing surgery, OT = operative time, Ri = maximum tumor diameter within renal parenchyma, RN = radical nephrectomy, ROC = receiver operating characteristic, SCr = serum creatinine, SD = standard deviation, UCS = urinary collecting system, WIT = warm ischemia time, ZS = Zhongshan.
Lin Zhou and Jianming Guo: Contributed equally.
The authors have no funding and conflicts of interest to disclose.
Supplemental digital content is available for this article. Direct URL citations appear in the printed text and are provided in the HTML and PDF versions of this article on the journal's Website (www.md-journal.com).
REFERENCES
- 1.Ljungberg B, Cowan NC, Hanbury DC, et al. EAU guidelines on renal cell carcinoma: the 2010 update. Eur Urol 2010; 58:398–406. [DOI] [PubMed] [Google Scholar]
- 2.Kutikov A, Uzzo RG. The RENAL nephrometry score: a comprehensive standardized system for quantitating renal tumor size, location and depth. J Urol 2009; 182:844–853. [DOI] [PubMed] [Google Scholar]
- 3.Ficarra V, Novara G, Secco S, et al. Preoperative aspects and dimensions used for an anatomical (PADUA) classification of renal tumours in patients who are candidates for nephron-sparing surgery. Eur Urol 2009; 56:786–793. [DOI] [PubMed] [Google Scholar]
- 4.Simmons MN, Ching CB, Samplaski MK, et al. Kidney tumor location measurement using the C index method. J Urol 2010; 183:1708–1713. [DOI] [PubMed] [Google Scholar]
- 5.Simmons MN, Hillyer SP, Lee BH, et al. Diameter-axial-polar nephrometry: integration and optimization of R.E.N.A.L. and centrality index scoring systems. J Urol 2012; 188:384–390. [DOI] [PubMed] [Google Scholar]
- 6.Hakky TS, Baumgarten AS, Allen B, et al. Zonal NePhRO scoring system: a superior renal tumor complexity classification model. Clin Genitourin Cancer 2014; 12:E13–E18. [DOI] [PubMed] [Google Scholar]
- 7.Tannus M, Goldman SM, Andreoni C. Practical and intuitive surgical approach renal ranking to predict outcomes in the management of renal tumors: a novel score tool. J Endourol 2014; 28:487–492. [DOI] [PubMed] [Google Scholar]
- 8.Nisen H, Ruutu M, Glucker E, et al. Renal tumour invasion index as a novel anatomical classification predicting urological complications after partial nephrectomy. Scand J Urol 2014; 48:41–51. [DOI] [PubMed] [Google Scholar]
- 9.Gill IS, Aron M, Gervais DA, et al. Small renal mass. N Engl J Med 2010; 362:624–634. [DOI] [PubMed] [Google Scholar]
- 10.Thompson RH, Lane BR, Lohse CM, et al. Every minute counts when the renal hilum is clamped during partial nephrectomy. Eur Urol 2010; 58:340–345. [DOI] [PubMed] [Google Scholar]
- 11.Gill IS, Eisenberg MS, Aron M, et al. “Zero ischemia” partial nephrectomy: novel laparoscopic and robotic technique. Eur Urol 2011; 59:128–134. [DOI] [PubMed] [Google Scholar]
- 12.Shao P, Qin C, Yin C, et al. Laparoscopic partial nephrectomy with segmental renal artery clamping: technique and clinical outcomes. Eur Urol 2011; 59:849–855. [DOI] [PubMed] [Google Scholar]
- 13.Ng CK, Gill IS, Patil MB, et al. Anatomic renal artery branch microdissection to facilitate zero-ischemia partial nephrectomy. Eur Urol 2012; 61:67–74. [DOI] [PubMed] [Google Scholar]
- 14.Smith GL, Kenney PA, Lee Y, et al. Non-clamped partial nephrectomy: techniques and surgical outcomes. BJU Int 2011; 107:1054–1058. [DOI] [PubMed] [Google Scholar]
- 15.Wang H, Zhou L, Guo J, et al. Mini-flank supra-12th rib incision for open partial nephrectomy compared with laparoscopic partial nephrectomy and traditional open partial nephrectomy. PLoS One 2014; 9(2). [DOI] [PMC free article] [PubMed] [Google Scholar]
- 16.Levey AS, Stevens LA, Schmid CH, et al. A new equation to estimate glomerular filtration rate. Ann Intern Med 2009; 150:604–612. [DOI] [PMC free article] [PubMed] [Google Scholar]
- 17.Lane BR, Babineau DC, Poggio ED, et al. Factors predicting renal functional outcome after partial nephrectomy. J Urol 2008; 180:2363–2368. [DOI] [PubMed] [Google Scholar]
- 18.Dindo D, Demartines N, Clavien PA. Classification of surgical complications - a new proposal with evaluation in a cohort of 6336 patients and results of a survey. Ann Surg 2004; 240:205–213. [DOI] [PMC free article] [PubMed] [Google Scholar]
- 19.Bellomo R, Ronco C, Kellum JA, et al. Acute renal failure-definition, outcome measures, animal models, fluid therapy and information technology needs: the Second International Consensus Conference of the Acute Dialysis Quality Initiative (ADQI) Group. Crit Care 2004; 8:R204–R212. [DOI] [PMC free article] [PubMed] [Google Scholar]
- 20.Jorns J, Thiel DD, Lohse CM, et al. Three-dimensional tumour volume and cancer-specific survival for patients undergoing nephrectomy to treat pT1 clear-cell renal cell carcinoma. BJU Int 2012; 110:956–960. [DOI] [PubMed] [Google Scholar]
- 21.Graves FT. The anatomy of the intrarenal arteries and its application to segmental resection of the kidney. Br J Surg 1954; 42:132–139. [DOI] [PubMed] [Google Scholar]
- 22.Weld KJ, Bhayani SB, Belani J, et al. Extrarenal vascular anatomy of kidney: assessment of variations and their relevance to partial nephrectomy. Urology 2005; 66:985–989. [DOI] [PubMed] [Google Scholar]
- 23.Black P, Filipas D, Fichtner J, et al. Nephron sparing surgery for central renal tumors: experience with 33 cases. J Urol 2000; 163:737–743. [PubMed] [Google Scholar]
- 24.Hafez KS, Novick AC, Butler BP. Management of small solitary unilateral renal cell carcinomas: impact of central versus peripheral tumor location. J Urol 1998; 159:1156–1159. [PubMed] [Google Scholar]
- 25.Drachenberg DE, Mena OJ, Choyke PL, et al. Parenchymal sparing surgery for central renal tumors in patients with hereditary renal cancers. J Urol 2004; 172:49–53. [DOI] [PubMed] [Google Scholar]
- 26.Brown JA, Hubosky SG, Gomella LG, et al. Hand assisted laparoscopic partial nephrectomy for peripheral and central lesions: a review of 30 consecutive cases. J Urol 2004; 171:1443–1446. [DOI] [PubMed] [Google Scholar]
- 27.Frank I, Colombo JR, Rubinstein M, et al. Laparoscopic partial nephrectorny for centrally located renal tumors. J Urol 2006; 175:849–852. [DOI] [PubMed] [Google Scholar]
- 28.Weizer AZ, Gilbert SM, Roberts WW, et al. Tailoring technique of laparoscopic partial nephrectomy to tumor characteristics. J Urol 2008; 180:1273–1278. [DOI] [PubMed] [Google Scholar]
- 29.Hayn MH, Schwaab T, Underwood W, et al. RENAL nephrometry score predicts surgical outcomes of laparoscopic partial nephrectomy. BJU Int 2011; 108:876–881. [DOI] [PubMed] [Google Scholar]
- 30.Simhan J, Smaldone MC, Tsai KJ, et al. Objective measures of renal mass anatomic complexity predict rates of major complications following partial nephrectomy. Eur Urol 2011; 60:724–730. [DOI] [PMC free article] [PubMed] [Google Scholar]
- 31.Buffi N, Lista G, Larcher A, et al. Margin, ischemia, and complications (MIC) score in partial nephrectomy: a new system for evaluating achievement of optimal outcomes in nephron-sparing surgery. Eur Urol 2012; 62:617–618. [DOI] [PubMed] [Google Scholar]
- 32.Routh JC, Bacon DR, Leibovich BC, et al. How long is too long? The effect of the duration of anaesthesia on the incidence of non-urological complications after surgery. BJU Int 2008; 102:301–304. [DOI] [PubMed] [Google Scholar]
- 33.Godoy G, Ramanathan V, Kanofsky JA, et al. Effect of warm ischemia time during laparoscopic partial nephrectomy on early postoperative glomerular filtration rate. J Urol 2009; 181:2438–2443. [DOI] [PubMed] [Google Scholar]
- 34.Okhunov Z, Rais-Bahrami S, George AK, et al. The comparison of three renal tumor scoring systems: C-Index, PADUA, and RENAL nephrometry scores. J Endourol 2011; 25:1921–1924. [DOI] [PubMed] [Google Scholar]


