Supplemental Digital Content is available in the text
Abstract
To summarize the performance of CT-based main pulmonary artery diameter or pulmonary artery to aorta ratio (PA:A ratio) measurement in detection of pulmonary hypertension by a systematic review and meta-analysis.
A comprehensive literature search was performed to identify studies determining diagnostic accuracy of main pulmonary artery diameter or PA:A ratio measurement for pulmonary hypertension. The Quality Assessment of Diagnostic Accuracy Studies tool was used to assess the quality of the included studies. A bivariate random-effects model was used to pool sensitivity, specificity, positive/negative likelihood ratio (PLR/NLR), and diagnostic odds ratio (DOR). Summary receiver operating characteristic (SROC) curves and area under the curve (AUC) were used to summarize overall diagnostic performance.
This meta-analysis included 20 publications involving 2134 subjects. Summary estimates for main pulmonary artery diameter measurement in the diagnosis of pulmonary hypertension were as follows: sensitivity, 0.79 (95% CI 0.72–0.84); specificity, 0.83 (95% CI 0.75–0.89); PLR, 4.68 (95% CI 3.13–6.99); NLR, 0.26 (95% CI 0.20–0.33); DOR, 18.13 (95% CI 10.87–30.24); and AUC 0.87. The corresponding summary performance estimates for using the PA:A ratio were as follows: sensitivity, 0.74 (95% CI 0.66–0.80); specificity, 0.81 (95% CI 0.74–0.86); PLR, 3.83 (95% CI, 2.70–5.43); NLR, 0.33 (95% CI 0.24–0.44); DOR, 11.77 (95% CI 6.60–21.00); and AUC 0.84.
Both main pulmonary artery diameter and PA:A ratio are helpful for diagnosing pulmonary hypertension. Nevertheless, the results of pulmonary artery measurement should be interpreted in parallel with the results of traditional tests such as echocardiography.
INTRODUCTION
Pulmonary hypertension (PH) is a progressive disease of multifactorial etiology, it is hemodynamically defined by a mean pulmonary artery pressure (mPAP) ≥25 mm Hg.1,2 PH places a heavy burden on patients because it reduces life quality, work ability, and increases disability. The prognosis of PH is not optimistic, if PH cannot be detected and treated at an early stage, it can lead to progressive right ventricular failure with a high-mortality rate.3,4 It was reported that in a registry of patients with World Health Organization group 1 PH before the advent of effective medical therapy, the survival rates was only 44% at 5 years, with an estimated median survival of only 2.8 years,5 and a 5-year survival of 61.1% was found in a recent cohort of idiopathic, heritable, and anorexigen-associated PH patients.6 Thus, to make an early and accurate diagnostic evaluation of PH will be of great value in facilitating optimal treatment of PH when possible.
The accurate diagnosis of PH remains a clinical challenge, its diagnostic process is complex and requires a high index of clinical suspicion from even the most experienced clinicians. There are several methods to evaluate patients with suspected PH. Echocardiography is commonly used to screen suspected PH patients,7 one recent published meta-analysis suggested that its pooled sensitivity and specificity were 83% and 72%, respectively, with a modest diagnostic accuracy.8 In addition, the diagnostic accuracy of echocardiography depends on several factors, including body habitus, detectable tricuspid regurgitation, heart rate, and the experiences of operators, which limit its clinical application.7,8 Cardiovascular magnetic resonance is another non-invasive diagnostic tool to detect PH, while it seems to only have a moderate sensitivity and specificity.9 Right heart catheterization (RHC) is the gold standard for the establishment of PH diagnosis. However, it is invasive, and requires exposure to contrast and ionizing radiation when appropriate, and does not supply morphologic information.10 In addition, it is a procedure with some morbidity and mortality even when performed in large-volume medical centers with experienced doctors.10 Therefore, it highlights the need to develop noninvasive techniques to detect PH.
Since the current available tests have yet proved to be completely satisfactory, the search for improved methods continues. Computed tomography (CT) has been routinely performed in patients with different causes of pulmonary diseases, patients with suspected PH or with non-specific symptoms of PH will undergo CT examination as part of their diagnostic work-up. An increase in the diameter of pulmonary arteries, particularly the main pulmonary artery diameter (mPAD), has been shown to be a useful parameter for detection and assessment of PH,11 and a number of studies regarding the diagnostic potential of mPAD as well as pulmonary artery to aorta ratio (PA:A ratio) have been extensively studied.12 But how reliable are pulmonary artery measurements in predicting PH? Studies have come to conflicting answers about whether measurement of mPAD or PA:A ratio can provide adequate diagnostic power and come to similarly conflicting conclusions.13–15 To help gain more reliable insights, we meta-analyzed the studies based on using mPAD or PA:A ratio measurement to detect PH.
MATERIALS AND METHODS
This meta-analysis was carried out according to the guidelines of the Preferred Reporting Items for Systematic Reviews, and the methods recommended by the Cochrane Diagnostic Test Accuracy Working Group.16 Institutional review board approval was not required for this retrospective meta-analysis.
PUBMED and EMBASE were used as search engines to identify relevant publications up to April 2014. The following search terms were used as Medical Headings and/or text words: “pulmonary artery diameter,” “pulmonary artery to aorta ratio,” “computed tomography,” and “pulmonary hypertension.” The syntax for the PUBMED searches was as follows: “pulmonary artery diameter” OR “pulmonary artery to aorta ratio” AND “computed tomography” AND “pulmonary hypertension.” We also checked the reference lists of the included publications and review articles to identify potential studies.
Inclusion criteria were defined as follows: (1) it should be original article published in English; (2) it examined the ability of mPAD or PA:A ratio measurement for detecting PH in human subjects; (3) there is clear definition of PH and the patients were in stable stage; and (4) it reported sufficient data to calculate sensitivity and specificity. Conference and studies published only as abstracts were excluded for limited information. To avoid selection bias, studies with fewer than 20 patients were also excluded. The quality of the included studies was assessed using the 14-items quality assessment of diagnostic accuracy studies (QUADAS) list.17 Incase of disagreement, the 2 reviewers arrived at a consensus.
Two reviewers independently extracted data, in studies containing both a training group and a validation group, each group was treated as a single study in the meta-analysis. Using bivariate regression, the pooled estimates of sensitivity and specificity were used as the main outcome measures, this bivariate approach also investigates potential between-study heterogeneity and takes into account possible correlation between sensitivity and specificity, based on the pooled estimates of sensitivity and specificity, we calculated positive likelihood ratios (PLR), negative likelihood ratios (NLR), and diagnostic odds ratios (DOR), which we used as an overall index of diagnostic accuracy. Summary receiver operating characteristic (SROC) curves and area under the curve (AUC) were also calculated to summarize the overall diagnostic performance.
Heterogeneity was assessed using the I2 inconsistency test. I2 >50% indicated substantial heterogeneity, which was then analyzed through meta-regression to investigate the possible source of heterogeneity.17 Post-test probability was calculated using the overall prevalence of 20% with Fagan nomograms. Potential publication bias was evaluated by Deeks's funnel plot.18 All analyses were performed using the “Midas” module in STATA 12.0 (Stata Corp., College Station, TX) and Meta-DiSc 1.4 for Windows (XI, Cochrane Colloquium, Barcelona, Spain). All statistical tests were 2-sided, a P value less than 0.05 was considered for statistical significance.
RESULTS
After systematically literature search, a total of 378 publications, of which 51 potentially relevant studies were selected for further evaluation, and finally, 20 publications were included.19–38 Studies were excluded mainly because they did not report sufficient data to construct 2 × 2 tables, or they did not perform CT examinations. Figure 1 outlines the process of selecting studies.
FIGURE 1.
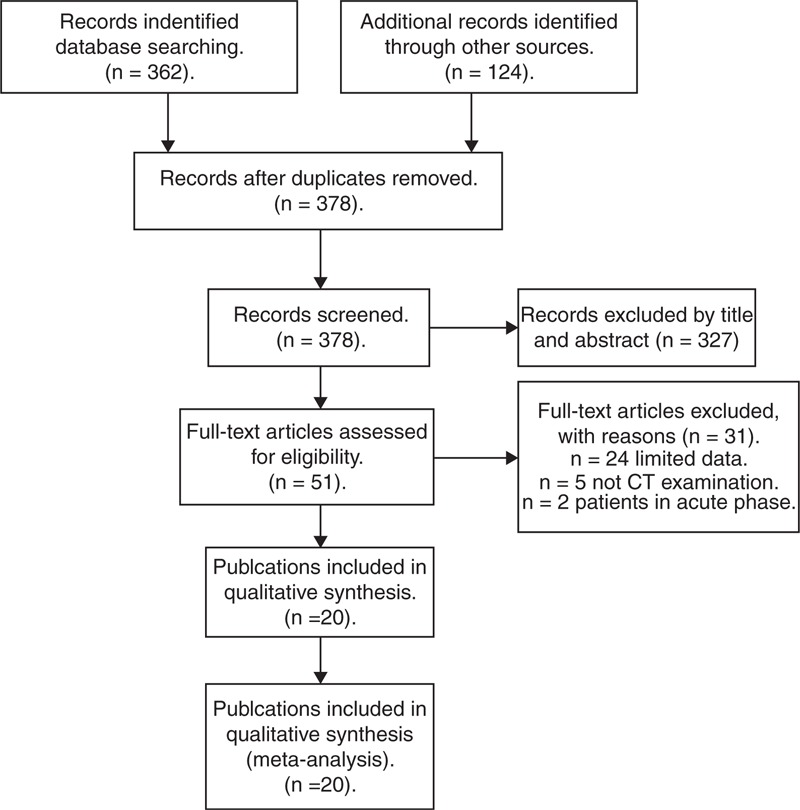
Flow diagram of study selection.
Quality of Reporting and Study Design
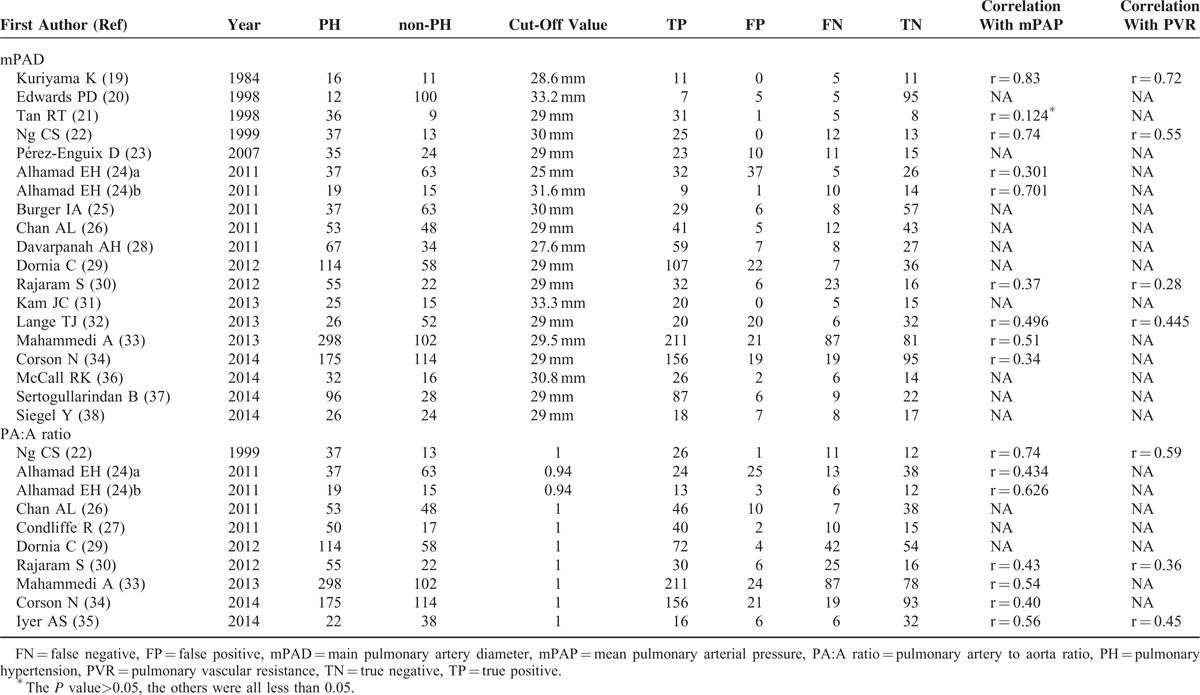
The final set of 20 publications (21 studies) involved 2134 subjects, comprising 1268 PH patients, and 866 subjects without PH. Of the included studies, 19 studies examined the ability of mPAD to distinguish PH from non-PH subjects, and 10 assessed the ability of the PA:A ratio to do so. Included studies were published between 1984 and 2014. In all included studies, most studies used RHC as the gold standard to diagnose PH, which is widely considered as an acceptable basis for PH diagnosis, 3 studies only used echocardiography as diagnostic reference.25,37,38 Of the 20 publications, 15 had QUADAS scores ≥9, suggesting the reliable of our results. Tables 1 and 2 summarized the clinical characteristics of the studies, patient distribution in each study as well as the QUADAS scores for each publication.
TABLE 1.
Clinical Summary of Included Studies
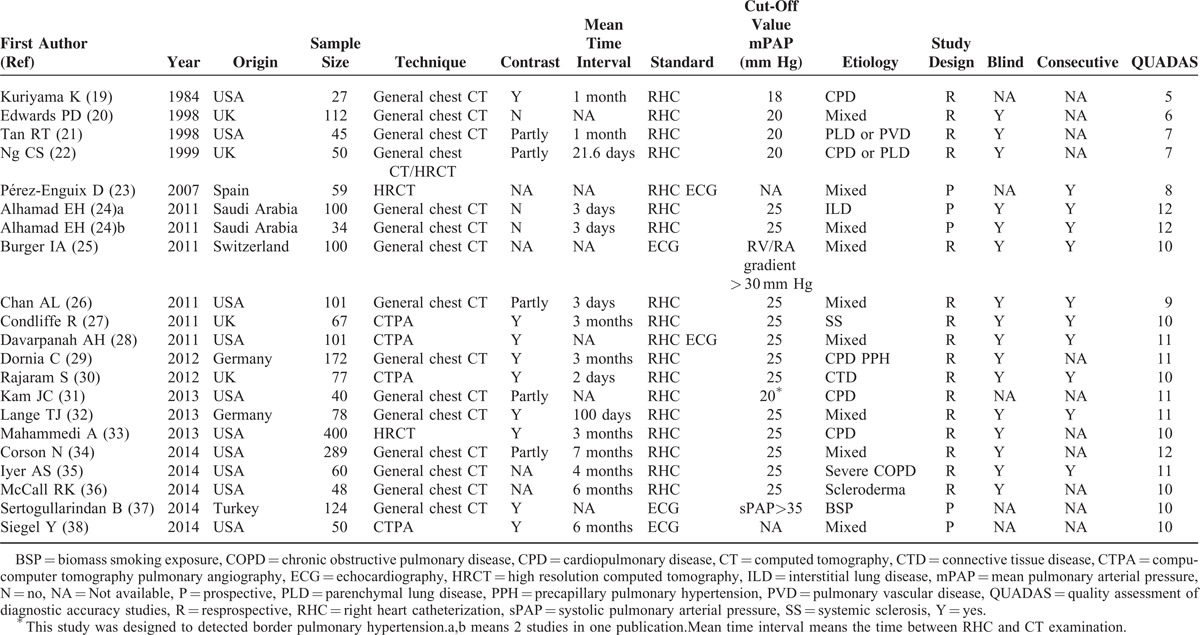
TABLE 2.
Patients Distribution and Correlation With mPAP and PVR
Diagnostic Accuracy of mPAD Measurement
The following pooled parameters were calculated over all 19 studies examining mPAD measurement for diagnosing PH: sensitivity, 0.79 (95% CI: 0.72–0.84); specificity, 0.83 (95% CI: 0.75–0.89); PLR, 4.68 (95% CI: 3.13–6.99) (Figure 2); NLR, 0.26 (95% CI: 0.20–0.33) (Figure 2); and DOR, 18.13 (95% CI: 10.87–30.24). All 5 performance indices showed high I2 values: SEN, 80.43%; SPE, 84.73%; PLR, 76.18%; NLR, 77.35%; and DOR, 99.81% (all with P < 0.05). This suggests substantial heterogeneity among included studies.
FIGURE 2.
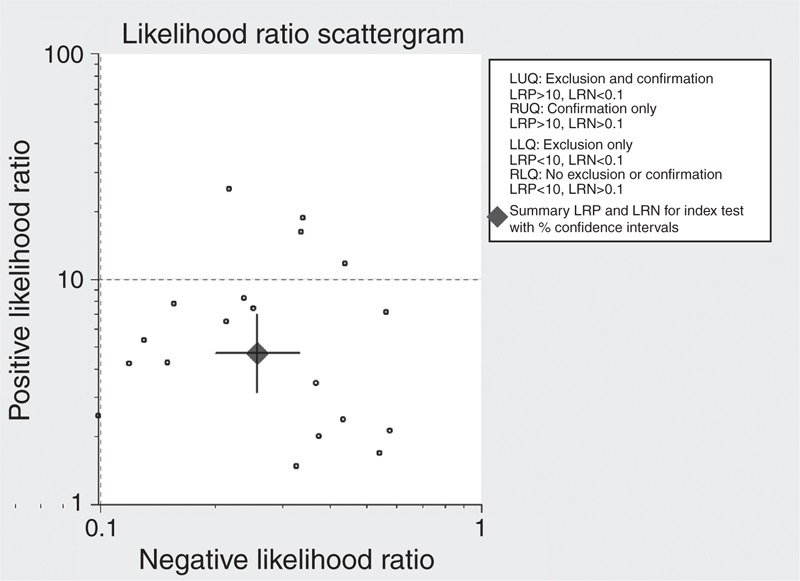
Scatterplot of the positive likelihood ratio (PLR) and negative likelihood ratio (NLR) when using mPAD measurements to diagnose PH.
The SROC curve was shown in Figure 3, which shows a plot of the rate of true positives as a function of the rate of false positives for individual studies. We plotted the observed and predicted ellipses at a 95% CI. The AUC was 0.87 (95% CI: 0.84–0.90), indicating a good discriminatory ability of mPAD measurement. Fagan's nomogram for likelihood ratios indicated that using mPAD to detect PH increased the post-probability to 54% when the results were positive and reduced the post-probability to 6% when the results were negative (Figure 4).
FIGURE 3.
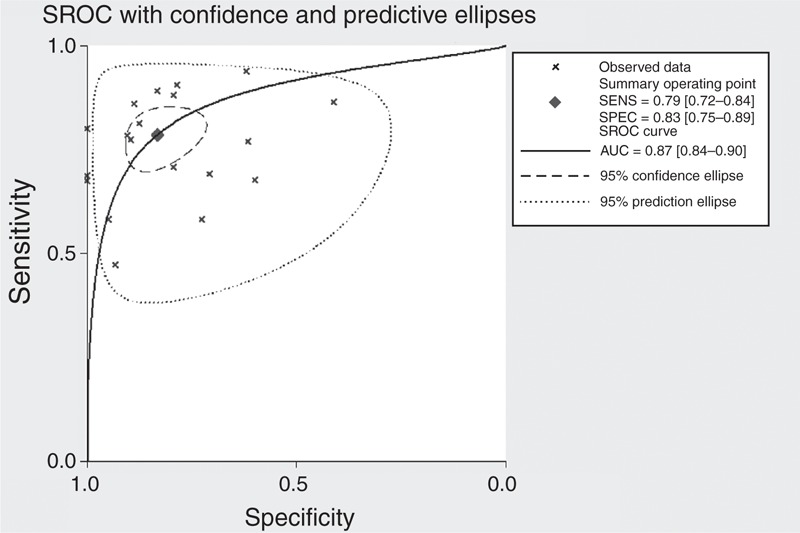
Summary receiver operating characteristic (SROC) curve for mPAD measurements to diagnose PH.
FIGURE 4.
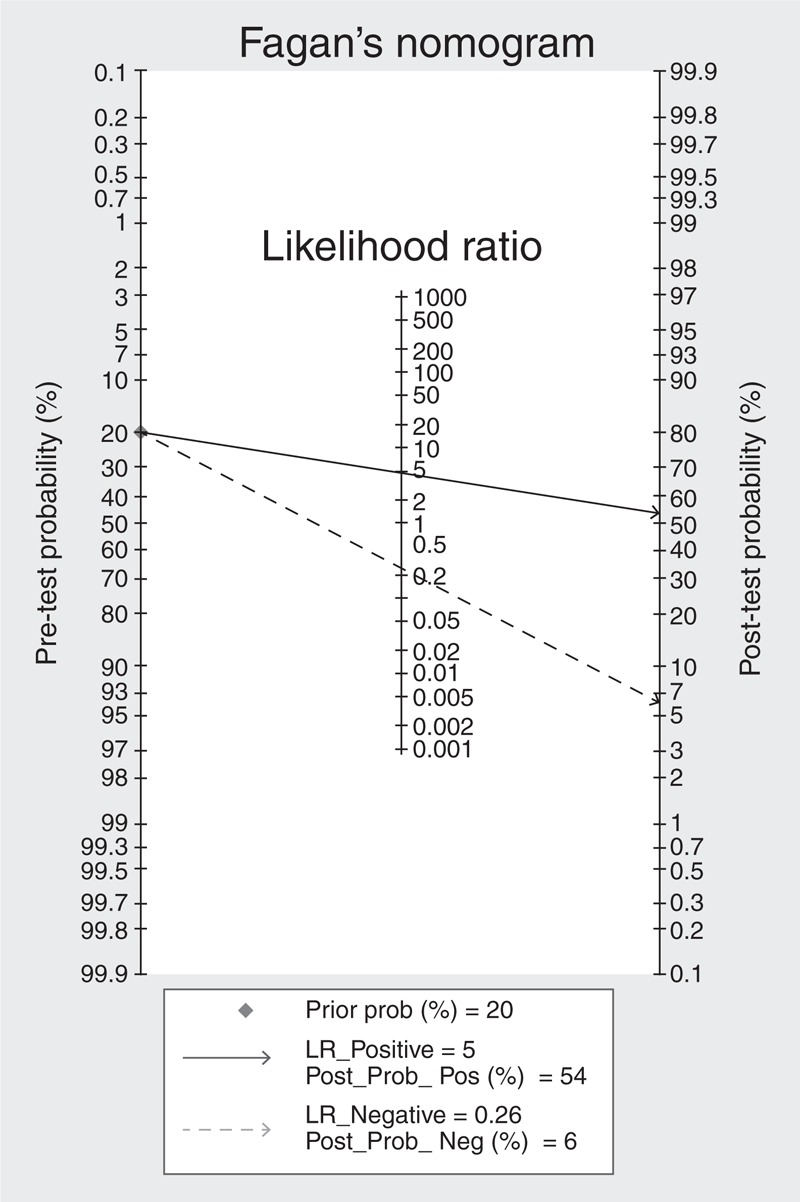
Fagan's nomogram for likelihood ratios and pre- and post-test probabilities for using mPAD measurements to diagnose PH.
Significant heterogeneity was identified among included studies, so we performed a meta-regression analysis to explore the possible sources of heterogeneity. We used several covariates in the present meta-regression: (1) publication year (before 2000 vs after 2000); (2) sample size (<100 subjects vs ≥100 subjects); (3) contrast use (yes vs no/not reported); (4) procedure interval (<3 months vs ≥3 months); (5) QUADAS score (<10 vs ≥10); (6) design (prospective vs retrospective);(7) blinding (yes vs no/not reported); and (8) sampling method (consecutive vs nonconsecutive/random/not reported). The outcomes of the meta-regression are shown in supplementary Table 1, http://links.lww.com/MD/A99. In the present study, except sample size (P < 0.05), the other of the above covariates were not found to be the significant source of heterogeneity(P > 0.05), suggesting the heterogeneity may be from sample size or other un-defined covariates.
Diagnostic Accuracy of the PA:A Ratio
A total of 10 studies with 1350 subjects examined the ability of the PA:A ratio to distinguish PH from non-PH subjects. Table 3 summarized the sensitivity, specificity, PLR, NLR, and DOR. The AUC was 0.84 (95% CI: 0.81–0.87), suggesting moderate overall accuracy (Figure 5).
TABLE 3.
Diagnostic Summary of mPAD and PA:A Ratio

FIGURE 5.
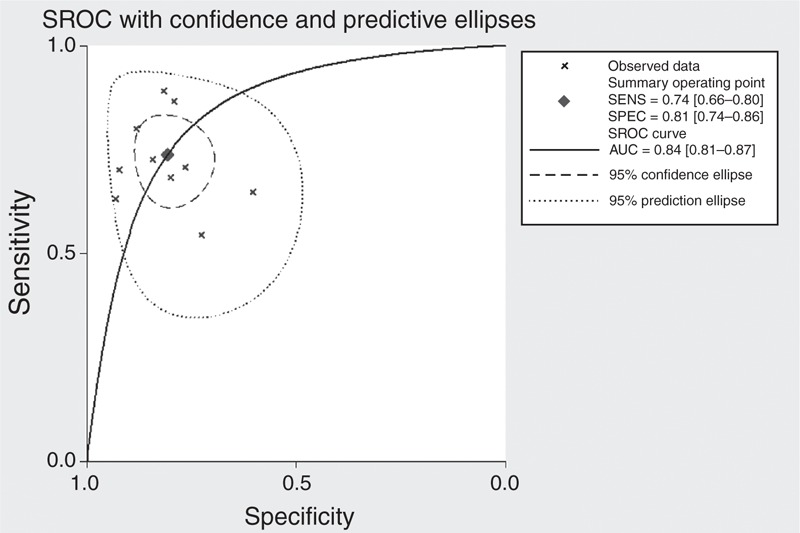
Summary receiver operating characteristic (SROC) curve for using the pulmonary artery to aorta ratio to diagnose pulmonary hypertension.
Publication Bias
Deeks’ funnel plot asymmetry test was used to assess likelihood of publication bias in the final set of studies. The slope coefficients for mPAD and PA:A ratio were associated with a P value of 0.89 and 0.68, respectively, suggesting symmetry in the data and low likelihood of such bias (Figure 6).
FIGURE 6.
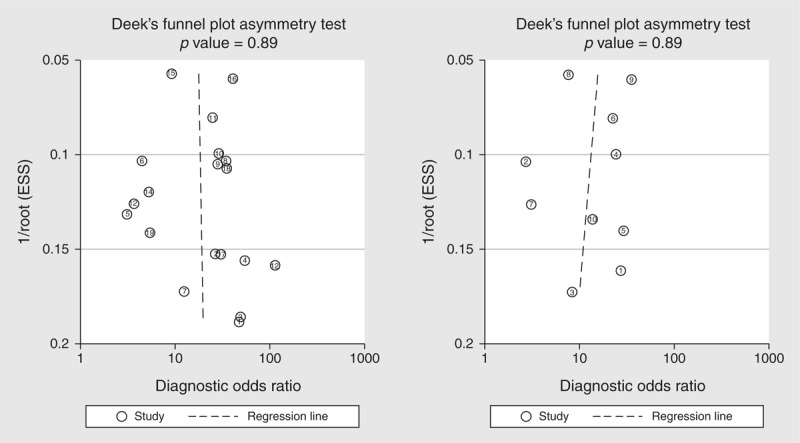
Deek's funnel plot to assess the likelihood of publication bias.
DISCUSSION
In this study, we summarized the overall diagnostic performance of mPAD and PA:A measurement for PH, and our meta-analysis suggests that both mPAD and PA:A ratio measurement play a role in diagnosing PH, though they probably cannot stand on their own and they should be used in combination with other traditional tests.
Our meta-analysis showed that mPAD measurement was associated with medium sensitivity (0.79, 95% CI: 0.72–0.84) and specificity (0.83, 95% CI: 0.75–0.89), suggesting a relative high rate of missed diagnosis (21%) and misdiagnosis (17%). The SROC curve illustrates overall test performance, our SROC analysis showed an AUC of 0.87, suggesting a good overall accuracy. DOR is another indicator of diagnostic accuracy, with higher values indicating better discriminatory test performance. Pooled DOR in our meta-analysis was 18.13, suggesting that measurement of mPAD should be helpful in the diagnosis of PH. PLR and NLR were also used to determine the diagnostic accuracy, which are easier to understand in clinical practice.39 The pooled PLR value of 4.68 suggests that PH patients have an approximately 5-fold higher chance of giving a positive mPAD test result than do patients without PH. At the same time, the pooled NLR was 0.26, indicating that a negative mPAD test result is 26% likely to be a false negative, which is not low enough to rule out PH. In addition, our results revealed that PA:A ratio showed lower sensitivity of 0.74 (95% CI: 0.66–0.80), and the AUC was 0.84, suggesting that the PA:A ratio shows medium discriminatory ability.
In fact, several studies have been published and summarized the overall diagnostic accuracy of echocardiography and cardiovascular magnetic resonance for PH.8,9,40,41 (Supplementary Table 2, http://links.lww.com/MD/A99). To our best knowledge, our study is the first meta-analysis that evaluated the accuracy of CT-based pulmonary artery measurement for PH. When compared with echocardiography and cardiovascular magnetic resonance, our meta-analysis included the largest population, and showed highest specificity. The SROC curve analysis suggested that the diagnostic performance of CT is even better than echocardiography. However, echocardiography remains the first choice for suspected PH patients, it can provide a comprehensive functional assessment comparable with that of invasive hemodynamic measurements in patients who undergo RHC and it can be used to rule in and rule out PH and increased PVR, and echocardiography-derived new technique is helpful for assessing right ventricular function, which is associated with mortality in PH paitients.42–44 Echocardiography also plays an important role in assessing outcomes, monitoring the efficacy of specific therapeutic interventions for PH.7 What should be point out is that, echocardiography plays the starring role and current CT examination is not the first imaging technique to diagnose PH. In our meta-analysis, many of the patients included in studies were referred to CT for specific reasons, particularly chronic obstructive pulmonary disease, cardiovascular disorders, or other diseases where CT plays an important role and the mPAD and PA:A ratio will come for free. Although CT examination is a routine used technique for patients suspected with lung diseases, for PH diagnosis, echocardiography remains the first choice, this comprehensive analysis of the diagnostic accuracy of CT-based pulmonary artery measurement suggests that this indicator may not be reliable enough on its own but should instead be used in conjunction with other conventional tests, such as echocardiography, rather than to replace echocardiography.
Growing studies pay attention to the clinical significance of measurement of mPAD and PA:A ratio other than their diagnostic performance. Devaraj et al45 reported that pulmonary arterial enlargement on CT scans is a highly significant prognostic indicator in the evaluation of patients with bronchiectasis. In 2012, Żyłkowska et al46 also reported that pulmonary artery dilatation emerges as an independent risk factor for death unexplained by right ventricular failure or comorbidities in patients with pulmonary arterial hypertension and chronic thromboembolic PH, which may be caused by pulmonary artery compression of the left main coronary artery, pulmonary artery rupture, or dissection with cardiac tamponade. Wells et al47 reported that CT-detected pulmonary artery enlargement (defined as PA:A ratio of >1) was associated with severe exacerbations of chronic obstructive pulmonary disease, it was related to prognosticate chronic obstructive pulmonary disease progression, acute exacerbations, and hospitalizations. All these studies suggest that pulmonary artery measurement may be an important tool for non-invasive clinical surveillance and supply more information for the comprehensive management of PH patients. Based on this, detection of pulmonary artery dilation may be used to guide treatment decision-making and identify patients whom will get the most clinical benefits from therapy.48
For clinical utility, there are several points that should be addressed. First of all, CT examination's sensitivity is not that high as expected, it should be function as a surrogate diagnostic method for PH, rather than to replace RHC, or echocardiography. Secondly, in Table 2, we summarized the available correlation of mPAP and CT determined mPAD and PA:A ratio, these studies suggested that CT determined mPAD or PA:A ratio has good correlation with mean pulmonary arterial pressure, we propose that CT scanning can serve as a qualitative rather than as a quantitative tool in the assessment of PH. Thirdly, the clinical utility of CT to detect PH should pay attention to the etiology of patients, Devaraj et al49 reported that pulmonary artery dilatation occurs in the absence of PH in patients with pulmonary fibrosis and is therefore an unreliable sign of PH in these patients. The lack of reliability of pulmonary artery dilation in PH detection in pulmonary fibrosis patients also raises the question as whether it is applicable in other pulmonary diseases conditions, since the mPAD is not absolutely affected by pulmonary arterial pressure in these diseases.50 Last but not least, the standard of CT measurement to diagnose PH in has not been founded, for mPAD measurement, the cut-off value ranges from 25 to 33.2 mm, this variation in cut-off value partly reflects differences in clinical context, but, further work should aim to identify the cut-off value that provides optimal diagnostic accuracy.
For interpretation the findings of this meta-analysis, several limitations should be addressed. Our strict inclusion and exclusion criteria may have helped reduce selection bias, but they led to a relatively small final set of studies for which statistical power may be inadequate for drawing definitive conclusions about the ability of pulmonary artery determination to discriminate between PH and non-PH subjects. We also detected substantial heterogeneity across the included studies, and subgroup analyses suggest that differences in sample size may account for the possible heterogeneity, and future studies should aim for greater rigor in order to decrease the risk of bias. In addition, our results may be biased by our omission of unpublished studies, studies published in other languages, and studies published in journals not indexed in the databases we searched.16
CONCLUSION
Taken together, our meta-analysis suggests that CT-based mPAD and PA:A ratio measurement may play an important role in aiding diagnosis of PH. In the near future, CT-based pulmonary artery measurement may prove useful as a non-invasive confirmatory test to complement current diagnosing procedures for PH.
Footnotes
Abbreviations: AUC = area under the curve, CT = computed tomography, DORdiagnostic odds ratio = mPAD, main pulmonary artery diameter = mPAP, mean pulmonary artery pressure = NLR, negative likelihood ratio = PA:Aratio, pulmonary artery to aorta ratio = PH, pulmonary hypertension = PLR, positive likelihood ratio = QUADAS, quality assessment of diagnostic accuracy studies = RHC, right heart catheterization = SROC, summary receiver operating characteristic.
Yongchun Shen and Chun Wan contributed equally to this work.
The authors have no conflicts of interest to disclose.
National Natural Science Foundation of China (Grant No. 81230001 and 81300032).
The funders had no role in study design, data collection and analysis, decision to publish, or preparation of the manuscript. We are indebted to the authors of the primary studies included in this meta-analysis; without their contributions, this work would not have been possible.
YCS and CW: conceived the article, systematic review, meta-analysis, drafted, and revised the manuscript. PT, YW, XL, and TY: systematic review, drafted, and revised the manuscript. JA, TW, and LC: systematic review, drafted and revised the manuscript. FQW: guarantor of the paper, taking responsibility for the integrity of the work as a whole, from inception to published article.
Supplemental digital content is available for this article. Direct URL citations appear in the printed text and are provided in the HTML and PDF versions of this article on the journal's Website (www.md-journal.com).
REFERENCES
- 1.Kiely DG, Elliot CA, Sabroe I, Condliffe R. Pulmonary hypertension: diagnosis and management. BMJ 2013; 346:f2028. [DOI] [PubMed] [Google Scholar]
- 2.Mandel J, Poch D. In the clinic. Pulmonary hypertension. Ann Intern Med 2013; 158: ITC5-1-16. [DOI] [PubMed] [Google Scholar]
- 3.Blanco I, Mathai S, Shafiq M, et al. Severity of systemic sclerosis-associated pulmonary arterial hypertension in African Americans. Medicine (Baltimore) 2014; 93:177–185. [DOI] [PMC free article] [PubMed] [Google Scholar]
- 4.Carrington M, Murphy NF, Strange G, et al. Prognostic impact of pulmonary arterial hypertension: a population-based analysis. Int J Cardiol 2008; 124:183–187. [DOI] [PubMed] [Google Scholar]
- 5.D’Alonzo GE, Barst RJ, Ayres SM, et al. Survival in patients with primary pulmonary hypertension results from a national prospective registry. Ann Intern Med 1991; 115:343–349. [DOI] [PubMed] [Google Scholar]
- 6.Ling Y, Johnson MK, Kiely DG, et al. Changing demographics, epidemiology, and survival of incident pulmonary arterial hypertension: results from the pulmonary hypertension registry of the United Kingdom and Ireland. Am J Respir Crit Care Med 2012; 186:790–796. [DOI] [PubMed] [Google Scholar]
- 7.Bossone E, D’Andrea A, D’Alto M, et al. Echocardiography in pulmonary arterial hypertension: from diagnosis to prognosis. J Am Soc Echocardiogr 2013; 26:1–14. 10.1016/j.echo.2012.10.009 [DOI] [PubMed] [Google Scholar]
- 8.Janda S, Shahidi N, Gin K, Swiston J. Diagnostic accuracy of echocardiography for pulmonary hypertension: a systematic review and meta-analysis. Heart 2011; 97:612–622. [DOI] [PubMed] [Google Scholar]
- 9.Wang N, Hu X, Liu C, et al. A systematic review of the diagnostic accuracy of cardiovascular magnetic resonance for pulmonary hypertension. Can J Cardiol 2014; 30:455–463. [DOI] [PubMed] [Google Scholar]
- 10.Hoeper MM, Lee SH, Voswinckel R, et al. Complications of right heart catheterization procedures in patients with pulmonary hypertension in experienced centers. J Am Coll Cardiol 2006; 48:2546–2552. [DOI] [PubMed] [Google Scholar]
- 11.Boerrigter B, Mauritz GJ, Marcus JT, et al. Progressive dilatation of the main pulmonary artery is a characteristic of pulmonary arterial hypertension and is not related to changes in pressure. Chest 2010; 138:1395–1401. [DOI] [PubMed] [Google Scholar]
- 12.Grosse C, Grosse A. CT findings in diseases associated with pulmonary hypertension: a current review. Radiographics 2010; 30:1753–1777. [DOI] [PubMed] [Google Scholar]
- 13.Zisman DA, Karlamangla AS, Ross DJ, et al. High-resolution chest CT findings do not predict the presence of pulmonary hypertension in advanced idiopathic pulmonary fibrosis. Chest 2007; 132:773–779. [DOI] [PMC free article] [PubMed] [Google Scholar]
- 14.Pandey AK, Wilcox P, Mayo JR, et al. Predictors of pulmonary hypertension on high-resolution computed tomography of the chest in systemic sclerosis: a retrospective analysis. Can Assoc Radiol J 2010; 61:291–296. [DOI] [PubMed] [Google Scholar]
- 15.Abel E, Jankowski A, Pison C, et al. Pulmonary artery and right ventricle assessment in pulmonary hypertension: correlation between functional parameters of ECG-gated CT and right-side heart catheterization. Acta Radiol 2012; 53:720–727. [DOI] [PubMed] [Google Scholar]
- 16.Leeflang MM, Deeks JJ, Gatsonis C, et al. Systematic reviews of diagnostic test accuracy. Ann Intern Med 2008; 149:889–897. [DOI] [PMC free article] [PubMed] [Google Scholar]
- 17.Shen Y, Zhu H, Wan C, et al. Can cholesterol be used to distinguish pleural exudates from transudates? Evidence from a bivariate meta-analysis. BMC Pulm Med 2014; 14:61. [DOI] [PMC free article] [PubMed] [Google Scholar]
- 18.Reitsma JB, Glas AS, Rutjes AW, et al. Bivariate analysis of sensitivity and specificity produces informative summary measures in diagnostic reviews. J Clin Epidemiol 2005; 58:982–990. [DOI] [PubMed] [Google Scholar]
- 19.Kuriyama K, Gamsu G, Stern RG, et al. CT-determined pulmonary artery diameters in predicting pulmonary hypertension. Invest Radiol 1984; 19:16–22. [DOI] [PubMed] [Google Scholar]
- 20.Edwards PD, Bull RK, Coulden R. CT measurement of main pulmonary artery diameter. Br J Radiol 1998; 71:1018–1020. [DOI] [PubMed] [Google Scholar]
- 21.Tan RT, Kuzo R, Goodman LR, et al. Utility of CT scan evaluation for predicting pulmonary hypertension in patients with parenchymal lung disease. Medical College of Wisconsin Lung Transplant Group. Chest 1998; 113:1250–1256. [DOI] [PubMed] [Google Scholar]
- 22.Ng CS, Wells AU, Padley SP. A CT sign of chronic pulmonary arterial hypertension: the ratio of main pulmonary artery to aortic diameter. J Thorac Imaging 1999; 14:270–278. [DOI] [PubMed] [Google Scholar]
- 23.Pérez-Enguix D, Morales P, Tomás JM, et al. Computed tomographic screening of pulmonary arterial hypertension in candidates for lung transplantation. Transplant Proc 2007; 39:2405–2408. [DOI] [PubMed] [Google Scholar]
- 24.Alhamad EH, Al-Boukai AA, Al-Kassimi FA, et al. Prediction of pulmonary hypertension in patients with or without interstitial lung disease: reliability of CT findings. Radiology 2011; 260:875–883. [DOI] [PubMed] [Google Scholar]
- 25.Burger IA, Husmann L, Herzog BA, et al. Main pulmonary artery diameter from attenuation correction CT scans in cardiac SPECT accurately predicts pulmonary hypertension. J Nucl Cardiol 2011; 18:634–641. [DOI] [PubMed] [Google Scholar]
- 26.Chan AL, Juarez MM, Shelton DK, et al. Novel computed tomographic chest metrics to detect pulmonary hypertension. BMC Med Imaging 2011; 11:7. [DOI] [PMC free article] [PubMed] [Google Scholar]
- 27.Condliffe R, Radon M, Hurdman J, et al. CT pulmonary angiography combined with echocardiography in suspected systemic sclerosis-associated pulmonary arterial hypertension. Rheumatology (Oxford) 2011; 50:1480–1486. [DOI] [PubMed] [Google Scholar]
- 28.Davarpanah AH, Hodnett PA, Farrelly CT, et al. MDCT bolus tracking data as an adjunct for predicting the diagnosis of pulmonary hypertension and concomitant right-heart failure. Am J Roentgenol 2011; 197:1064–1072. [DOI] [PubMed] [Google Scholar]
- 29.Dornia C, Lange TJ, Behrens G, et al. Multidetector computed tomography for detection and characterization of pulmonary hypertension in consideration of WHO classification. J Comput Assist Tomogr 2012; 36:175–180. [DOI] [PubMed] [Google Scholar]
- 30.Rajaram S, Swift AJ, Capener D, et al. Comparison of the diagnostic utility of cardiac magnetic resonance imaging, computed tomography, and echocardiography in assessment of suspected pulmonary arterial hypertension in patients with connective tissue disease. J Rheumatol 2012; 39:1265–1274. [DOI] [PubMed] [Google Scholar]
- 31.Kam JC, Pi J, Doraiswamy V, et al. CT scanning in the evaluation of pulmonary hypertension. Lung 2013; 191:321–326. [DOI] [PubMed] [Google Scholar]
- 32.Lange TJ, Dornia C, Stiefel J, et al. Increased pulmonary artery diameter on chest computed tomography can predict borderline pulmonary hypertension. Pulm Circ 2013; 3:363–368. [DOI] [PMC free article] [PubMed] [Google Scholar]
- 33.Mahammedi A, Oshmyansky A, Hassoun PM, et al. Pulmonary artery measurements in pulmonary hypertension: the role of computed tomography. J Thorac Imaging 2013; 28:96–103. [DOI] [PubMed] [Google Scholar]
- 34.Corson N, Armato SG, 3rd, Labby ZE, et al. CT-based pulmonary artery measurements for the assessment of pulmonary hypertension. Acad Radiol 2014; 21:523–530. [DOI] [PMC free article] [PubMed] [Google Scholar]
- 35.Iyer AS, Wells JM, Vishin S, et al. CT scan-measured pulmonary artery to aorta ratio and echocardiography for detecting pulmonary hypertension in severe COPD. Chest 2014; 145:824–832. [DOI] [PMC free article] [PubMed] [Google Scholar]
- 36.McCall RK, Ravenel JG, Nietert PJ, et al. Relationship of main pulmonary artery diameter to pulmonary arterial pressure in scleroderma patients with and without interstitial fibrosis. J Comput Assist Tomogr 2014; 38:163–168. [DOI] [PMC free article] [PubMed] [Google Scholar]
- 37.Sertogullarindan B, Bora A, Yavuz A, et al. Utility of computed tomography in assessment of pulmonary hypertension secondary to biomass smoke exposure. Med Sci Monit 2014; 20:368–373. [DOI] [PMC free article] [PubMed] [Google Scholar]
- 38.Siegel Y, Mirpuri T. Pulmonary hypertension detection using dynamic and static measurable parameters on CT angiography. J Comput Assist Tomogr 2014; 38:586–590. [DOI] [PubMed] [Google Scholar]
- 39.Akobeng AK. Understanding diagnostic tests 2: likelihood ratios, pre- and post-test probabilities and their use in clinical practice. Acta Paediatr 2007; 96:487–491. [DOI] [PubMed] [Google Scholar]
- 40.Zhang RF, Zhou L, Ma GF, et al. Diagnostic value of transthoracic Doppler echocardiography in pulmonary hypertension: a meta-analysis. Am J Hypertens 2010; 23:1261–1264. [DOI] [PubMed] [Google Scholar]
- 41.Taleb M, Khuder S, Tinkel J, Khouri SJ. The diagnostic accuracy of Doppler echocardiography in assessment of pulmonary artery systolic pressure: a meta-analysis. Echocardiography 2013; 30:258–265. [DOI] [PubMed] [Google Scholar]
- 42.Bech-Hanssen O, Karason K, Rundqvist B, et al. Can pulmonary hypertension and increased pulmonary vascular resistance be ruled in and ruled out by echocardiography? J Am Soc Echocardiogr 2013; 26:469–478. 10.1016/j.echo.2013.02.011 [DOI] [PubMed] [Google Scholar]
- 43.Rajagopal S, Forsha DE, Risum N, et al. Comprehensive assessment of right ventricular function in patients with pulmonary hypertension with global longitudinal peak systolic strain derived from multiple right ventricular views. J Am Soc Echocardiogr 2014; 27:657–665. 10.1016/j.echo.2014.02.001e653. [DOI] [PubMed] [Google Scholar]
- 44.Kong D, Shu X, Dong L, et al. Right ventricular regional systolic function and dyssynchrony in patients with pulmonary hypertension evaluated by three-dimensional echocardiography. J Am Soc Echocardiogr 2013; 26:649–656. 10.1016/j.echo.2013.03.0074 [DOI] [PubMed] [Google Scholar]
- 45.Devaraj A, Wells AU, Meister MG, et al. Pulmonary hypertension in patients with bronchiectasis: prognostic significance of CT signs. AJR Am J Roentgenol 2011; 196:1300–1304. [DOI] [PubMed] [Google Scholar]
- 46.Żyłkowska J, Kurzyna M, Florczyk M, et al. Pulmonary artery dilatation correlates with the risk of unexpected death in chronic arterial or thromboembolic pulmonary hypertension. Chest 2012; 142:1406–1416. [DOI] [PubMed] [Google Scholar]
- 47.Wells JM, Washko GR, Han MK, et al. Pulmonary arterial enlargement and acute exacerbations of COPD. N Engl J Med 2012; 367:913–921. [DOI] [PMC free article] [PubMed] [Google Scholar]
- 48.Wells JM, Dransfield MT. Pathophysiology and clinical implications of pulmonary arterial enlargement in COPD. Int J Chron Obstruct Pulmon Dis 2013; 8:509–521. [DOI] [PMC free article] [PubMed] [Google Scholar]
- 49.Devaraj A, Wells AU, Meister MG, et al. Detection of pulmonary hypertension with multidetector CT and echocardiography alone and in combination. Radiology 2010; 254:609–616. [DOI] [PubMed] [Google Scholar]
- 50.Devaraj A, Hansell DM. Computed tomography signs of pulmonary hypertension: old and new observations. Clin Radiol 2009; 64:751–760. [DOI] [PubMed] [Google Scholar]


