Abstract
In this study, we assessed the potential of plasma Epstein–Barr virus (EBV) DNA assays to predict clinical outcomes in a large sample of nasopharyngeal carcinoma (NPC) patients and proposed a risk stratification model based on standardized EBV DNA load monitoring.
We conducted a meta-analysis of 14 prospective and retrospective comparative studies (n = 7 836 patients) to evaluate the correlation between pretreatment plasma EBV DNA (pre-DNA), midtreatment plasma EBV DNA (mid-DNA), posttreatment plasma EBV DNA (post-DNA), the half-life value of plasma EBV DNA clearance rate (t1/2), and clinical outcomes. Our primary endpoint was overall survival (OS). Our secondary endpoints were progression-free survival (PFS), distant-metastasis-free survival (DMFS), and local-regional-failure-free survival (LRFS).
High pre-DNA, detectable mid-DNA, detectable post-DNA, and slow EBV DNA clearance rates were all significantly associated with poorer OS, with hazard radios (HRs) equal to 2.81, 3.29, 4.26, and 3.58, respectively. Pre-DNA, mid-DNA, and post-DNA had the same effects on PFS, DMFS, and LRFS.
Plasma EBV DNA assays are highly prognostic of long-term survival and distant metastasis in NPC patients. Based on the results of this meta-analysis, we propose a 4-grade systematic risk stratification model. Given the inherent limitations of the included studies, future well-designed randomized clinical trials are required to confirm to the findings of this analysis and to contribute to the development of individualized treatment strategies for NPC patients.
INTRODUCTION
The incidence of nasopharyngeal carcinoma (NPC) has remained consistently high in endemic regions (ie, Southern China).1 Among men ages 20 to 44 years, NPC is the most prevalent form of cancer, comprising 19% of the overall cancer incidence in Hong Kong.2
According to the National Comprehensive Cancer Network (NCCN) guidelines,3 radiotherapy is fundamental to the treatment of NPC combined with different chemotherapies according to staging (ie, concurrent chemoradiotherapy [CCRT] for locoregionally advanced NPC). With the improved local control resulting from more precise imaging and radiotherapy, distant metastases have become the main cause of the failure of this mode of treatment;4 despite the use of CCRT, patients with locoregionally advanced NPC will still have a poor prognosis.5 Furthermore, until further data emerge, the generalized treatment strategies currently in use cannot be diversified to meet the need for individualized treatment.
Circulating Epstein–Barr virus (EBV) DNA concentrations correlate positively with disease stage as well as exhibiting prognostic importance in NPC.6 Based on the great variety of published studies, EBV DNA concentrations and plasma EBV DNA clearance rates have been identified as emerging biomarkers for monitoring survival,7–11 although the mechanism remains unclear and no risk classification has been effectively demonstrated. Thus, we hypothesized that plasma EBV DNA assays can be applied clinically to the development of a systematic risk stratification model to monitor disease, responses to treatment, and outcomes. Currently, the published data are limited to those obtained in small-scale series studies; therefore, we conducted this meta-analysis in a large-scale population (n = 7 836 patients) to test our hypothesis with the aim of standardizing EBV DNA load monitoring based on a proposed 4-grade systematic risk stratification model. Such a model could be used to design more biomarker-integrated clinical trials to optimize individualized treatment strategies.
MATERIALS AND METHODS
This meta-analysis was performed in accordance with preferred reporting items for systematic review and meta-analysis protocols (PRISMA-P) 2015 statement.12
Literature Search and Selection of Studies
Initially, we identified all studies focusing on plasma EBV DNA in NPC patients, regardless of publication language. Sources included PubMed, Web of Science and the Cochrane library (last search update January 2015). The search strategy was based on combinations of “nasopharyngeal carcinoma/cancer/neoplasm” and “EBV DNA/Epstein-Barr virus DNA/Epstein-Barr viral DNA/EBV deoxyribonucleic acid/Epstein-Barr virus deoxyribonucleic acid/Epstein-Barr viral deoxyribonucleic acid” in [Title/Abstract]. References of retrieved articles were also screened to broaden the search. Lin et al.13 used detectable EBV nuclear antigen 1 (EBNA-1) as the marker of positive EBV DNA; this study was also included in our meta-analysis. All analyses were based on previous published studies,thus no ethical approval or patient consent were required.
Inclusion Criteria and Exclusion Criteria
We included all available prospective and retrospective comparative studies (cohort or case-control studies) that compared different clinical outcomes of treatment with high pre-treatment plasma EBV DNA (pre-DNA)/ mid-treatment plasma EBV DNA (mid-DNA)/ post-treatment plasma EBV-DNA (post-DNA) versus low pre-DNA/ mid-DNA/ post-DNA or different EBV DNA clearance rates regardless of stage or the population under investigation.
Studies for which it was impossible to extract at least one of the quantitative outcomes mentioned in the next section of this report were excluded. Responding letters, comments, review articles, case reports and experimental animal studies were also excluded. In cases of multiple reports describing the same population, the most recent or most complete report was selected. To ensure better comparison of the outcomes, studies with a median follow-up time of less than 24 months14,15 or for which basic information was not available16 were also excluded (Supplementary Fig. S1).
Data Extraction and Outcomes
Two investigators (WNZ and YPC) extracted the data from eligible studies independently and reached a consensus for all items. Data on characteristics of studies and patients, measurements, and results were extracted. We also recorded the first author, year of publication, country of origin, number of patients analyzed, median follow-up time, tumor-node-metastasis (TNM) staging, pre-DNA and post-DNA cut-off values, and the inclusion period for each study.
Cut-off values for pre-DNA varied among studies; 4 000 copies/ml and 1 500 copies/ml were the most commonly used values. No attempt at repeated analysis with alternative cut-offs was made. Wang et al.11 detected an association between different pre-DNA values and 2-year overall survival (OS) based on the same sample, which found only 50 000 copies/ml was positive [HR 0.26, 95% Confidence Interval (CI) 0.02–0.51, P = 0.0055]. However, there were only 34 patients in total in this study; therefore, the result is debatable. The post-DNA cut-off value was defined as 0 copies/ml in five of the included studies.8,10,17–19 To investigate the effects of different cut-off values, we also conducted subgroup analysis of long-term survival.
Our primary endpoint was OS, which was defined as the time from diagnosis to death or the last reported date. Our secondary endpoints were progression-free survival (PFS), distant-metastasis-free survival (DMFS) and local-regional-failure-free survival (LRFS), which were defined as the time from diagnosis to the date of progression,distant metastasis or local regional recurrence respectively. We also defined disease-free survival (DFS) as the time from diagnosis to the date of any event or when censored at the last report date. If there was no PFS but DFS was mentioned in individual studies, the DFS was included in LRFS.
Quality Assessment and Statistical Analysis
Studies were provided a level of evidence based on the criteria of the Centre for Evidence-based Medicine in Oxford, UK.20 The quality of all the nonrandomized studies was assessed by the modified Newcastle-Ottawa scale,21 including patient selection, comparability of the study groups, and assessment of outcomes. Scores ranked from 0–9 (allocated as stars) and studies achieving six stars or more were considered of high quality.
The meta-analysis was performed using Review Manager 5.3.5 (Cochrane Collaboration, Oxford, UK) and STATA 12.0 (Stata Corp, College Station, TX) for testing publication bias. Results regarding the survival endpoints were expressed as hazard radios (HRs), which is the only summary statistic allowing for both censoring and time to an event. HR and its 95% confidence intervals were used directly if available in the individual study, or extraction of summary statistics was performed according to the methods detailed by Parmar et al.22 The observed minus the expected number of deaths (O-E) and its variance and 2-year events if not available were then calculated for each trial using the same method. P-values < 0.05 were defined as statistically significant.
The fixed effect model (Mantel–Haenszel), which assumes that differences between the results of various studies are due to chance, was used in our meta-analysis. Heterogeneity across studies was evaluated by the Chi2 (χ2) test and the I2 statistic in combination with a forest plot. Statistically significant heterogeneity was defined as a χ2P-value < 0.1. Subgroup analysis was performed in instances of heterogeneity across studies. Subgroup analysis were also performed to compare the differences based on population, inclusion stage and cut-off values. Sensitivity analysis was performed to examine the effect of variations in study quality. Potential publication bias was examined using Egger's test. P-values < 0.05 were defined as statistically significant.
RESULTS
Eligible Studies
A total of 359 references were retrieved using the initial search algorithm, of which 14 studies were finally included (n = 7 836 patients). Characteristics of the 14 eligible studies are listed in Table 1; no randomized controlled trial (RCT) was available for our research. There was variation among the studies in terms of the level of evidence, study design and quality score. The included studies comprised eight prospective studies7,8,11,13,18,19,23,24 and six retrospective studies.9,10,17,25–27 With the exception of two studies,11,23 all were conducted in newly diagnosed non-metastatic NPC patients. The numbers of 2-year events in each study concerning different clinical outcomes are also shown in each figure below.
TABLE 1.
Characteristics of the Eligible Studies
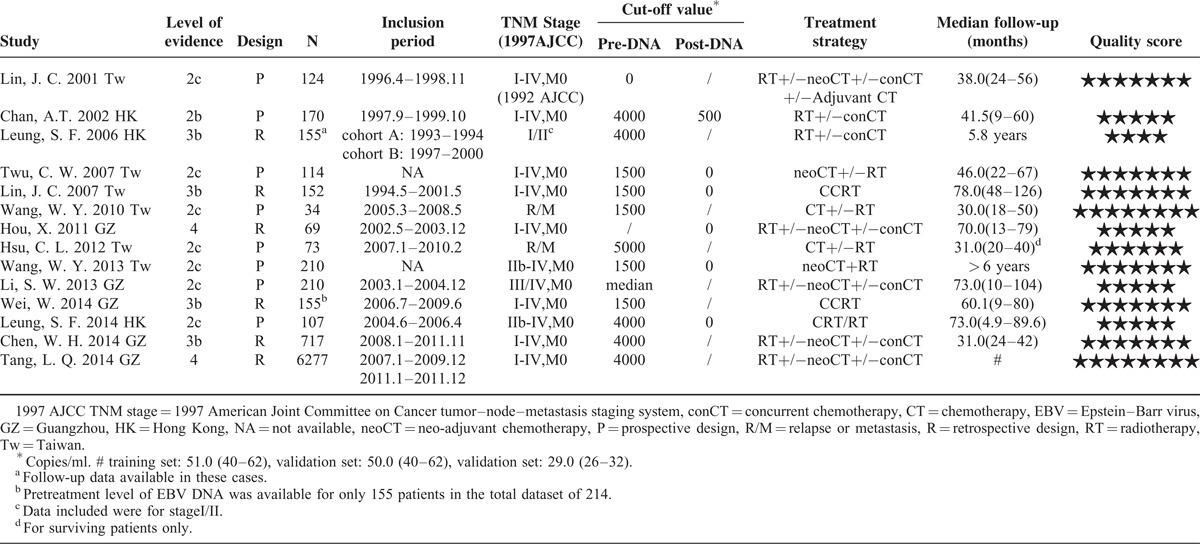
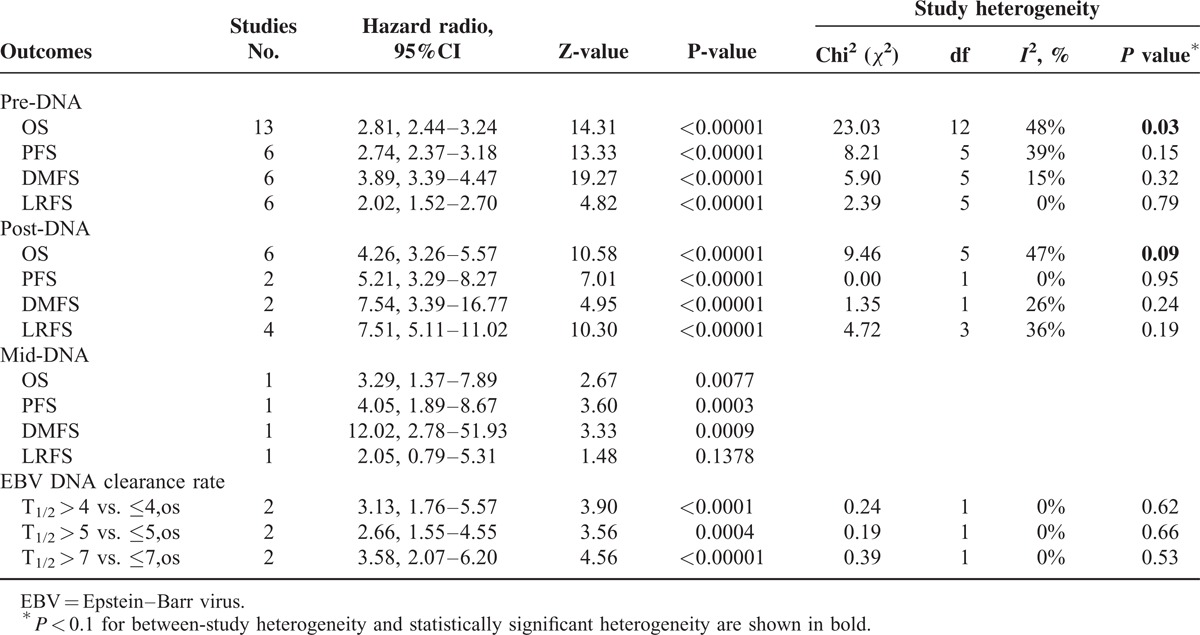
Regarding the relationship between EBV DNA and clinical outcomes, 13 studies reported pre-DNA7–11,13,18,19,23–27 and six reported post-DNA.7,8,10,17–19 Two studies (n = 104 patients) provided OS data for the EBV DNA clearance rate,11,23 in which the half-life time of EBV DNA clearance rates (t1/2) were comparable for three cut-off values (t1/2 = 4 days, 5 days and 7 days). In comparisons of the clinical outcomes based on pre-DNA, the data for OS, PFS, DMFS, and LRFS were available for 13 studies (n = 8 443 patients), six studies (n = 7 526 patients), six studies (n = 7 600 patients) and six studies (n = 917 patients), respectively. Studies of post-DNA and clinical outcomes were relatively few; OS, PFS, DMFS, and LRFS data were available in only six studies (n = 822 patients), two studies (n = 277 patients), two studies (n = 176 patients) and four studies (n = 583 patients), respectively. Only one study8 reported the clinical application of mid-DNA; therefore, this parameter was not analyzed. A summary of the meta-analysis results are shown in Table 2.
TABLE 2.
Summary of Meta-Analysis Results
Data synthesis
Pre-DNA and Clinical Outcomes
High levels of pre-DNA were associated with a poorer prognosis in terms of the risk of death, recurrence and metastasis (Figure 1). Analysis of pooled data from 13 studies showed that mortality was almost 3-fold higher in high pre-DNA patients (OS, HR 2.81, 95% CI 2.44–3.24, P < 0.00001). There was significant between-study heterogeneity (I2 48%, P = 0.03), which we subsequently evaluated in subgroup analyses. Similar results were obtained when studies with a median follow-up period of less than 3 years23,25 were excluded from the analysis (OS, HR 2.80; I2 39%, P = 0.10). The risks for progression and local-regional failure according to pre-DNA levels were 2.74 and 2.02, respectively. However, the risk of distant metastasis was almost 4-fold higher in high pre-DNA patients (DMFS, HR 3.89, 95% CI 3.39–4.47, P < 0.00001).
FIGURE 1.
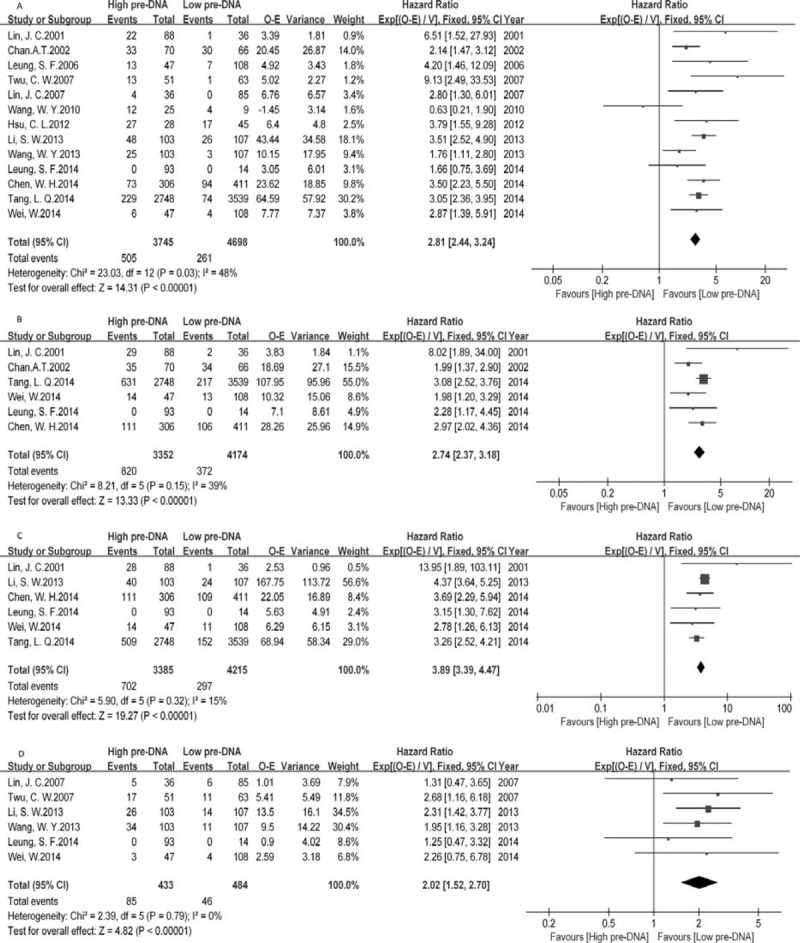
Meta-analysis of pre-DNA associated clinical outcomes, for (A) overall survival (OS), (B) progression-free survival (PFS), (C) distant-metastasis-free survival (DMFS), (D) local-regional-failure-free survival (LRFS). Note: Events for Leung, 2014 were unavailable.
Mid-DNA, Post-DNA and Clinical Outcomes
Detectable post-DNA showed an even stronger association with a poorer prognosis than the risk associated with high pre-DNA, especially for DMFS (HR 7.54, 95% CI 3.39–16.77, P < 0.00001) and LRFS (HR 7.51, 95% CI 5.11–11.02, P < 0.00001) (Supplementary Fig. S2). The risk of mortality was 4.26-fold higher in detectable post-DNA patients (OS, HR 4.26, 95% CI 3.26–5.57, P < 0.00001). Again, between-study heterogeneity was detected (I2 47%, P = 0.09), the source of which was subsequently evaluated in subgroup analyses. Similarly, the HR was 5.21 (PFS, 95% CI 3.29–8.27, P < 0.00001) for progression in detectable post-DNA NPC patients compared with undetectable post-DNA NPC patients.
Although the studies reporting mid-DNA concentrations were limited, we have shown the results of a single study in Table 2 because of the remarkable HR value for DMFS (HR 12.02, 95% CI 2.78–51.93, P < 0.00001).
EBV DNA Clearance Rate and Clinical Outcomes
Plasma EBV DNA clearance rates within the first month of treatment were sufficiently predictive of the clinical outcome to allow timely changes in the treatment regimen. Patients with a short t1/2 had significantly higher OS than those with a long t1/2 (Supplementary Fig. S3). Taking the t1/2 value as 7 days, the HR of t1/2 > 7 vs. ≤7 was 3.58 (95% CI 2.07–6.20, P < 0.00001).
Subgroup Analysis
Pre-DNA Associated OS, Subdivided by Population, Cutoff Value and Inclusion Stage
There were no significant differences in the results of this subgroup analysis compared with those of the original analysis, except in terms of the stage of patients included in each study (inclusion stage) (Figure 2). Pre-DNA was not predictable in relapse or metastasis patients before treatment [2 studies (n = 54 patients), HR 1.87, 95% CI 0.93–3.74, P = 0.08].
FIGURE 2.
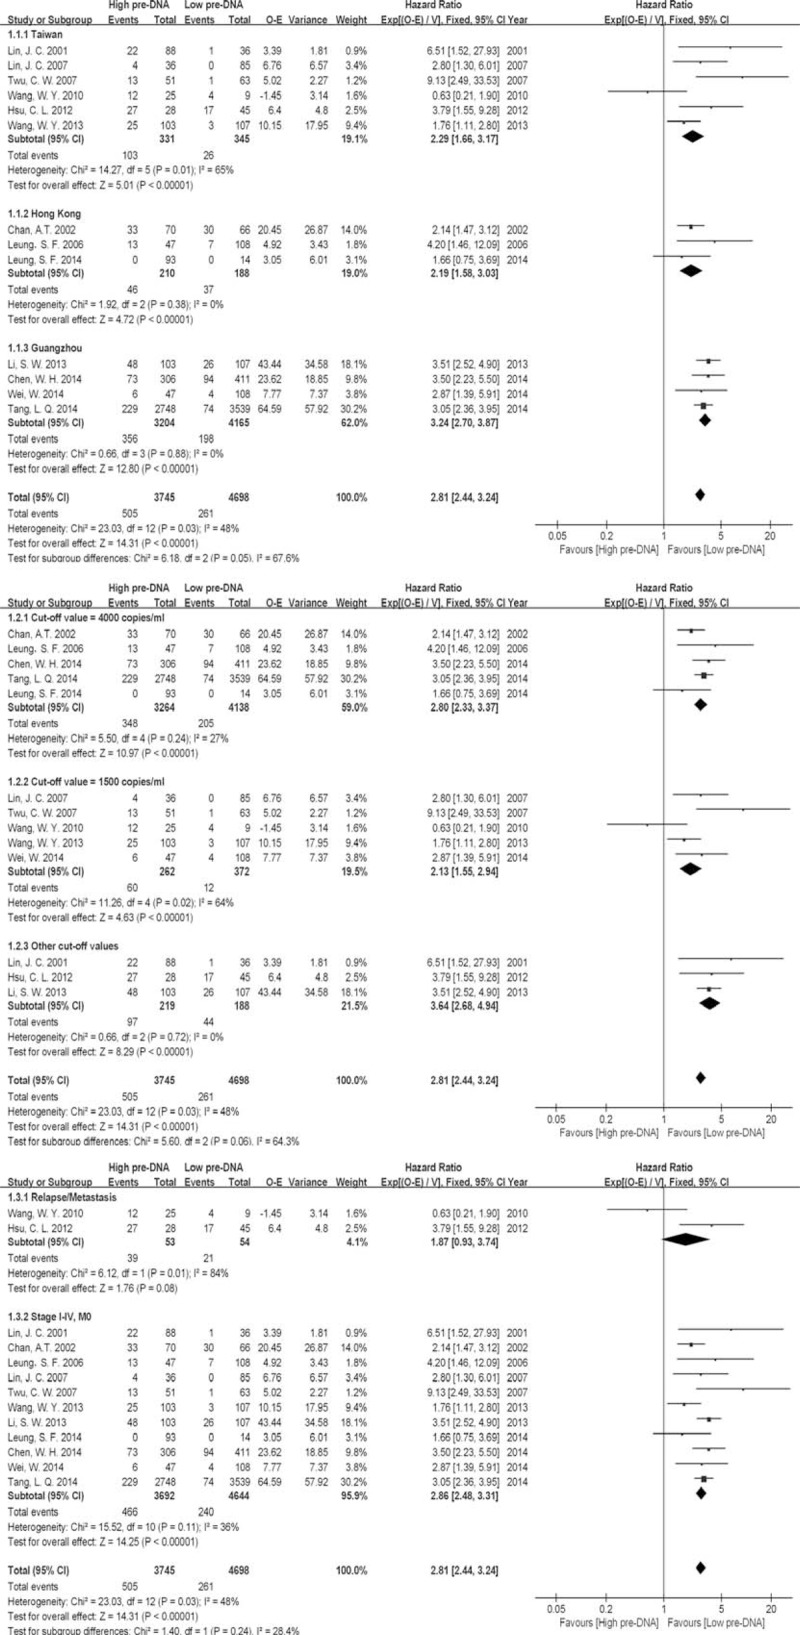
Subgroup analysis of pre-DNA associated overall survival (OS), subdivided by population, cut-off value and inclusion stage. Note: Events for Leung, 2014 were unavailable.
Post-DNA Associated OS, Subdivided by Population and Cutoff Value
There were no significant differences in the results of this subgroup analysis compared with those of the original analysis (Supplementary Fig. S4). However, regarding the subgroup analysis based on post-DNA cut-off value, five studies8,10,17–19 including 549 patients indicated that 0 copies/ml was a better prognosticator than 500 copies/ml (HR 5.81 compared with 2.82, P = 0.009).
Sensitivity Analysis and Publication Bias
Nine studies achieving six or more stars on the modified Newcastle-Ottawa scale (Supplementary Table S1) were included in sensitivity analysis (Table 3). There was no change in the significance of any of the outcomes except for the inability to perform post-DNA meta-analysis of PFS and DMFS for a few studies. The degree of between-study heterogeneity decreased slightly for OS data of post-DNA, but not for OS data of pre-DNA.
TABLE 3.
Summary of Sensitivity Analysis Results Excluding Studies Achieving <6 stars on the Modified Newcastle-Ottawa Scale
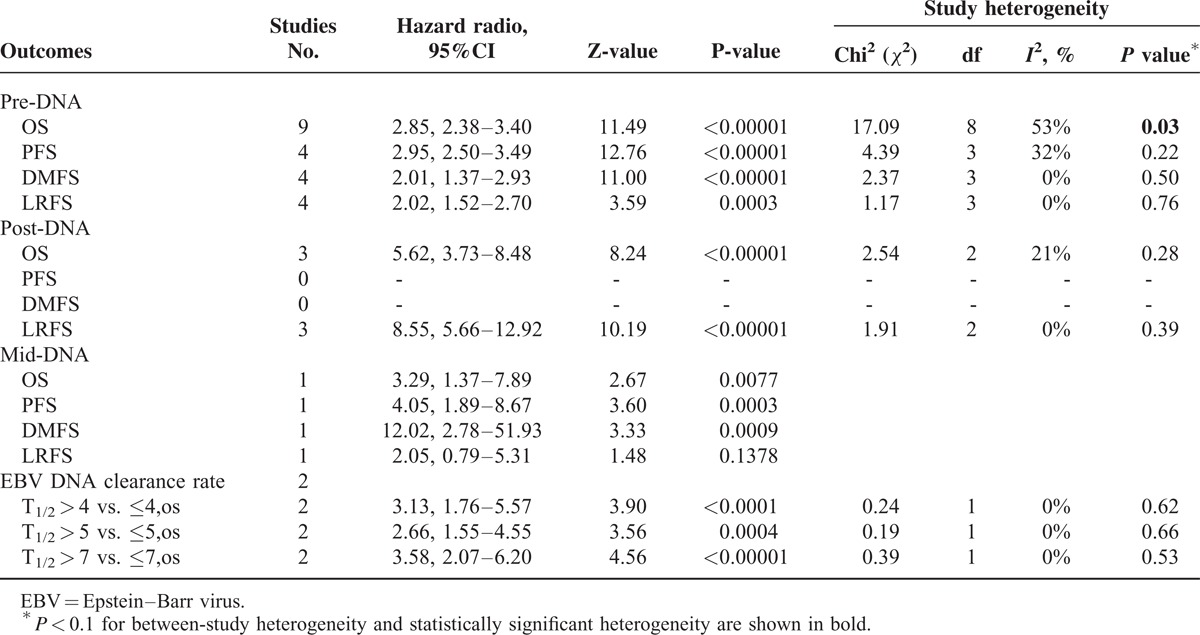
As shown in our data synthesis report, there was significant between-study heterogeneity in the OS analysis of both pre-DNA and post-DNA. According to the results of subgroup analysis, population variation was associated with pre-DNA predicted OS (P = 0.05) and different cut-off values were the key factors for post-DNA (P = 0.009). An Egger's publication bias plot of 13 studies7–11,13,18,19,23–27 that reported pre-DNA associated OS included in this meta-analysis was constructed (Figure 3), which indicated no obvious publication bias (P = 0.879).
FIGURE 3.
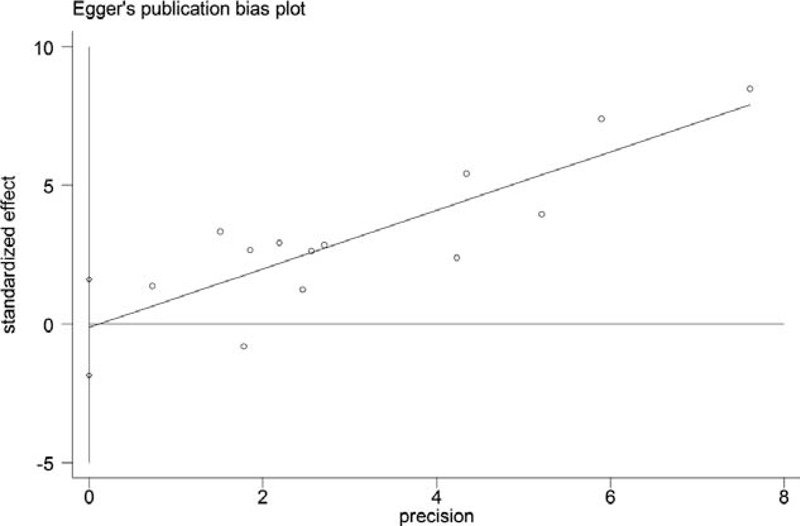
Egger's publication bias plot of 13 studies that reported the pre-DNA associated OS.
DISCUSSION
This meta-analysis of eight prospective studies and six retrospective studies including 7 836 patients showed that pre-DNA, mid-DNA, post-DNA and EBV DNA clearance rate were all strongly associated with cancer-specific outcomes (OS, PFS, DMFS and LRFS) in NPC patients. However, no RCTs were available for inclusion in this analysis. Because of the number and quality of studies included, our results should be interpreted with caution and further clinical trials are required to validate our conclusions. Nevertheless, we propose a 4-grade systematic risk stratification model for NPC to allow adjustment of clinical treatment based on the current NCCN guidelines for Head and Neck cancers,3 which represents a new attempt at the application of biomarkers.
NPC is highly radiosensitive and CCRT with or without adjuvant chemotherapy (AC) has been the mainstay treatment for patients with loco-regionally advanced stages II–IVB disease.4 However, this type of AC (cisplatin + 5-flurouracil) is controversial due to its poor compliance and relatively low failure-free survival.28 A recent meta-analysis29 including relevant RCTs also showed no significant improvement in survival following CCRT + AC compared with CCRT alone. In our opinion, CCRT alone was recommended as the main treatment strategy for loco-regionally advanced NPC patients in the following prognostic groupings, which would have important implications for the selection of appropriate treatment strategies in this model. Given the limited published data of combined treatment strategies that included with EBV DNA, the selection of changes in the treatment decision was a primary suggestion.
Leung et al.9 found that pre-DNA was an independent prognostic factor secondary to 1997 AJCC/UICC staging in NPC. Their results indicated that the 5-year survival rates for the low and high pre-DNA groups in patients with stage II disease were 90% and 63%, respectively, with the former being similar to the survival in stage I disease (92%, 95% CI 83–100%) and the latter worse than that in stage III disease (73%, 95%CI 64–82%). Leung et al.9 did not found significant differences in survival between the high and low pre-DNA groups of patients with stage III and IV disease, respectively; however, they proposed that the majority of low-risk stage II patients should be treated with radiotherapy alone to avoid non-contributive therapy. In our meta-analysis of 13 related studies, similar results were obtained. In subgroup analysis, we found that pre-DNA was not predictive of OS in relapse or metastasis patients before treatment (HR 1.87, 95% CI 0.93–3.74, P = 0.08). The pre-DNA result was applicable only in 1997 AJCC/UICC stage I–IV disease patients without metastasis and a pre-DNA cut-off value of 4 000 copies/ml was recommended (HR 2.80, 95% CI 2.33–3.37, P < 0.00001). A recent study30 has successfully realized the international harmonization and standardization of detectable EBV DNA through the use of common calibrators (all prepared in Hong Kong) and Polymerase Chain Reaction (PCR) master mix (Roche master mix). Reliable and comparable cut-off values across centers were available; thus, the following primary risk stratification was proposed:
Stage I–II patients with pre-DNA < 4 000 copies/ml can be regarded as modified stage I disease.
Stage I patients with pre-DNA ≥ 4 000 copies/ml can be regarded as modified stage II disease.
Stage II patients with pre-DNA ≥ 4 000 copies/ml can be regarded as modified stage III disease.
Based on the primary risk stratification, patients with high pre-DNA levels could be treated with aggressive strategies, such as neo-adjuvant chemotherapy + CCRT with or without AC, while the low group could be spared non-contributive therapy and be treated with radical radiotherapy alone.
Studies of mid-DNA on survival were limited. To date, only one study from Hong Kong8 with a median follow-up time of 73 months indicated that detectable mid-DNA (measured at completion of 4 weeks of CCRT/radiotherapy) encompassed approximately three-quarters of all failures, while the rest were associated with detectable post-DNA. They also found that patients with detectable mid-DNA and then undetectable post-DNA still had a poorer prognosis than those with undetectable mid-DNA. Their data showed no significant difference in outcomes based on tumor stage stratification. Mid-DNA was found to be a strong prognosticator of distant metastasis (DMFS, HR 12.02, 95% CI 2.78–51.93, P = 0.0009), which might be important in current treatment status monitoring procedures. Thus, the secondary risk stratification was proposed as a suggestion based on the study described above:
Stage I–II patients with undetectable mid-DNA might be regarded as having modified stage I disease.
Stage III–IV patients with undetectable mid-DNA might be regarded as having modified stage II disease.
Stage I patients with detectable mid-DNA might be regarded as having modified stage II disease.
Stage II–IV patients with detectable mid-DNA might be regarded as being at high risk of relapse or distant metastasis.
Based on the secondary risk stratification, patients with a high risk stratification could be treated with aggressive strategies, such as CCRT + AC with targeted therapy also recommended if necessary. Patients with a low risk stratification could be treated with moderate strategies, such as radical radiotherapy or CCRT alone.
Large reductions in plasma EBV DNA levels were observed with a 49% detectable rate of mid-DNA and a 16% detectable rate of post-DNA.8 Post-radiotherapy biopsies carried out by some investigators31 revealed that patients with detectable post-DNA had either incomplete regression of the tumor or had developed distant metastasis. In total, we included six studies7,8,10,17–19 of the clinical utility of post-DNA. The prognostic value of post-DNA was first observed in a study involving 170 patients conducted by Chan et al.7 in 2002. The study also indicated that post-DNA less than 500 copies/ml indicated an excellent prognosis (2-year survival > 80%) and that such patients might be spared adjuvant therapy. Lin et al.10 suggested that more chemotherapy should be offered to patients with persistently detectable post-DNA after CCRT, which is consistent with the results of our meta-analysis. Through subgroup analysis based on cut-off values, we found a statistically significant difference (0 copies/ml cut-off, HR 5.81 vs. 500 copies/ml, HR 2.82; P = 0.009). Based on these results, we proposed the following tertiary risk stratification:
Patients with post-DNA = 0 copies/ml might be spared adjuvant therapy;
Patients with post-DNA > 0 copies/ml could undertake AC or other treatments if necessary.
Some investigators11,23,32,33 collected three to five blood samples during the treatment and calculated the EBV clearance rate. In an investigation of the kinetics of plasma EBV DNA, Lo et al.32 found an initial rise in the first week of radiotherapy, which might be accounted for treatment-induced cancer cell death rather than due to a change in the clearance rate. A median t1/2 of 3.8 days (interquartile range, 2.4–4.4 days) was also determined in this study. To et al.33 observed that the median t1/2 after surgical resection of NPC was 139 minutes, which demonstrated that the plasma EBV DNA concentration correlates with tumor burden. In addition to the biological features, the prognostic implications of EBV DNA clearance rate were further investigated. Wang et al.11 found that the EBV DNA clearance rate was better than pre-DNA (before salvage treatment) in predicting OS. Both Wang et al.11 and Hsu et al.23 found that a pre-DNA of 5 000 copies/ml combined with a plasma EBV DNA clearance rate of less than 7 days had better OS than other groups. We performed the meta-analysis of the two studies based on different half-life values and recommended a t1/2 of 7 days (OS, HR 3.58, 95% CI 2.07–6.20, P < 0.00001) to evaluate tumor response and OS. However, there were two limitations. Firstly, this parameter could only be applied to patients with relapse or metastasis before salvage treatment. Secondly, the pooled sample was still too small for the results to be convincing. Nevertheless, the EBV DNA clearance rate was more objective and sensitive than the current conditions for effect evaluation, which depends mainly on the morphology observed in radiological imaging after full-term chemotherapy. Early changes in the chemotherapy regimen may be considered timely. We then proposed the quaternary risk stratification of patients with recurrent disease or metastasis with assessable pre-DNA (before salvage treatment) and calculated the t1/2 (during salvage treatment) as follows:
Patients with pre-DNA < 5 000 copies/ml and t1/2 ≤7 days should continue with the current treatment strategies;
Patients not in the former group should be changed to other treatment strategies, such as altered chemotherapy or targeted therapy.
A point worth emphasizing is that the former three grades of our 4-grade systematic risk stratification model for individualized therapy are applicable only to patients without relapse or metastasis at diagnosis. The four grades should also be applied sequentially. However, this model should not be used outside the context of well-designed clinical trials. Although the first biomarker-integrated multicenter RCT (Clinical Trials.gov Identifier: NCT02135042) began in 2014, further validation clinical trials are required.
The present meta-analysis has some limitations that must be taken into account in the interpretation of our results. The main limitation is that all the included studies were nonrandomized clinical trials with relatively small sample sizes; the study by Wang et al.11 was performed in only 34 patients. Moreover, publication and reporting bias could not be avoided because our analysis was based on data extracted from published reports rather than individual patient data, without which we were unable to include all the endpoint data and basic information for each study. For example, PFS data were not available in the study by Twu et al.18 Thus, access to individual patient data as well as unreported data would allow a more balanced evaluation of the endpoints included in this meta-analysis. The original meta-analysis was based on the assumption that differences between the results of various studies were due to chance. However, as shown in our description of the results, there was significant between-study heterogeneity in the OS analysis of both pre-DNA and post-DNA. In addition, there was variation in the quality of the included studies and subgroup analysis yielded some difference in the results. For instance, variation in the population was associated with pre-DNA prediction of OS and different cut-off values were the key factor for post-DNA. To balance the risk of bias, the data were extracted by two independent investigators. We also classified the level of evidence and scored the quality of the studies. Future systematic analysis should include the data obtained in the RCTs currently underway.
Nevertheless, meta-analysis of the application of EBV DNA as a biomarker was conducted at an appropriate time, when sufficient data was available to for evaluation by this method. We applied multiple strategies to minimize the heterogeneity, including study identification, strict inclusion criteria, and methodological quality evaluation of the eligible studies, subgroup analysis, sensitivity analysis and Egger's test to control for potential bias. Hence, the results of our analysis represent the most current systematic information available and furthermore, we have proposed a completely new risk stratification model that can be used to design RCTs in this area.
In conclusion, this meta-analysis indicates that pre-DNA, mid-DNA, post-DNA and EBV DNA clearance rate are all prognostic factors for different clinical outcomes in NPC patients and that different assays of this biomarker are applicable in clinical practice. Based on these data, we propose a new 4-grade systematic risk stratification model, which is also complementary to the current 1997 AJCC/UICC staging system. Given the inherent limitations of the included studies, future well-designed RCTs and validation trials are awaited to confirm and update the findings of this analysis and further the development of individualized strategies for the treatment of NPC.
ACKNOWLEDGEMENTS
We received writing assistance from native English speakers. We thank the anonymous reviewers for their insightful comments and great efforts to improve this manuscript. This manuscript has not been published in whole or in part, nor is it being considered for publication elsewhere. We also declare no potential conflicts of interest.
Footnotes
Abbreviations: AC = adjuvant chemotherapy, CCRT = concurrent chemoradiotherapy, CI = confidence interval, DFS = disease-free survival, DMFS = distant-metastasis-free survival, EBNA-1 = EBV nuclear antigen 1, EBV = Epstein–Barr virus, HR = hazard radio, LRFS = local-regional-failure-free survival, mid-DNA = midtreatment plasma EBV DNA, NCCN = National Comprehensive Cancer Network, NPC = nasopharyngeal carcinoma, O-E = observed minus expected number of deaths, OS = overall survival, PCR = Polymerase chain reaction, PFS = progression-free survival, post-DNA = post-treatment plasma EBV-DNA, pre-DNA = pre-treatment plasma EBV DNA, PRISMA-P = preferred reporting items for systematic review and meta-analysis protocols, RCT = randomized clinical trials, t1/2 = the half-life value of plasma EBV DNA clearance rate, TNM staging = tumor-node-metastasis staging.
WZ, YC, and LC contributed equally to this study.
This work was supported by grants from the Key Laboratory Construction Project of Guangzhou City, China (No. 121800085), the Health & Medical Collaborative Innovation Project of Guangzhou City, China (201400000001), and the National Science & Technology Pillar Program during the Twelfth Five-year Plan Period (2014BAI09B10).
The authors have no conflicts of interest to disclose.
REFERENCES
- 1.Wei WI, Sham JST. Nasopharyngeal carcinoma. Lancet 2005; 365:2041–2054. [DOI] [PubMed] [Google Scholar]
- 2.Le QT, Jones CD, Yau TK, et al. A comparison study of different PCR assays in measuring circulating plasma epstein-barr virus DNA levels in patients with nasopharyngeal carcinoma. Clin Cancer Res 2005; 11:5700–5707. [DOI] [PubMed] [Google Scholar]
- 3.Pfister DG, Ang KK, Brizel DM, et al. Head and neck cancers, version 2. 2013. Featured updates to the NCCN guidelines. JNCCN 2013; 11:917–923. [DOI] [PubMed] [Google Scholar]
- 4.Chan AT. Nasopharyngeal carcinoma. Ann Oncol 2010; 21 (suppl 7):vii.308–312.. [DOI] [PubMed] [Google Scholar]
- 5.Cheng SH, Yen KL, Jian JJ, et al. Examining prognostic factors and patterns of failure in nasopharyngeal carcinoma following concomitant radiotherapy and chemotherapy: impact on future clinical trials. Int J Radiation Oncol Biol Phys 2001; 50:717–726. [DOI] [PubMed] [Google Scholar]
- 6.Lo YM. Quantitative analysis of Epstein-Barr virus DNA in plasma and serum: applications to tumor detection and monitoring. Ann New York Acad Sci 2001; 945:68–72. [DOI] [PubMed] [Google Scholar]
- 7.Chan AT, Lo YM, Zee B, et al. Plasma Epstein-Barr virus DNA and residual disease after radiotherapy for undifferentiated nasopharyngeal carcinoma. J Natl Cancer Inst 2002; 94:1614–1619. [DOI] [PubMed] [Google Scholar]
- 8.Leung SF, Chan KC, Ma BB, et al. Plasma Epstein-Barr viral DNA load at midpoint of radiotherapy course predicts outcome in advanced-stage nasopharyngeal carcinoma. Ann Oncol 2014; 25:1204–1208. [DOI] [PubMed] [Google Scholar]
- 9.Leung SF, Zee B, Ma BB, et al. Plasma Epstein-Barr viral deoxyribonucleic acid quantitation complements tumor-node-metastasis staging prognostication in nasopharyngeal carcinoma. J Clin Oncol 2006; 24:5414–5418. [DOI] [PubMed] [Google Scholar]
- 10.Lin JC, Wang WY, Liang WM, et al. Long-term prognostic effects of plasma epstein-barr virus DNA by minor groove binder-probe real-time quantitative PCR on nasopharyngeal carcinoma patients receiving concurrent chemoradiotherapy. Int J Radiat Oncol Biol Phys 2007; 68:1342–1348. [DOI] [PubMed] [Google Scholar]
- 11.Wang WY, Twu CW, Chen HH, et al. Plasma EBV DNA clearance rate as a novel prognostic marker for metastatic/recurrent nasopharyngeal carcinoma. Clin Cancer Res 2010; 16:1016–1024. [DOI] [PubMed] [Google Scholar]
- 12.Chan KCA, Lo YMD. Circulating EBV DNA as a tumor marker for nasopharyngeal carcinoma. Semin Cancer Biol 2002; 12:489–496. [DOI] [PubMed] [Google Scholar]
- 13.Lin JC, Chen KY, Wang WY, et al. Detection of Epstein-Barr virus DNA in the peripheral-blood cells of patients with nasopharyngeal carcinoma: relationship to distant metastasis and survival. J Clin Oncol 2001; 19:2607–2615. [DOI] [PubMed] [Google Scholar]
- 14.An X, Wang FH, Ding PR, et al. Plasma Epstein-Barr virus DNA level strongly predicts survival in metastatic/recurrent nasopharyngeal carcinoma treated with palliative chemotherapy. Cancer 2011; 117:3750–3757. [DOI] [PubMed] [Google Scholar]
- 15.Chan SC, Hsu CL, Yen TC, et al. The role of 18F-FDG PET/CT metabolic tumour volume in predicting survival in patients with metastatic nasopharyngeal carcinoma. Oral Oncol 2013; 49:71–78. [DOI] [PubMed] [Google Scholar]
- 16.Chai SJ, Pua KC, Saleh A, et al. Clinical significance of plasma Epstein-Barr Virus DNA loads in a large cohort of Malaysian patients with nasopharyngeal carcinoma. J Clin Virol 2012; 55:34–39. [DOI] [PubMed] [Google Scholar]
- 17.Hou X, Zhao C, Guo Y, et al. Different clinical significance of pre- and post-treatment plasma Epstein-Barr virus DNA load in nasopharyngeal carcinoma treated with radiotherapy. Clin Oncol 2011; 23:128–133. [DOI] [PubMed] [Google Scholar]
- 18.Twu CW, Wang WY, Liang WM, et al. Comparison of the prognostic impact of serum anti-EBV antibody and plasma EBV DNA assays in nasopharyngeal carcinoma. Int J Radiat Oncol Biol Phys 2007; 67:130–137. [DOI] [PubMed] [Google Scholar]
- 19.Wang WY, Twu CW, Chen HH, et al. Long-term survival analysis of nasopharyngeal carcinoma by plasma Epstein-Barr virus DNA levels. Cancer 2013; 119:963–970. [DOI] [PubMed] [Google Scholar]
- 20.Wang WY, Twu CW, Lin WY, et al. Plasma Epstein-Barr virus DNA screening followed by (1)(8)F-fluoro-2-deoxy-D-glucose positron emission tomography in detecting posttreatment failures of nasopharyngeal carcinoma. Cancer 2011; 117:4452–4459. [DOI] [PubMed] [Google Scholar]
- 21.Mutirangura A, Pornthanakasem W, Theamboonlers A, et al. Epstein-Barr viral DNA in serum of patients with nasopharyngeal carcinoma. Clin Cancer Res 1998; 4:665–669. [PubMed] [Google Scholar]
- 22.Parmar MK, Torri V, Stewart L. Extracting summary statistics to perform meta-analyses of the published literature for survival endpoints. Stat Med 1998; 17:2815–2834. [DOI] [PubMed] [Google Scholar]
- 23.Hsu CL, Chang KP, Lin CY, et al. Plasma Epstein-Barr virus DNA concentration and clearance rate as novel prognostic factors for metastatic nasopharyngeal carcinoma. Head Neck 2012; 34:1064–1070. [DOI] [PubMed] [Google Scholar]
- 24.Li SW, Wang H, Xiang YQ, et al. Prospective study of prognostic value of Raf kinase inhibitory protein and pretreatment plasma Epstein-Barr virus DNA for distant metastasis in locoregionally advanced nasopharyngeal carcinoma. Head Neck 2013; 35:579–591. [DOI] [PubMed] [Google Scholar]
- 25.Chen WH, Tang LQ, Wang FW, et al. Elevated levels of plasma D-dimer predict a worse outcome in patients with nasopharyngeal carcinoma. BMC Cancer 2014; 14:583. [DOI] [PMC free article] [PubMed] [Google Scholar]
- 26.Tang LQ, Li CF, Chen QY, et al. High-sensitivity C-reactive protein complements plasma Epstein-Barr virus deoxyribonucleic acid prognostication in nasopharyngeal carcinoma: a large-scale retrospective and prospective cohort Study. Int J Radiat Oncol Biol Phys 2014. [DOI] [PubMed] [Google Scholar]
- 27.Wei W, Huang Z, Li S, et al. Pretreatment Epstein-Barr virus DNA load and cumulative cisplatin dose intensity affect long-term outcome of nasopharyngeal carcinoma treated with concurrent chemotherapy: experience of an institute in an endemic area. Oncol Res Treat 2014; 37:88–95. [DOI] [PubMed] [Google Scholar]
- 28.Chen L, Hu C-S, Chen X-Z, et al. Concurrent chemoradiotherapy plus adjuvant chemotherapy versus concurrent chemoradiotherapy alone in patients with locoregionally advanced nasopharyngeal carcinoma: a phase 3 multicentre randomised controlled trial. Lancet Oncol 2012; 13:163–171. [DOI] [PubMed] [Google Scholar]
- 29.Chen YP, Wang ZX, Chen L, et al. A Bayesian network meta-analysis comparing concurrent chemoradiotherapy followed by adjuvant chemotherapy, concurrent chemoradiotherapy alone and radiotherapy alone in patients with locoregionally advanced nasopharyngeal carcinoma. Ann Oncol 2015; 26:205–211. [DOI] [PubMed] [Google Scholar]
- 30.Le QT, Zhang Q, Cao H, et al. An international collaboration to harmonize the quantitative plasma Epstein-Barr virus DNA assay for future biomarker-guided trials in nasopharyngeal carcinoma. Clin Cancer Res 2013; 19:2208–2215. [DOI] [PMC free article] [PubMed] [Google Scholar]
- 31.Lo YM, Chan LY, Lo KW, et al. Quantitative analysis of cell-free Epstein-Barr virus DNA in plasma of patients with nasopharyngeal carcinoma. Cancer Res 1999; 59:1188–1191. [PubMed] [Google Scholar]
- 32.Lo YM, Leung SF, Chan LY, et al. Kinetics of plasma Epstein-Barr virus DNA during radiation therapy for nasopharyngeal carcinoma. Cancer Res 2000; 60:2351–2355. [PubMed] [Google Scholar]
- 33.To EW, Chan KC, Leung SF, et al. Rapid clearance of plasma Epstein-Barr virus DNA after surgical treatment of nasopharyngeal carcinoma. Clin Cancer Res 2003; 9:3254–3259. [PubMed] [Google Scholar]


