

Abstract
Alterations in methionine metabolism that involve changes in the plasma S-adenosylmethionine (SAMe) level occur in chronic liver diseases. However, no evidence is available on whether circulating SAMe is involved in the development of liver cirrhosis and liver cancer.
Cross-sectional data on clinical characteristics and plasma SAMe were collected for 130 cases of chronic hepatitis B (CHB) and HCC as well as for normal volunteers. Univariate and multivariate linear regression and receiver operating characteristic curves were introduced to determine their correlations.
Serum ALB and PT levels were independent clinical factors that were correlated with the plasma SAMe levels in CHB and HCC patients. A higher SAMe concentration was observed in the HCC than in the normal and CHB. By exploring the association of the Child–Pugh score with the plasma SAMe level, we found a higher SAMe level at advanced Stage C than at stage A in CHB and HCC patients. We further assessed the diagnostic performance of SAMe with respect to the stages of liver fibrosis and Child–Pugh stage. The AUROC of SAMe for the prediction of cirrhosis was 0.721, and the sensitivity and specificity was 0.707 and 0.769, respectively. The AUROC of plasma SAMe to predict Child–Pugh stage C was 0.706 in patients with CHB and 0.825 in HCC patients. The sensitivity was 0.467 and 0.800, respectively; the specificity was 0.904 and 0.781, respectively.
The plasma SAMe level was positively correlated with the severity of liver disease and might be a potential noninvasive biomarker.
INTRODUCTION
The liver has the dual task of converting methionine, via S-adenosylmethionine (SAMe) and S-adenosylhomocysteine (SAH), into homocysteine. This process is followed by the reconversion of homocysteine into methionine, which feeds the transsulfuration pathway that leads to the formation of cysteine and glutathione (GSH) from homocysteine.1 The 2 pathways are coordinated by SAMe, which inhibits the synthesis of methionine from homocysteine and activates cystathionine/3-synthase (CBS). SAMe is a very important methyl donor in the human body, and it is involved in more than 40 biochemical reactions and mostly commonly in the methylation reactions in cells. SAMe is synthesized by methionine and adenosine triphosphate (ATP) under the catalysis of methionine adenosyltransferase (MAT)2 and then plays a significant role in methylation reactions. Two genes code for MAT; one gene (MATIA) is expressed exclusively in the liver, and a second gene (MAT2A) is expressed in all tissues and in the fetal liver.3,4
It has been known for at least 50 years that alterations in methionine metabolism occur in chronic liver diseases in humans, including hepatitis, liver cirrhosis and liver cancer.5–7 Recently, methionine metabolism has been investigated in various experimental models of liver disease. Ethanol and CCl4-induced liver injuries are associated with a reduction in hepatic SAMe and an increase in SAH, overall hepatic DNA hypomethylation, reduced hepatic GSH content, and increased serum homocysteine.5,8,9 The importance of these alterations in the metabolism of methionine for the progression of disease has been substantiated by numerous studies. These studies have shown that the administration of SAMe in experimental models reduces liver damage induced by a variety of agents and processes.3,10–14 Recently, it was demonstrated that treatment with SAMe improves survival in patients with alcoholic liver cirrhosis. All of these discoveries suggest that alterations in methionine metabolism occur in human liver diseases and involve changes in the plasma SAMe level. It has been reported that SAMe regulates cellular proliferation and that the SAMe level is related to the differentiation status in that quiescent and proliferating hepatocytes have high and low levels of SAMe, respectively.15 The hepatic SAMe level is dramatically reduced shortly after a two-thirds partial hepatectomy (PH) and coincides with the onset of DNA synthesis and the induction of early response genes.16 DNA synthesis in hepatocytes is inhibited when the decrease in the level of SAMe is prevented by the administration of exogenous SAMe. In addition, SAMe is antiapoptotic in normal hepatocytes but induces apoptosis in the liver cancer-derived cell lines HepG2 and Huh-7.17
Different studies have shown that a low SAMe/SAH ratio, global DNA hypomethylation, and c-Myc overexpression occur in the livers of rats that are fed an adequate diet during hepatocarcinogenesis induced by different carcinogens in experimental models; these changes persist in dysplastic nodules (DN) and in HCC several weeks after the cessation of carcinogen administration.18 Furthermore, a decrease in SAMe with no change in SAH occurs in human HCC and to a lesser extent in the cirrhotic liver tissue that surrounds the tumor.19 These important findings suggest that the decrease in SAMe levels is strongly involved in hepatocarcinogenesis from liver cirrhosis to liver cancer. However, all of these studies were investigated in liver tissue or in liver cell lines; no evidence is available on whether the levels of human circulating SAMe are involved in the development of liver cirrhosis and liver cancer. Therefore, the clinical significance of plasma SAMe levels in patients with chronic liver diseases remains largely unknown.
Traditional method to determine plasma SAMe concentration is ultra violet ray for tissue or red blood cells, but it is not sensitive enough for human plasma, which is at nanomolar range. Fluorescence detection is more sensitive, but it is also time-consuming at the same time. Here, we used a relatively new analytical technique to detect the plasma SAM levels, ultra performance liquid chromatography coupled with tandem mass spectrometry (UPLC–MS/MS). This new technique of analytical separation science uses the principles and practicality of HPLC with increasing the attributes of speed, sensitivity and resolution. Recently, it has been identified as a powerful analytical tool for rapid and sensitive determination of plasma SAMe and SAH.20
The liver is the primary location for the metabolism of SAMe. In humans, up to 85% of all methylation reactions and as much as 48% of methionine metabolism occur in the liver.21 Therefore, liver injury may reduce SAMe availability with consequent pathophysiologic effects. But there is no profile investigated for plasma metabolite SAMe of the methionine in patients with chronic liver diseases related to HBV infection. In the present cross-sectional study of 130 patients with chronic liver diseases, we aimed to examine the clinical significance of circulating SAMe and SAH as well as the ratio of SAMe and SAH using the method of UPLC–MS/MS. We hypothesized that plasma SAM level is lower in chronic hepatitis B (CHB) and HCC patients than in normal volunteer because of reducing SAMe availability in injured liver. We also aimed to further determine the association of the diverse severity of liver diseases with the circulating SAMe level to search for a new reliable biomarker.
MATERIALS AND METHODS
Patients
We performed this study at Zhongnan Hospital of Wuhan University and prospectively recruited 130 patients between January 2012 and December 2013 who met our inclusion criteria. The clinical data were investigated, and plasma samples were obtained once the patients were admitted. The medical records of all the cases were analyzed to determine study eligibility. This study was conducted according to the ethical guidelines of the 1975 Declaration of Helsinki and was approved by the ethics committee of each participating facility. Written informed consent was obtained from all patients.
Patients who either received a diagnostic code for HBV or had a previous positive laboratory test for hepatitis B virus infection, as well as those with cirrhosis and hepatocellular carcinoma, were included. HCC diagnosis is a multistage process including clinical, laboratory, imaging and pathological examinations. Volunteers with no liver disease or systemic dysfunction were recruited and defined as the control group. Patients with extrahepatic fibrosis, metastatic tumors, a history of other tumors, or other causes of liver disease, such as alcoholic liver disease (ALD), drug-induced liver injury (DILI), autoimmune liver disease, and those who had received antiviral treatment within the previous 6 months were excluded.
Sample Preparation
The blood of patients with HBV was mainly obtained from the General Surgery Department and from the Infection Department of Zhongnan Hospital of Wuhan University from January 2012 to December 2013. The blood from normal controls was from healthy volunteers. All of the blood samples were anticoagulated by sodium citrate and were immediately centrifuged at 3000 rpm for 10 min at 4 °C to obtain the plasma; the plasma was then coded and stored at −80 °C within 2 h after the specimen was obtained. The clinical data were investigated at the same time.
Histological Assessment
Percutaneous liver biopsy was performed on all the cases except the controls to assess the stage of liver fibrosis. All liver tissue samples were evaluated by 2 experienced hepatopathologists. The fibrosis stage was determined using Ishak's scoring system, as follows22: F0, no fibrosis; F1, minimal fibrosis; F2, mild fibrosis; F3 or F4, moderate fibrosis; F5, severe fibrosis and incomplete cirrhosis; and F6, probable/definite cirrhosis.
Laboratory Tests
Serum alanine aminotransferase (ALT), aspartate aminotransferase (AST), gamma glutamyl transpeptidase (GGT), direct bilirubin (DBIL), indirect bilirubin (IDBIL), total bilirubin (TBIL), albumin (ALB), platelet (PLT), prothrombin time (PT) of all cases, and hepatitis B surface antigen (HBsAg) of HBV-infected cases were obtained from the medical records. HBsAg concentration ≥0.05 ng/mL was considered to be positive. SAMe and SAH were measured using a newly developed stable isotope dilution liquid chromatography–mass spectrometry method.
Measurement of SAMe and SAH
SAMe and SAH were measured using a newly developed stable isotope dilution liquid chromatography–mass spectrometry method. SAMe and SAH standards (from Sigma–Aldrich, St. Louis, MO) were used to prepare the standard curves. D3-SAMe (from TRC, Canada) was used as the internal standard. The chemicals used were ammonium formate, dithiothreitol, formic acid, and acetonitrile. Stock solutions were stable for at least 1 year.
A 30-μL aliquot of sample was mixed with 6 μL of internal standard solution, and then the protein was precipitated with 120 μL methanol on wet ice. The mixture was vortex-mixed for 1 min and centrifuged at 13,000 rpm for 15 min. A total of 100 μL supernatant was removed and placed into a 96-well plate and dried by liquid nitrogen. The dried supernatant in the 96-well plate was then reconstituted with 150 μL of 5 mmol/L ammonium formate, 10 μg/mL dithiothreitol and 0.15% formic acid in water/acetonitrile (v:v, 30:70), vortex-mixed for 10 min and centrifuged at 4000 rpm for 10 min at 4°C. Finally, 2 μL of sample was immediately injected for LC–MS/MS analysis.
Preparation of Calibrators and Quality Controls
The internal standard solution was 400 ng/mL of D3-SAMe dissolved in water (containing 5 nmol ammonium formate and 10 μg/mL DL-dithiothreitol and 0.15% formic acid). Calibrators were included in each batch of samples at concentrations of 1, 2, 5, 10, 50, 100, 250, 500, and 1000 ng/mL for SAMe and 1, 2, 3, 50, 100, 250, 500, and 1000 ng/mL for SAH in artificial CSF. Five different concentrations of quality controls were used that contained 3, 20, 40, 400, and 800 ng/mL of SAMe and 10, 40, 400, and 800 ng/mL of SAH.
UPLC–MS/MS Conditions
The measurements for UPLC–MS/MS were performed using an ACQUITY Ultra Performance LC system (Waters, Milford Massachusetts), which was coupled to an API4000 tandem mass spectrometer (AB Sciex, Framingham Massachusetts). The samples were separated on a Waters ACQUITY UPLC® BEH Amide (2.1 mm × 100 mm, 1.7 μm particle size) column. The column temperature was 50 °C, with a mobile phase flow rate of 0.55 mL/min over a total run time of 2.2 min. The mobile phases consisted of (A) 0.1% formic acid in water/acetonitrile (v/v, 95/5) and (B) 0.1% formic acid in acetonitrile/water (v/v, 95/5). SAMe and SAH were eluted by the same linear gradient with 78% B at the initial time to 30% B after 1.40 min, and 0% after 1.6 min. After 2 min, it changed from 0% to 78% until the end of the experiment. The retention time was 1.24 min for SAMe, 1.24 min for D3-SAMe and 1.10 min for SAH. The sample injection volume was 2 μL. The test was repeated 3 times for each sample and the average value was calculated.
Statistics
All data were analyzed using IBM SPSS statistics software version 19.0. Data are presented as the mean ± standard deviation or percent (%). The differences in SAMe, SAH and the SAMe/SAH ratio among control and the patients with CHB and HCC were assessed using one-way ANOVA. The relationship between SAMe and the other variables was assessed using models of stepwise multiple linear regression. The mean values of SAMe in relation to Child–Pugh stages and fibrosis stages (F0–2 vs F3–6) were assessed using one-way ANOVA and Tukey's test. The predictive accuracy of SAMe was assessed with a calculation of the AUROC, and the sensitivity and specificity of these variables were calculated using the receiver operating characteristic (ROC) curves. The optimal cut-off points to predict disease severity were chosen based on the ROC to maximize both sensitivity and specificity.
RESULTS
Characteristics of All the Cases
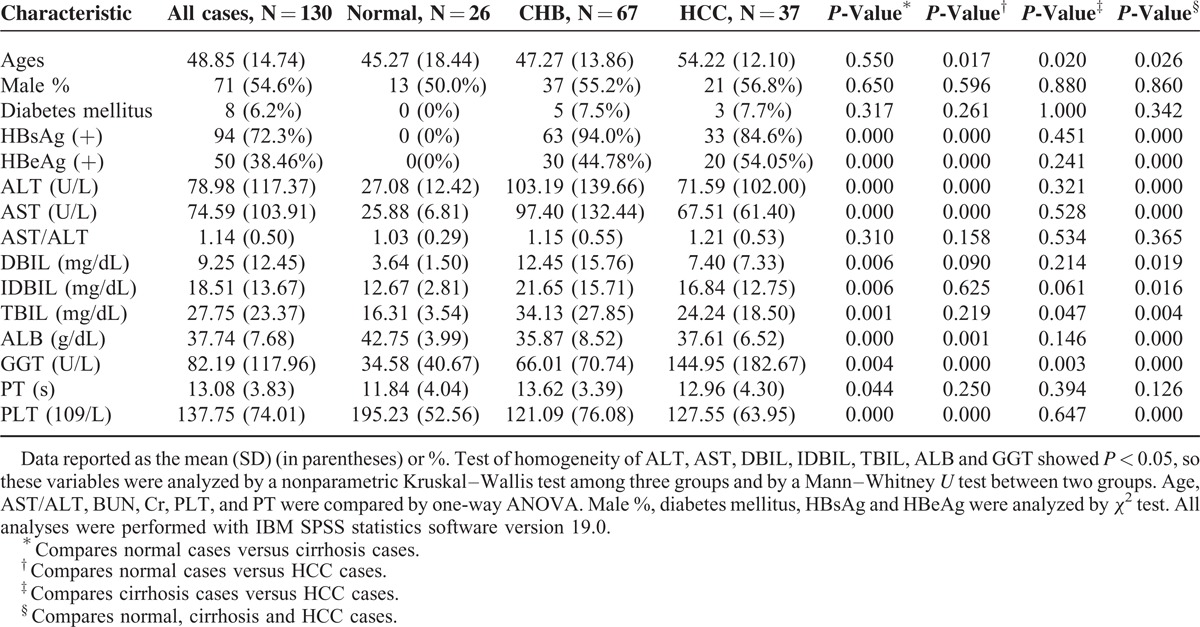
We recruited 130 cases (normal group: 26; CHB group: 67; HCC group: 37) between 18 and 84 years old who met our initial inclusion criteria. The baseline characteristics of the total 130 cases are summarized in Table 1. The results showed a significant difference in ages between the HCC cases and the normal controls and CHB cases (P < 0.05). Four patients (6.0%) with CHB and 4 patients (15.4%) with HCC were HBsAg-negative because of previous antiviral treatment. Patients with CHB and HCC had a higher percentage of HBsAg (+) and higher mean levels of serum ALT, AST, DBIL, IDBIL, TBIL, ALB, GGT, and PLT. The differences in AST/ALT and PT among the 3 groups were not significant.
TABLE 1.
Clinical Characteristic of the 130 Cases
The stages of fibrosis were identified after liver biopsy. According to Ishak's scoring system, we assessed 11 (16.4%) cases as F0, 15 cases as F1 to F2 (22.4%), and 41 cases as F3 to F6 (61.2%) in the CHB group. The distribution of the stages of fibrosis in the HCC group was F0 in 5 (13.5%) cases, F1 to F2 in 8 (21.6%) cases and F3 to F6 in 24 (64.9%) cases.
The Plasma SAMe Concentration is Affected by PT and ALB
We measured the plasma levels of SAMe and SAH with the UPLC–MS/MS method. Typical chromatograms of SAMe and SAH in the plasma are shown in Figure 1. The total run time of the mobile phase was 2.2 min. The retention time was 1.24 min for SAMe, 1.24 min for D3-SAMe and 1.10 min for SAH. The lower limit of quantization (LLOQ) was 1 ng/mL, and the upper limit of quantization (ULOQ) was 1000 ng/mL. The calibration curves were linear over concentrations of 1 to 1000 ng/mL both for SAMe and SAH (Figure 1). In all cases, the coefficients of linear correlation (r2) were >0.999 for the calibration curves of both SAMe and SAH. The accuracy was calculated based on the calibration, and all of the measurements of accuracy were over 85%.
FIGURE 1.
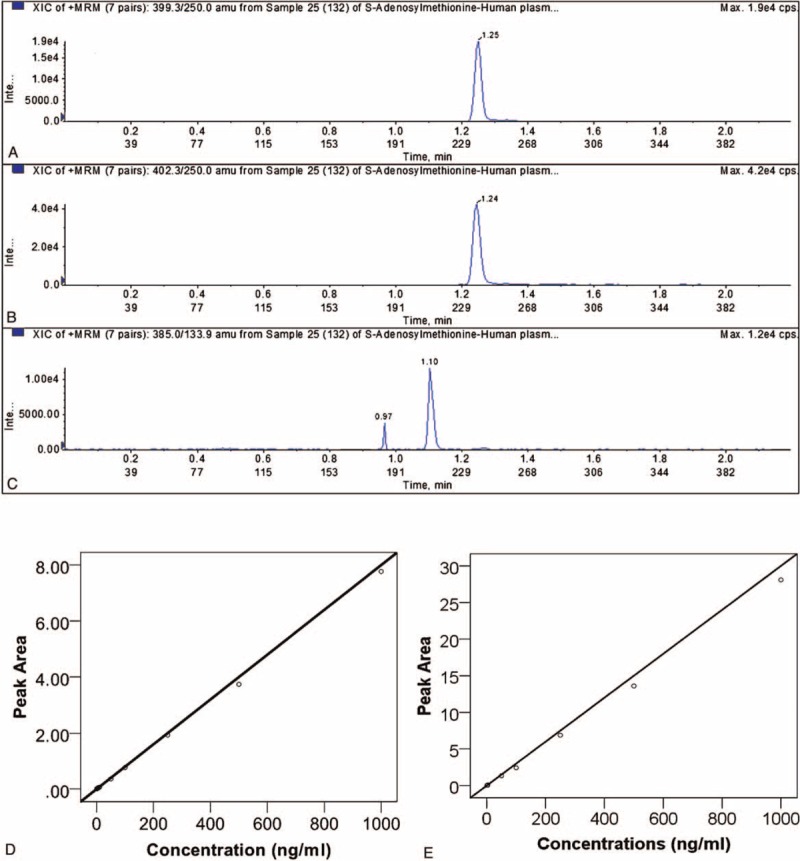
Mass fragmentogram obtained in a plasma sample for SAMe (A), 2H3-SAMe (B) and SAH (C). The measured concentrations were 51.9 ng/mL of SAMe and 53.9 ng/mL of SAH. Calibration curves for SAMe (D). The standard/internal standard peak-area ratios were plotted vs SAMe concentrations) and SAH (E). The standard peak-area ratios were plotted versus SAH concentrations.
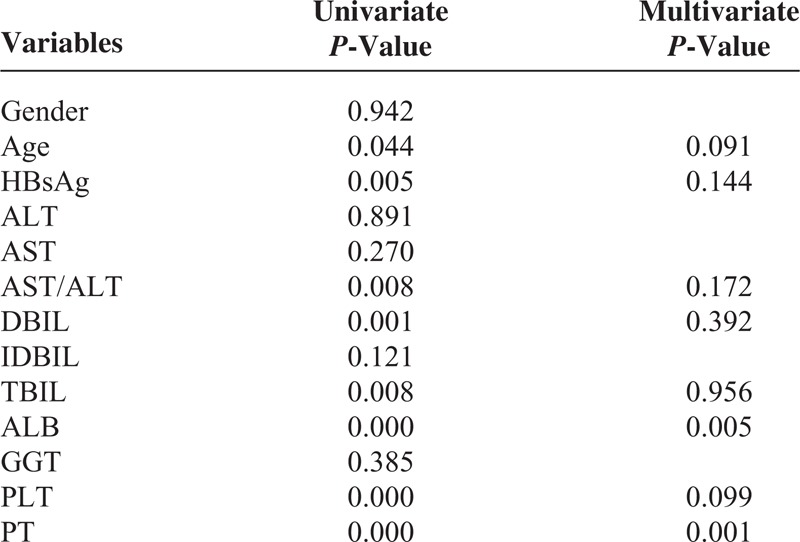
To determine which variables affect the plasma concentration of SAMe, we examined the effect of demographics and clinical characteristics of these cases on the plasma SAMe levels by univariate and multivariate analyses (Table 2). The results of the univariate analyses showed that age, HBsAg, and serum levels of AST/ALT, DBIL, TBIL, ALB, PLT, and PT were significant variables that were correlated with the plasma level of SAMe. Multivariate analyses identified PT and ALB as independent factors in stepwise models (Table 2). The effect of PT and ALB on the SAMe level can be constructed by modeling its value and coefficient of regression with stepwise forward selection. The formula for SAMe was as follows: SAMe (ng/mL) = 33.723+1.351 × PT(s) − 0.566 × ALB (g/dL).
TABLE 2.
Variables Associated With SAM Concentration by Univariate and Multivariate Analyses
The Plasma SAMe Level is Higher in Patients With HCC
To investigate the clinical significance of the plasma SAMe level, we measured the level of plasma SAMe and SAH in patients with CHB, patients with HCC and normal controls (Figure 2). We found that there was a higher SAMe concentration in patients with HCC compared with the normal controls (P = 0.002) and patients with CHB (P = 0.002), but no significant difference was observed between the CHB group and the normal group (P = 0.130). The SAH levels and SAMe/SAH ratio were similar among the patients of the 3 groups.
FIGURE 2.
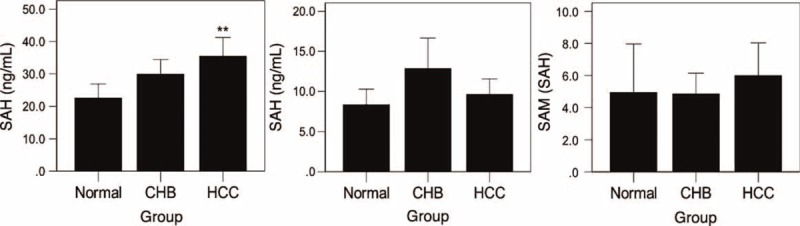
The various SAMe, SAH and SAMe/SAH levels in different groups. (A) Various SAMe levels in normal, CHB and HCC cases. There was a higher SAMe concentration in the HCC group compared with the normal group (P = 0.002) and the CHB group (P = 0.002), while no significant difference was observed between the CHB group and the normal group (P = 0.130); (B) The various SAH levels in normal, CHB and HCC cases. No significant differences were observed among the 3 groups (P > 0.05). (C) The various SAMe/SAH ratios in normal, CHB and HCC cases were similar (P > 0.05).
Association of the Child–Pugh Score With Plasma SAMe Levels
By studying the associations of the clinical characteristics with plasma SAMe levels using the univariable and stepwise multivariable linear regression analyses, we found that PT and ALB were independent factors. Generally speaking, the Child–Pugh score is used to assess the prognosis of chronic liver disease; additionally, PT and ALB are useful indices to estimate liver function according to the Child–Pugh score. Therefore, we explored the association of the Child–Pugh score with plasma SAMe levels in patients with CHB and HCC. We classified CHB and HCC cases according to Child–Pugh scores and then analyzed the difference in the SAMe levels among the various stages. The results showed a significantly higher SAMe level in patients with CHB with advanced Stage C than in the patients with stage A (P = 0.007); the same result was also observed in patients with HCC (P = 0.019), but no significant difference was observed between stages A and B or between stages B and C in patients with CHB and HCC (Figure 3). Then, we generated 2 ROC curves to predict stage C in patients with CHB and HCC, and the result showed that the AUROC was 0.706 (P = 0.015) in patients with CHB and 0.825 (P = 0.021) in patients with HCC. The sensitivity and specificity of the plasma SAMe level for the prediction of Child–Pugh Stage C in patients with CHB were 0.467 and 0.904, respectively, at the optimal cut-off value of 49.975 ng/mL. For patients with HCC, the optimal cut-off value was 44.950 ng/mL, and the sensitivity and specificity were 0.800 and 0.781, respectively.
FIGURE 3.
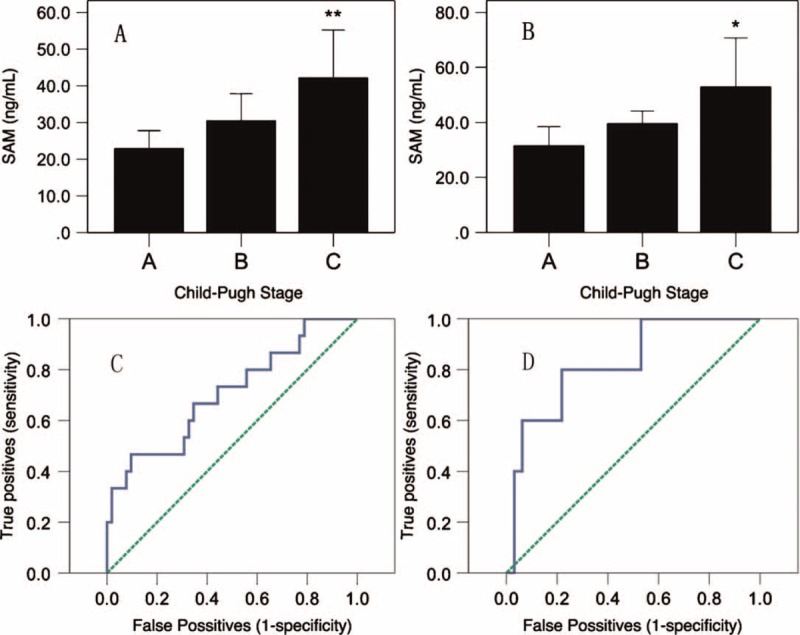
SAMe levels and ROC of Child–Pugh stages. (A) SAMe levels of different Child–Pugh stages in CHB patients. (B) SAMe levels of different Child–Pugh stages in HCC patients. (C) ROC of CHB patients for the prediction of Stage C. (D) The ROC of cases of HCC for the prediction of Stage C.
Plasma SAMe Level Can Predict the Degree of Cirrhosis in Patients With CHB
Cirrhosis is a result of advanced liver disease. It is characterized by the replacement of liver tissue by fibrotic tissue (scar tissue) and regenerative nodules. These changes lead to the loss of liver function and hepatocarcinogenesis. To further investigate the clinical significance of the plasma SAMe level, we compared the plasma SAMe levels according to the degree of fibrosis in patients with CHB and HCC. The results showed that there are only significantly difference between F0 to F2 and F3 to F6 (P < 0.05, F0 vs F1–6 and F0–1 vs F2–6 P > 0.05) when compared with plasma SAMe levels between different fibrosis stages. So we divided all patients into 2 groups: the F0 to F2 group and the F3 to F6 group according to the degree of fibrosis. The distribution of the plasma SAMe levels in relationship to the stages of fibrosis are presented in Figure 4. A significant difference in the plasma SAMe level was observed between the F0 to F2 and the F3 to F6 groups (P = 0.001). We assessed the diagnostic performance of SAMe on the stages of fibrosis using a ROC curve. The AUROC of SAMe predicted that the degree of fibrosis (F0–2 vs F3–6) was 0.721 (P = 0.002). The sensitivity and specificity were 0.707 and 0.769, respectively, with the optimal cut-off value of 23.64 ng/mL. However, we did not find a significant difference in the plasma SAMe levels among patients with HCC with different stages of fibrosis (F0–6).
FIGURE 4.
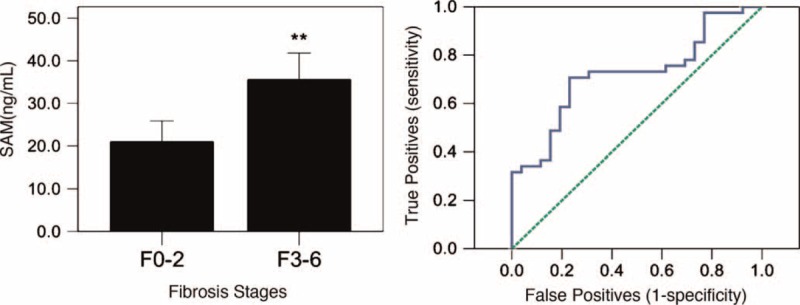
Plasma SAMe level in different fibrosis stages. (A) Comparison of various SAMe levels between Ishak's fibrosis stages F0 to F2 and F3 to F6 in the CHB group. (B) The ROC curve for fibrosis scores in the diagnosis of F0 to F2 to F3 to F6.
DISCUSSION
The downregulation of the liver-specific MAT1A gene, which encodes SAMe-synthesizing isozymes MATI/III, and the upregulation of the widely expressed gene MAT2A, which encodes the MATII isozyme, known as MAT1A:MAT2A switch occurs in liver cirrhosis and in HCC in both rodents and humans HCC.1,19,23 This leads to a decrease in the SAMe levels during hepatocarcinogenesis in rodents and humans. Thus, we speculated that the plasma SAMe levels would decrease in human hepatocarcinogenesis and could be used as a determinant of liver cancer progression and prognosis. However, our study demonstrated that patients with HCC had higher plasma SAMe concentration than did patients with CHB and normal controls, which was opposite to our expectations. This might be explained by the possibility that circulating SAMe is produced by both abnormal and normal liver cells. Damaged liver cells showed a decrease in SAMe levels, but normal liver cells produced more SAMe by functional compensation. At the same time, when liver cells were damaged or were dying, intracellular SAMe was released into the plasma, which also may have contributed to the higher plasma SAMe level. This speculation was supported by our observation, and the univariate analyses showed that age, HBsAg, AST/ALT, DBIL, TBIL, ALB, PLT, and PT were significant variables that were correlated with the plasma SAMe level; similarly, the multivariate analyses identified PT and ALB as independent factors in stepwise models. Furthermore, we explored the association of the Child–Pugh score with plasma SAMe levels in patients with CHB and HCC; the results showed that there was a positive correlation between the Child–Pugh score and the levels of plasma SAMe. These results suggested that the concentration of SAMe in the plasma was significantly negatively correlated with liver function.
The Child–Pugh score is used for the assessment of liver reserve ability and for the prognosis of patients with CHB; it takes into account the total bilirubin, serum ALB, prothrombin, ascites and hepatic encephalopathy. However, ascites and hepatic encephalopathy are relatively subjective, and therefore, a more quantizing variable is needed. The gold standard to diagnose the severity of liver fibrosis is liver biopsy; however, it is invasive and costly, and its accuracy is questionable because of sampling errors and intra- and inter-observer variations.24 Therefore, many experts are searching for an ideal noninvasive blood marker. Several markers of fibrosis in patients with CHB have been discovered to date.25 The original European Liver Fibrosis (OELF) test considers age, and levels of tissue inhibitor of matrix metalloproteinase (TIMP)-1, hyaluronic acid (HA) and amino-terminal propeptide of type III procollagen (PIIINP). A newly proposed noninvasive test uses the PP score and a formula that includes PLT count and PIIINP.26 In this study, we compared the plasma SAMe levels according to the degree of fibrosis in patients with CHB and HCC and found a significant difference in the plasma SAMe levels between patients in the F0 to F2 group and patients in the F3 to F6 group. We further assessed the diagnostic performance of SAMe on the stages of liver fibrosis and liver Child–Pugh stage using a ROC curve. Our results indicated that plasma SAMe played a significant role in the prediction of Child–Pugh stage C and liver fibrosis stage F3 to F6 with high sensitivity and specificity. These results suggest that plasma SAMe might be a potential noninvasive biomarker for the prediction of the severity of HBV-related liver disease.
To verify our hypothesis more comprehensively, we compared the plasma SAMe concentrations with several aspects of the severity of liver disease, including normal controls versus patients with CHB versus patients with HCC, liver reserve ability and the severity of liver fibrosis. And also, the detection of plasma SAMe concentrations were repeated 3 times and the average value was calculated to decrease the differences between batches. We therefore validated that the plasma SAMe concentration was positively correlated with the severity of liver disease. It was unclear why there were differences between the F0 to F2 and F3 to F6 groups in patients with CHB but not in patients with HCC. This may be because of the different reaction patterns of SAMe in cells in CHB and HCC. Further research is needed to resolve this issue.
Our study has multiple strengths, including that it is the first study to examine the association between clinical plasma SAMe and HBV-related liver diseases. Our study was conducted in China, where hepatitis B is a common infectious disease. We employed a rigorous study design and assessed the stages of fibrosis using Ishak's scoring system. All of the blood samples that were used were collected at 7:00–8:00 in the morning to minimize the potential effect of diurnal pulsatile fluctuation in SAMe levels. All laboratory tests were performed in a blinded manner. This study represents the first effort in the field to quantitatively analyze the plasma SAM and SAH profiles in CHB, HCC and control group and the data show that the SAM levels correlated with late stages of fibrosis as well as with the extent of damaged liver reserve (Child–Pugh scores). Thus, detection of the plasma SAM levels can offer potentially clinical utility as a new biomarker although such clinical application is till preliminary.
However, our study also has limitations. First, we did not measure other blood biomarkers to compare the AUROC and the sensitivity and specificity with plasma SAMe. Many models have been constructed to assess the severity of liver fibrosis. If we used these models for the plasma SAMe level, or combined the SAMe level with other blood biomarkers, the results of this study might have been more promising. Second, we only studied the effect of the concentration of SAMe in the plasma on HBV-related liver disease. It should be explored whether the results of our study can be replicated in serum samples obtained from individuals with other types of liver diseases, such as HCV-related diseases or ALD. Thirdly, we did not determine the kinetics data of plasma SAMe in all cohorts, which was better to explain these results. Although some variables did not demonstrate a significant relationship with plasma SAMe, a large sample analysis is still needed to verify this result. More variables should be introduced to assess their coordination effect associated with plasma SAMe on liver disease severity.
In conclusion, we demonstrated that plasma SAMe is associated with the severity of HBV-related liver disease and may play an important role in the progression of liver disease. ROC curve analysis suggests that plasma SAMe might be a potential noninvasive biomarker for the prediction of the severity of liver disease. It would be promising to examine the relationship between additional variables and the levels of plasma SAMe in the assessment of the severity of HBV-related liver disease.
Footnotes
Abbreviations: ALB = albumin, ALT = alanine aminotransferase, AST = aspartate aminotransferase, ATP = adenosine triphosphate, AUROC = area under receiver operating characteristic curve, CHB = chronic hepatitis B, DBIL = direct bilirubin, GGT = gamma glutamyl transpeptidase, HBsAg = hepatitis B surface antigen, HBV = hepatitis B virus, HCC = hepatocellular carcinoma, IDBIL = indirect bilirubin, MAT = methionine adenosyltransferase, PLT = platelet, PT = prothrombin time, ROC = receiver operating characteristic, SAH = S-adenosylhomocysteine, SAMe = S-adenosylmethionine, TBIL = total bilirubin, UPLC–MS/MS = ultraperformance liquid chromatography tandem mass spectrometry.
Ting Li and Guozheng Yu contributed equally to this work.
Financial support: This work was supported by grants from the National Natural Science Foundation of China (No 30872491/C160402, 81372552 and 81172349/H1617).
Authors’ contributions: QYL, ZSL, and TL conceived and designed the study. QYL, TL, GZY, TG, WJL, HLQ, YTB, YFY and YMH performed the study. QYL and TL wrote the paper.
The authors have no conflicts of interest to disclose.
REFERENCES
- 1.Mato JM, Corrales FJ, Lu SC, et al. S-Adenosylmethionine: a control switch that regulates liver function. FASEB J 2002; 16:15–26. [DOI] [PubMed] [Google Scholar]
- 2.Kluijtmans LA, Young IS, Boreham CA, et al. Genetic and nutritional factors contributing to hyperhomocysteinemia in young adults. Blood 2003; 101:2483–2488. [DOI] [PubMed] [Google Scholar]
- 3.Mato JM, Alvarez L, Ortiz P, et al. S-Adenosylmethionine synthesis: molecular mechanisms and clinical implications. Pharmacol Ther 1997; 73:265–280. [DOI] [PubMed] [Google Scholar]
- 4.Gil B, Casado M, Pajares MA, et al. Differential expression pattern of S-adenosylmethionine synthetase isoenzymes during rat liver development. Hepatology 1996; 24:876–881. [DOI] [PubMed] [Google Scholar]
- 5.Tsukamoto H, Lu SC. Current concepts in the pathogenesis of alcoholic liver injury. FASEB J 2001; 15:1335–1349. [DOI] [PubMed] [Google Scholar]
- 6.Marchesini G, Bugianesi E, Bianchi G, et al. Defective methionine metabolism in cirrhosis: relation to severity of liver disease. Hepatology 1992; 16:149–155. [DOI] [PubMed] [Google Scholar]
- 7.Avila MA, Berasain C, Torres L, et al. Reduced mRNA abundance of the main enzymes involved in methionine metabolism in human liver cirrhosis and hepatocellular carcinoma. J Hepatol 2000; 33:907–914. [DOI] [PubMed] [Google Scholar]
- 8.Purohit V, Abdelmalek MF, Barve S, et al. Role of S-adenosylmethionine, folate, and betaine in the treatment of alcoholic liver disease: summary of a symposium. Am J Clin Nutr 2007; 86:14–24. [DOI] [PubMed] [Google Scholar]
- 9.Erman F, Balkan J, Cevikbas U, et al. Betaine or taurine administration prevents fibrosis and lipid peroxidation induced by rat liver by ethanol plus carbon tetrachloride intoxication. Amino Acids 2004; 27:199–205. [DOI] [PubMed] [Google Scholar]
- 10.Cederbaum AI. Hepatoprotective effects of S-adenosyl-L-methionine against alcohol- and cytochrome P450 2E1-induced liver injury. World J Gastroenterol 2010; 16:1366–1376. [DOI] [PMC free article] [PubMed] [Google Scholar]
- 11.Cave M, Deaciuc I, Mendez C, et al. Nonalcoholic fatty liver disease: predisposing factors and the role of nutrition. J Nutr Biochem 2007; 18:184–195. [DOI] [PubMed] [Google Scholar]
- 12.Ko K, Yang H, Noureddin M, et al. Changes in S-adenosylmethionine and GSH homeostasis during endotoxemia in mice. Lab Invest 2008; 88:1121–1129. [DOI] [PMC free article] [PubMed] [Google Scholar]
- 13.Yang H, Ko K, Xia M, et al. Induction of avian musculoaponeurotic fibrosarcoma proteins by toxic bile acid inhibits expression of glutathione synthetic enzymes and contributes to cholestatic liver injury in mice. Hepatology 2010; 51:1291–1301. [DOI] [PMC free article] [PubMed] [Google Scholar]
- 14.Yang H, Ramani K, Xia M, et al. Dysregulation of glutathione synthesis during cholestasis in mice: molecular mechanisms and therapeutic implications. Hepatology 2009; 49:1982–1991. [DOI] [PMC free article] [PubMed] [Google Scholar]
- 15.Martinez-Chantar ML, Garcia-Trevijano ER, Latasa MU, et al. Methionine adenosyltransferase II beta subunit gene expression provides a proliferative advantage in human hepatoma. Gastroenterology 2003; 124:940–948. [DOI] [PubMed] [Google Scholar]
- 16.Huang ZZ, Mao Z, Cai J, et al. Changes in methionine adenosyltransferase during liver regeneration in the rat. Am J Physiol 1998; 275 (1 Pt 1):G14–G21. [DOI] [PubMed] [Google Scholar]
- 17.Ansorena E, Garcia-Trevijano ER, Martinez-Chantar ML, et al. S-Adenosylmethionine and methylthioadenosine are antiapoptotic in cultured rat hepatocytes but proapoptotic in human hepatoma cells. Hepatology 2002; 35:274–280. [DOI] [PubMed] [Google Scholar]
- 18.Lu SC, Huang ZZ, Yang H, et al. Changes in methionine adenosyltransferase and S-adenosylmethionine homeostasis in alcoholic rat liver. Am J Physiol Gastrointest Liver Physiol 2000; 279:G178–G185. [DOI] [PubMed] [Google Scholar]
- 19.Calvisi DF, Simile MM, Ladu S, et al. Altered methionine metabolism and global DNA methylation in liver cancer: relationship with genomic instability and prognosis. Int J Cancer 2007; 121:2410–2420. [DOI] [PubMed] [Google Scholar]
- 20.Struys EA, Jansen EE, de Meer K, et al. Determination of S-adenosylmethionine and S-adenosylhomocysteine in plasma and cerebrospinal fluid by stable-isotope dilution tandem mass spectrometry. Clin Chem 2000; 46:1650–1656. [PubMed] [Google Scholar]
- 21.Finkelstein JD. Methionine metabolism in mammals. J Nutr Biochem 1990; 1:228–237. [DOI] [PubMed] [Google Scholar]
- 22.Ishak K, Baptista A, Bianchi L, et al. Histological grading and staging of chronic hepatitis. J Hepatol 1995; 22:696–699. [DOI] [PubMed] [Google Scholar]
- 23.Lu SC, Mato JM. Role of methionine adenosyltransferase and S-adenosylmethionine in alcohol-associated liver cancer. Alcohol 2005; 35:227–234. [DOI] [PubMed] [Google Scholar]
- 24.Colloredo G, Guido M, Sonzogni A, et al. Impact of liver biopsy size on histological evaluation of chronic viral hepatitis: the smaller the sample, the milder the disease. J Hepatol 2003; 39:239–244. [DOI] [PubMed] [Google Scholar]
- 25.Rosenberg WM, Voelker M, Thiel R, et al. Serum markers detect the presence of liver fibrosis: a cohort study. Gastroenterology 2004; 127:1704–1713. [DOI] [PubMed] [Google Scholar]
- 26.Lee MH, Cheong JY, Um SH, et al. Comparison of surrogate serum markers and transient elastography (Fibroscan) for assessing cirrhosis in patients with chronic viral hepatitis. Dig Dis Sci 2010; 55:3552–3560. [DOI] [PubMed] [Google Scholar]