

Abstract
The purpose of this study is to describe the detailed clinical, chest computed tomography (CT), and 18F-fluorodeoxyglucose positron emission tomography (FDG PET) characteristics of the tumor boundary for the diagnosis and investigate the outcome of pulmonary sclerosing pneumocytoma (PSP) using confirmed large data of a tertiary referral center.
Confirmed 76 patients were included. We evaluated the findings of CT including 4 CT signs, FDG PET, and histopathology.
Most patients had a single lesion (92.1%), smooth boundary (65.8%), and oval shape (65.8%) and the mean diameter was 22.7 mm. The CT signs included marginal pseudocapsule (50%), overlying vessel (26.3%), air gap (2.6%), and halo sign (17.1%). A predominantly solid was the most common histopathologic type. The mean maximum standardized uptake value on FDG PET of 17 patients was 1.8 (range, near 0 or normal tissue metabolism ∼2.9).
PSP should be considered in middle-aged women whose CT features show incidental nodule(s), commonly with surrounding ground-glass opacity and characteristic CT signs of the tumor boundary, and hypometabolic uptake on FDG PET. Outcome of patients is excellent.
INTRODUCTION
Pulmonary sclerosing pneumocytoma (PSP), also known as pulmonary sclerosing hemangioma, is a rare, benign lung neoplasm that occurs predominantly in middle-aged women.1,2 The etiology and pathogenesis of PSP are still unclear. However, because PSP is a type of benign epithelial tumor,2–5 it has generally been agreed that the name “sclerosing hemangioma” is a misnomer, and therefore the names pneumocytoma, sclerosing pneumocytoma, or papillary pneumocytoma have been suggested as alternatives.6
PSPs are composed of 4 major histologic patterns that vary in their proportions, that is, hemangiomatous, papillary, sclerotic, and solid,3 and demonstrate various computed tomography (CT) findings according to its composition.7–10 It has been described that PSP usually demonstrates as a well-defined, juxta-pleural nodule with strong and homogeneous enhancement7,8,11 on CT, and several studies analyzed CT findings of PSP and its pathologic correlation.1,7,12 However, case number of each study is small and there are still encountered limitations in clinical practice to diagnosis of PSP using preoperative imaging modalities based on these studies. In addition, a few studies were investigated in PSP using 18F-fluorodeoxyglucose positron emission tomography (FDG PET).13–15
The purpose of this study is to describe the detailed clinical, chest CT, and FDG PET characteristics of the tumor boundary for the diagnosis and investigate the outcome of PSP using confirmed large data of a tertiary referral center.
MATERIALS AND METHODS
Patient Characteristics
This study conducted at a single, tertiary center was approved by the Institutional Review Board, and informed consent was waived. Among 77 patients with histologically proven PSP, 1 patient was excluded because there was only nonenhanced chest CT in the patient. Finally, 76 consecutive patients were included, comprising 67 females (88.2%) and 9 males (11.8%) ranging in age from 11 to 76 years (median, 50 years) who were confirmed between February 2005 and November 2011. Fifty-four patients (71.0%) were incidentally found without symptom and 16 patients (21.1%) were found with PSP during workup of metastasis. In addition, 6 patients (7.9%) of PSP examined chest CT because of hemoptysis. Chest CT studies were acquired in all patients during the week preceding the tissue confirmation. We also assessed the clinical symptoms, focusing on hemoptysis, and reviewed the disease-specific survival rate from February 2005 until the latest outpatients’ follow-up.
Diagnosis of PSP
Tissue Confirmation by Needle Biopsies
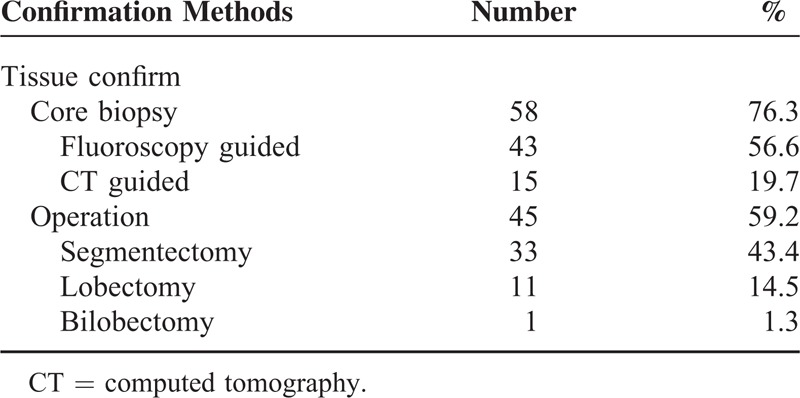
Among 76 patients, 58 patients (76.3%) were diagnosed by either CT or fluoroscopy-guided core-needle biopsy. CT-guided core needle biopsies were performed using 16-channel SOMATOM Sensation (Siemens Medical Solutions, Forchheim, Germany) CT and fluoroscopy-guided core needle biopsies were performed using Siemens Artis zee multipurpose system (Siemens AG, Muenchen, Germany). These procedures were performed with a 20-gauge semiautomatic core biopsy needle (Stericut with coaxial guide, TSK Stericut; TSK Laboratory, Soja, Japan). One to 3 times of biopsies were done with patients’ breath holding during each procedure in order to get sufficient tissues for diagnosis (Table 1).
TABLE 1.
Tissue Confirmation Methods of Pulmonary Sclerosing Pneumocytoma
Tissue Confirmation by Surgical Methods
Forty-five patients (59.2%) were finally proved as PSPs through surgery. Among these 45 patients, CT or fluoroscopy-guided core needle biopsies were already done in 27 patients. After needle biopsy, some cases showed atypical patterns that could not exclude malignancy on histopathological diagnosis or had CT findings that were highly suspicious of malignancy, and additional surgery was performed. Among 45 patients, segmentectomy was most commonly done in 33 patients, followed by lobectomy (11 patients). A bilobectomy was done in a patient (Table 1).
CT Evaluation
CT Scanning Protocol
Various generations of CT scanners were used for this study. The most representative chest CT examinations were performed using the SOMATOM (Siemens Medical Solutions) (61 patients) or the Lightspeed volume-computed tomography (General Electric Medical Systems, Milwaukee, WI) (15 patients). The SOMATOM scanner was used with the following parameters: 120 kV peak and 100 effective mAs with dose modulation. Reconstruction intervals were 5 mm thickness, which is a 5-mm interval without a gap for the B50 algorithm and 1 mm reconstruction with a 5-mm gap for the B60 algorithm. The General Electric CT scanner was used with the following parameters: 120 kV peak and 100–300 mA with dose modulation. Reconstruction intervals were 5 mm thickness, which is a 5-mm interval without a gap with the lung algorithm and 1.25 mm reconstruction with a 5-mm gap with the bone algorithm.
The scan range was from the supraclavicular area to the level of adrenal glands and CT images were obtained with a 50-second delay after intravenous administration of 100 mL intravenous contrast and 50 mL of normal saline at a rate of 2.5 mL/s using a power injector. All images were viewed on the mediastinal (width, 450 Hounsfield Unit (HU); level, 50 HU) and lung window (width, 1500 HU; level, –700 HU) axial image settings on picture archiving and communication system.
CT Evaluation
Two radiologists (M.Y.K. and S.Y.S. with 18 and 2 years of clinical experience, respectively, in thoracic radiology) who were blinded to the clinical data except that the patient had a PSP, evaluated CT images in consensus.
Using CT scans of 76 patients, we described the following: the size (the maximal long-axis diameter); type of nodule (≤30 mm) or mass (>30 mm); number of lesions; 2 boundaries, that is, smooth or irregular; 3 shapes, that is, round, oval, or lobulating; 2 components, that is, outer ground-glass opacity (GGO) or internal calcification; 5 lobar locations, that is, right upper lobe, right middle lobe, right lower lobe, left upper lobe, or left lower lobe; and 2 axial locations, that is, juxta-pleural or juxta-fissural or enveloped by lung parenchyma.
We analyzed 4 CT signs, that is, marginal pseudocapsule, overlying vessel, air gap, and halo sign, using 77-enhanced CT scans (defined in Figure 1). The “marginal pseudocapsule sign” was defined as adjacent compressed lung parenchyma next to a lesion mimicking a capsule. The “overlying vessel sign” was defined as considerable engorgement of the feeding vessel adjacent to the lesion. The “air-gap sign” was defined as a gap or half-moon region without lung markings around the lesion. The “halo sign” was defined as a ring-like or semicircular region of GGO around the lesion.9
FIGURE 1.
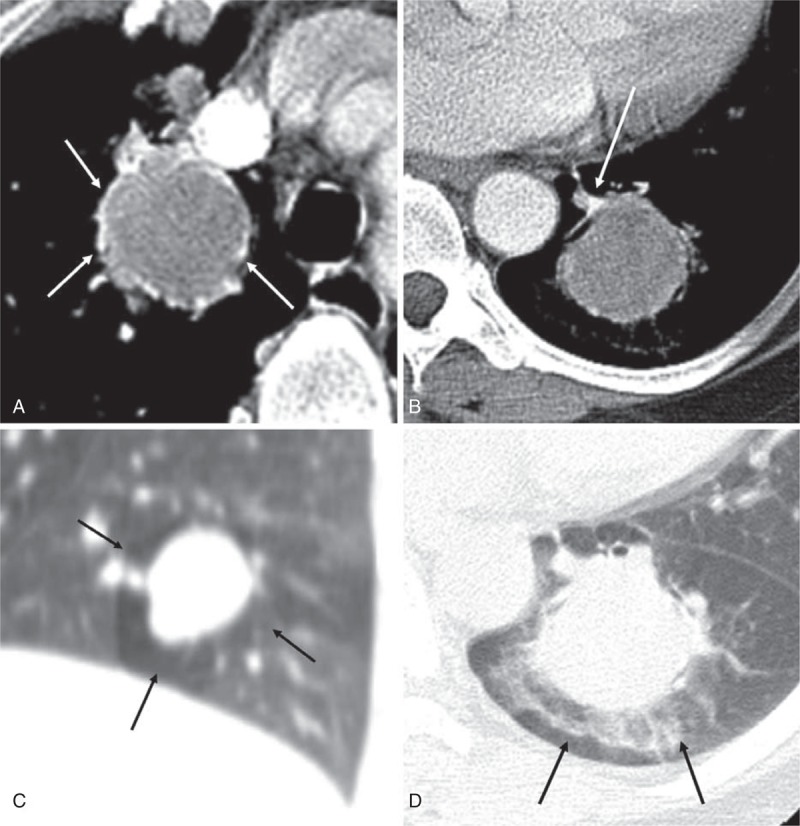
Examples of 4 CT signs. (A) The contrast-enhanced axial image shows a mass with enhancing high attenuated rim (white arrows), defined as the “marginal pseudocapsule sign.” (B) The contrast-enhanced axial CT image shows an obviously enhanced, engorged vascular structure (white arrow) observed at the edges extending toward the hilum of the lung. It was defined as the “overlying vessel sign.” (C) The coronal reconstructed CT image with lung window setting shows a crescent-shaped low attenuated region (black arrows) without lung markings around the mass. It was defined as the “air gap sign.” (D) The axial CT image with lung window setting shows a mass with surrounding GGO (black arrows), defined as the “halo sign”. CT = computed tomography, GGO = ground glass opacity.
We also described the characteristics of the nodules on CT: the attenuation values measured in HU using a circular region of interest (as much of the lesion, avoid necrotic or GGO area or calcification); 3 relative attenuations compared with chest wall muscle, that is, hypodense, isodense, and hyperdense; and 2 textures of the lesion (homogeneous or heterogeneous attenuation) compared with the chest wall muscle. While we analyzed the parameters above, the overall lesions of the nodule or mass, not 1 axial lesion, were used to analyze by reviewing all images including axial and coronal images as possible. In addition, during the analyzing of the third parameter above, if the lesion contained a small part of an internal low attenuation except calcifications, the lesion was regarded as a heterogeneous enhancement pattern. Furthermore, if a patient contained multiple lesions, the largest nodule or mass was used to evaluate measurements of the attenuation, the size, and so on.
In addition, we also evaluated the diagnostic accuracy as the “first impression at the preoperative CT reading” in the formal CT report prior to tissue confirmation.
FDG PET Evaluation
FDG PET was run using a PET/CT scanner (Discovery PET/CT 690; GE Health Care, Mississauga, ON, Canada). After fasting for at least 6 hours, 18F-FDG (5.2 MBq/kg body weight) was intravenously injected followed by PET/CT scanning after 50 minutes. Acquired images were reconstructed using 3-dimensional ordered subset expectation maximization algorithm and attenuation corrections were performed with CT attenuation maps. The standardized uptake value was calculated using lean body mass. The maximum standardized uptake value (maxSUV) of the lesion on FDG PET in 17 patients (16 underlying malignancy and 1 malignant PSP) who had available FDG PET images was described. We used a maxSUV 2.5 as cutoff value between lesions more likely to be benign (<2.5 maxSUV, hypometabolic) or malignant (>2.5 maxSUV, hypermetabolic) in our study. The interval between PET and CT study was mean 3.2 months (range 2–6).
Histopathological Analysis
PSP was proved through surgery in 45 patients (59.2%) and through percutaneous core biopsy in 58 patients (76.3%). The specimens were fixed with formalin, and all of the sections were stained with hematoxylin and eosin. Immunohistochemical stainings were performed to diagnose PSP to differentiate it from other tumors. A PSP showed positivity for thyroid transcription factor-1, cytokeratin, and epithelial membrane antigen, and negativity for human melanoma black-45 and Ki-67 on immunohistochemical staining.
Two pathologists reviewed 183 slides of 76 patients (mean 2.4 slides per patient) and analyzed both the percentage (5% incremental value) of 4 components, that are hemangiomatous, papillary, sclerotic, and solid (Figure 2), and the dominant histologic pattern in each patient in consensus.
FIGURE 2.
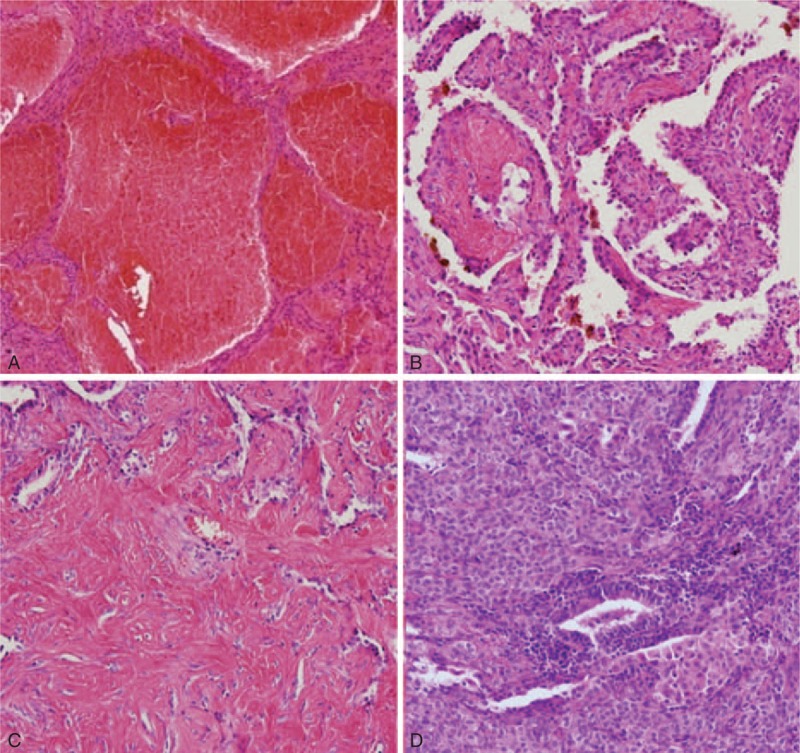
Four major histologic components of PSP. PSP = pulmonary sclerosing pneumocytoma.
Statistical Analysis
Statistical analysis was performed using commercial statistical software package (SPSS for Windows, version 21.0; SPSS Inc, Chicago, IL) by a 10-year experienced statistician (S.-S.K.). A paired t test was used to analyze the different factors between the 2 groups—the group presenting hemoptysis and the other group without hemoptysis. A P value <0.05 were considered statistically significant.
RESULTS
Patient Characteristics
The clinical characteristics of the 76 patients of PSP are shown in Table 2. In addition, Table 3 shows an age distribution of PSP. More than 50% of patients (n = 40) were middle-aged people (between 45 and 60 years of age, according to the definition of “Oxford English Dictionary”). The female (n = 67, 88.2%) to male (n = 9, 11.8%) ratio was 7.5:1. The number of patient with hemoptysis was 6 (7.9%), whereas the others were symptom free and manifested as incidental findings. Sixteen patients had other underlying malignancies (21.1%, 2 patients with double primary tumor) and the most common underlying malignancies were breast (n = 6) and thyroid cancer (n = 6). The disease-specific survival rate was 100% to the latest outpatients’ follow-up.
TABLE 2.
Clinical Characteristics of Pulmonary Sclerosing Pneumocytoma
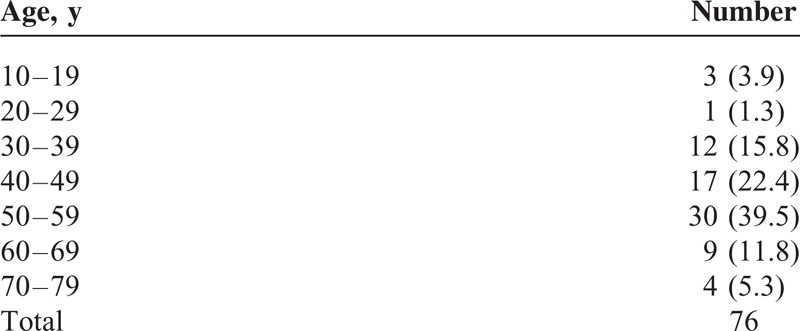
TABLE 3.
Age Distribution of Pulmonary Sclerosing Pneumocytoma
CT Evaluation
The mean PSP diameter was 22.7 mm (range, 2.5–51.5). PSP was shown in 15 patients with mass (19.7%) (Figures 3 and 4) and 61 patients with nodules (80.3%) (Figures 5 and 6). Among the 76 patients, 70 patients (92.1%) had a single lesion, 4 patients (5.3%) had 2 lesions (n = 4, 5.3%) (Figure 6), and 2 patients (2.6%) had >3 lesions. Of the patients presenting >3 lesions, 1 patient presented the largest nodule with many daughter nodules surrounding it (Figure 5). In addition, another patient had multiple lesions with surrounding GGOs and the area of GGO histopathologically showed diffuse tumor infiltration to surrounding lung parenchyma. Fifty-six patients showed a so-called solitary pulmonary nodule (<30 mm, 73.7%).
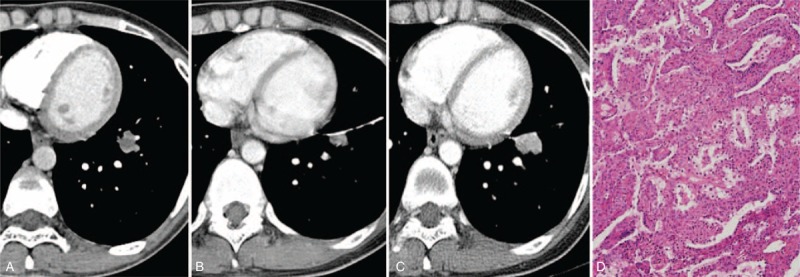
FIGURE 3.
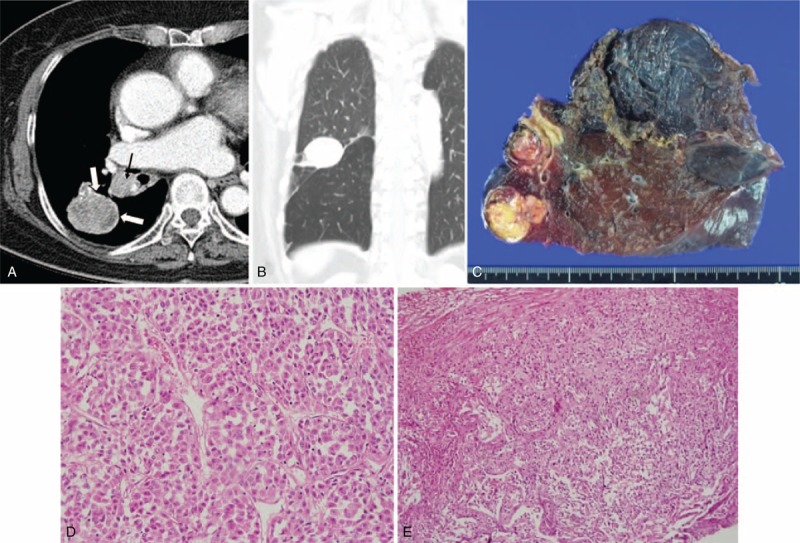
CT image and the corresponding histopathologic sections obtained in an 83-y-old woman with malignant PSP in the right lower lobe and LN metastasis. It was misdiagnosed as lung cancer in the first impression of preoperative CT reading. (A) The contrast-enhanced axial image (5 mm reconstruction) shows a mass (40 mm in size) with heterogeneous texture and lobulated boundary. It shows interval growing during 2 y (not shown, on the initial CT: 35 mm in size). Note obvious rim enhancements, “marginal pseudocapsule sign” at the edge of the mass (open arrows). There are ipsilateral interlobar (black arrow) and subcarinal (not shown) lymphadenopathy. (B) The tumor shows a juxta-fissural location on the coronal image (5 mm reconstruction). (C) The tumor was removed by bilobectomy and a gross specimen shows the well-defined lung mass and enlarged ipsilateral interlobar LN. On histopathologic analysis, the (D) cells infiltrating the mass are the same as the (E) cells infiltrating the enlarged LN. It indicates that the case with malignant PSP also had LN metastasis (hematoxylin–eosin stain; original magnification, ×200 and ×100, respectively). CT = computed tomography, LN = lymph node, PSP = pulmonary sclerosing pneumocytoma.
FIGURE 4.
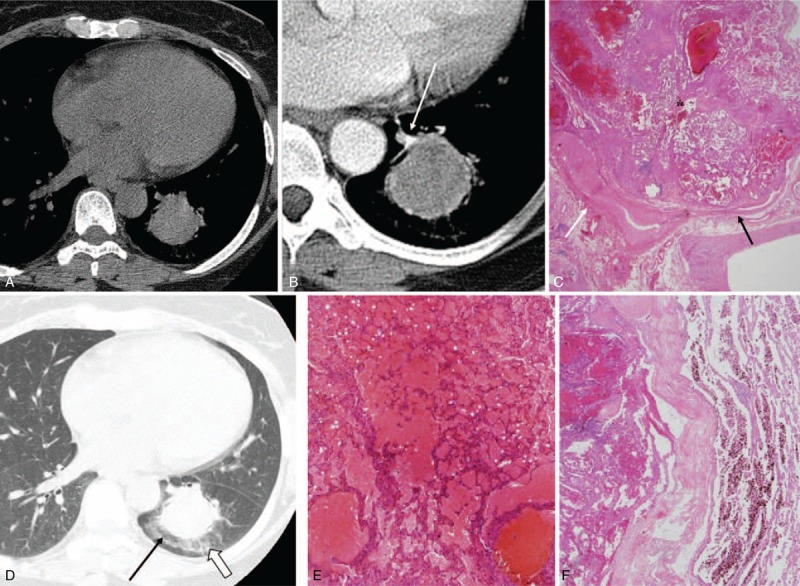
CT images and the corresponding histopathologic sections obtained in a 53-y-old woman with PSP in the left lower lobe. It was misdiagnosed as lung cancer in the first impression of preoperative CT reading. (A)–(C) Preaxial (A) and contrast-enhanced (B) axial CT images (5 mm reconstruction) show obviously enhanced, curve-like shadow (B, white arrow) observed at the enhanced edges extending toward the hilum of the lung and continuation, that is, “overlying vessel sign,” and the lesion is correlated with the area of surrounding engorged vessel (C, white arrow). A “marginal pseudocapsule sign” is observed in (B) and it is correlated with the area of compressed normal lung parenchyma (C, black arrow) by the mass (C, asterisk) (hematoxylin–eosin stain; ×12.5). (D)–(F) The axial high-resolution CT images with lung window setting (1 mm reconstruction, D) shows the mass (35 mm) with surrounding ground-glass opacity (D, open arrow), that is, “halo sign” (correlated with surrounding hemorrhage, E) (hematoxylin–eosin stain; original magnification, ×100) and with an intervening radiolucent portion, that is, “air crescent sign” (D, black arrow). The lesion is correlated with the area of the surrounding, air-gap-like lesion (F) (hematoxylin–eosin stain; original magnification, ×12.5). CT = computed tomography, PSP = pulmonary sclerosing pneumocytoma.
FIGURE 5.
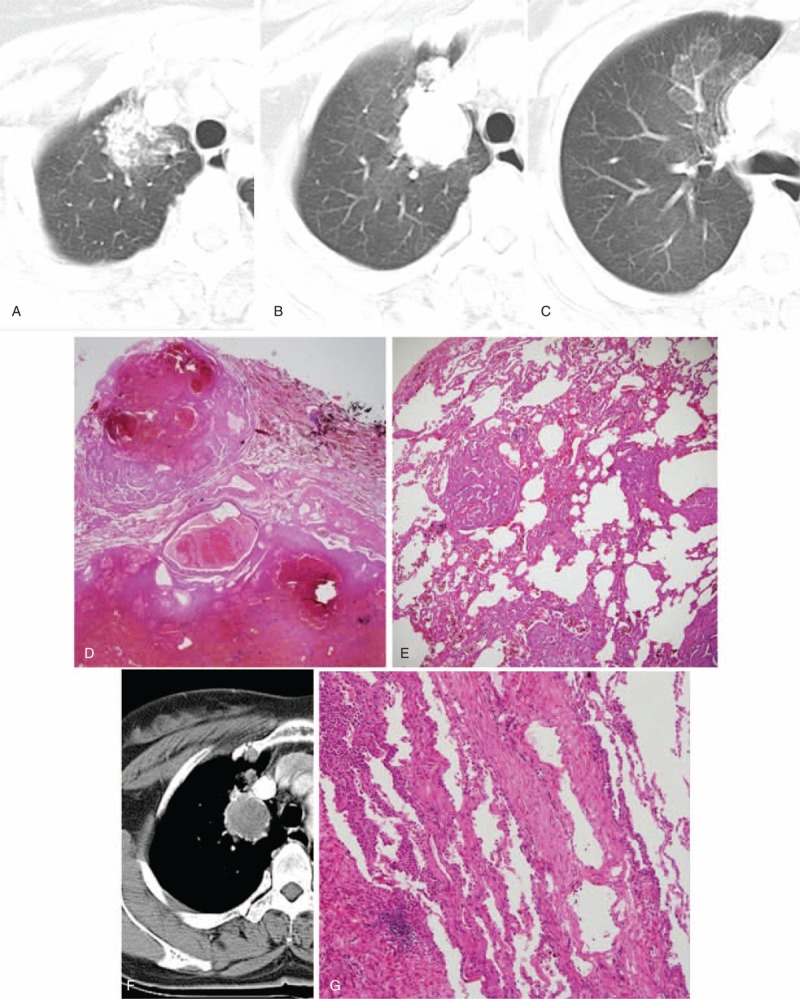
CT images and the corresponding histopathologic sections obtained in a 54-y-old woman with PSP in the RUL. It was misdiagnosed as pulmonary tuberculosis in the first impression of preoperative CT reading. (A)–(E) Serial axial CT images (5 mm reconstruction) (A–C) show the nodule (29 mm) in the RUL with surrounding ground-glass opacity, that is, “Halo sign,” and multiple, daughter nodules. The lesion is correlated with the daughter nodules and the surrounding area of hemorrhage (D and E) (hematoxylin–eosin stain; ×12.5 and ×40, respectively). (F) and (G) The contrast-enhanced axial CT image (5 mm reconstruction) (F) shows the mass with isodense compared with chest muscle. Obvious rim enhancement is observed at the edge of the mass (F), that is, “marginal pseudocapsule sign” and the lesion is correlated with the area of surrounding, compressed, normal lung parenchyma (G) (hematoxylin–eosin stain; ×100). CT = computed tomography, PSP = pulmonary sclerosing pneumocytoma, RUL = right upper lobe.
FIGURE 6.
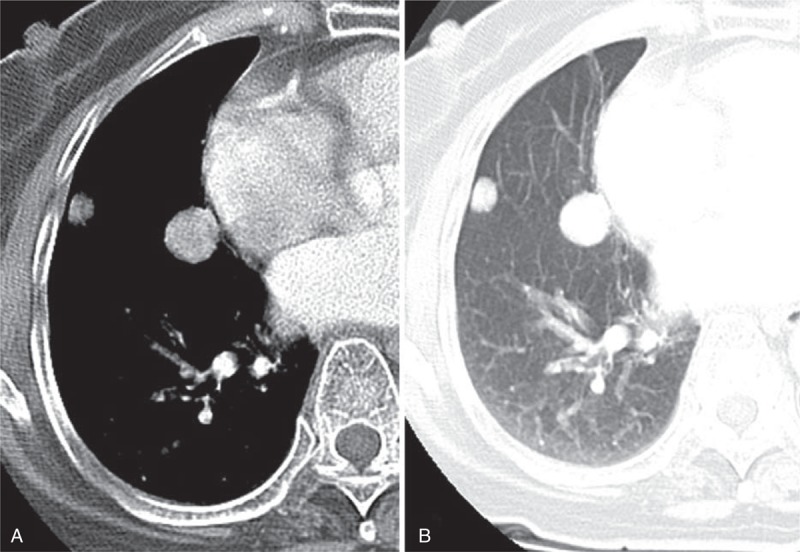
CT image obtained in an 84-y-old woman with 2 PSPs in the right middle lobe. It was misdiagnosed as metastatic lung nodules in the first impression of preoperative CT reading, despite of the patient not having an underlying malignancy. (A) and (B) The contrast-enhanced axial images (5 mm reconstruction) with mediastinal (A) and lung (B) window settings show 2 nodules (arrows) <30 mm in sizes and they are located in the juxta-pleural/fissural area. The larger one was evaluated to characterize and it shows round shape with smooth boundary, and hyperattenuation compared with muscle. Each 2 nodules finally diagnosed as PSPs by CT-guided biopsy. CT = computed tomography, PSP = pulmonary sclerosing pneumocytoma.
Most lesions had a smooth boundary (n = 50, 65.8%) (Figure 6) and were oval (n = 50, 65.8%) or round (n = 20, 26.3%) in shape (Figure 6). There was outer GGO in 16 patients (21.1%) (Figures 4 and 5). Fourteen patients (18.4%) had small and nodular calcifications. PSPs were commonly located in both lower lobes (n = 42, 55.3%). The axial lesion location was juxta-pleural or juxta-fissural in 34 patients (44.7%) (Figure 6) and was enveloped by lung parenchyma in 42 cases (55.3%) (Figure 4) (Table 4).
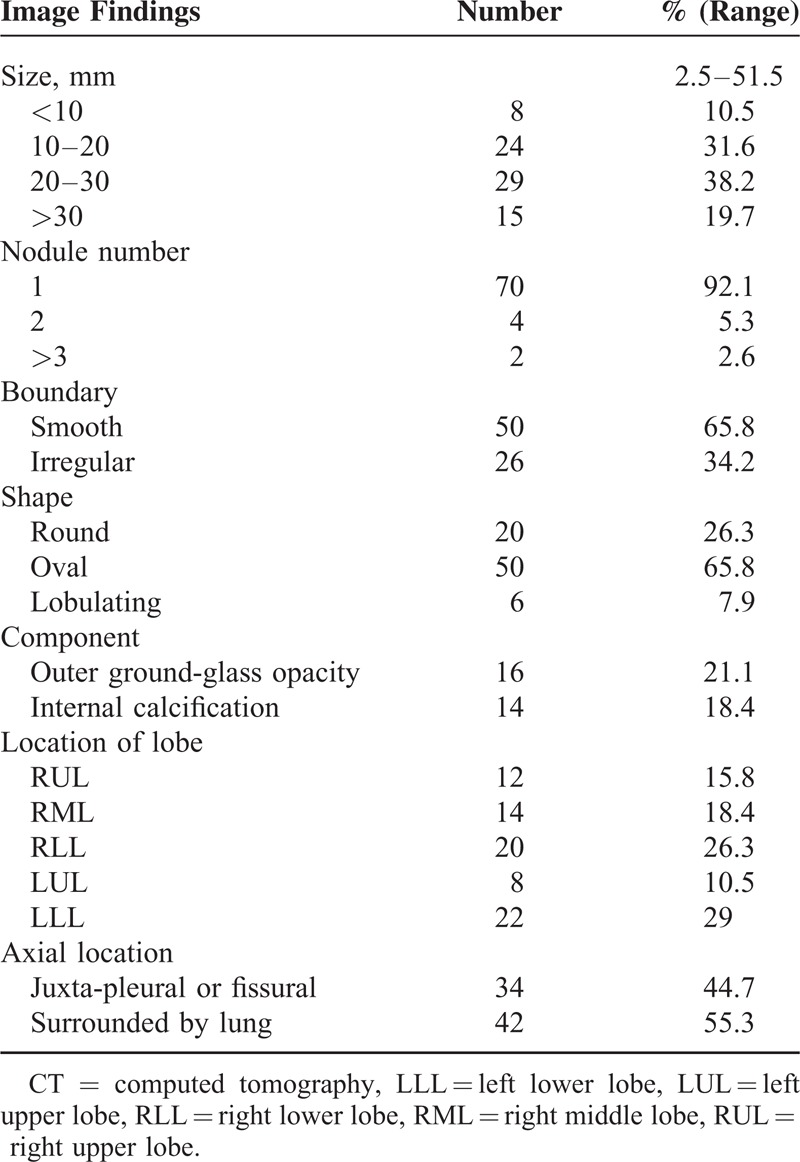
TABLE 4.
CT Findings of Pulmonary Sclerosing Pneumocytoma
The CT signs included marginal pseudocapsule (50%), overlying vessel (26.3%), air gap (2.6%), and halo sign (17.1%) (Table 5). The most common CT sign was the marginal pseudocapsule sign (n = 38, 50.0%) (Figures 4 and 5) followed by the overlying vessel sign (n = 20, 26.3%) (Figure 4), the halo sign (n = 13, 17.1%) (Figure 4), and the air-gap sign (n = 2, 2.6%) (Figures 1C and 4). Mixture of >2 CT signs (7 patients showed both the marginal pseudocapsule and overlying vessel signs, and 1 patient, Figure 4, showed all 4 signs) in a patient was found in 8 cases (10.5%).
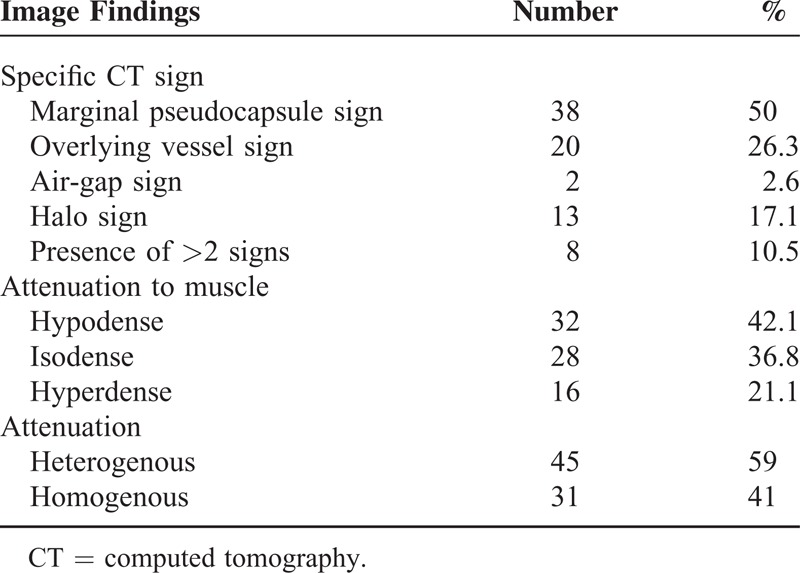
TABLE 5.
Some CT Signs and Enhancing Characteristics of Pulmonary Sclerosing Pneumocytoma
The mean CT attenuation of the lesion of 76 patients was measured as 76 ± 47.1 (range, 0–150.3) HU. Relative attenuations compared to the chest wall muscle were hypodense (n = 32, 42.1%), isodense (n = 28, 36.8%), and hyperdense (n = 16, 21.1%). Heterogeneous attenuation (n = 45, 59.0%) was more common than homogeneous attenuation (n = 31, 41.0%) on enhanced CT (Table 5). There was a lymph-node involvement in 1 patient (1.3%) (Figure 3).
Correct diagnosis as the first impression at the preoperative CT reading before tissue confirmation occurred in only 23 patients (30.3%). Primary lung cancer (n = 16, 21.1%) and metastasis (n = 12, 15.8%) were the most radiologic misdiagnoses, followed by hamartoma (n = 11, 14.5%).
FDG PET Evaluation
FDG PET showed that the median value of the maxSUV was 1.8 (range, normal tissue uptake; near 0 or normal tissue metabolism ∼2.9), and revealed a hypometabolic lesion in 17 lesions (<2.5maxSUV). The mean size of these lesions was 18.9 mm (range, 2.5–38.5 mm).
Histopathological Analysis
The solid predominant pattern (n = 24, 31.6%) was the most predominant type of PSP followed by the papillary predominant (n = 16, 21.1%), the hemangiomatous predominant (n = 16, 21.1%), and the sclerotic predominant (n = 12, 15.7%) for subtyping in the available 68 patients (89.5%). In 2 patients, we could not determine the dominant pattern because of the small size of the sample. In addition, there was no sample in the other 6 patients at the time of the review of the dominant pattern because of the discard policy of the hospital in cases of old samples and the possibility of a patient taking back the sample.
Statistical Analysis
By using paired t test, there was no significant difference between the 2 groups (the group presenting hemoptysis vs the group without hemoptysis) for clinical parameters such as gender, age, and CT parameters such as attenuation, number, size, lymph node (LN) involvement, calcification, shape, boundary, axial location, and FDG PET uptake. However, all PSP patients presenting hemoptysis showed internal or adjacent pulmonary vascular structures on CT.
DISCUSSION
Histologically, PSP is composed of 4 major components that vary in their proportions and it is associated with a process of migration from the hemorrhagic area to the papillary, solid, and sclerotic areas.7,16
PSP usually manifests as an isolated pulmonary nodule1,2,17 and is, therefore, often confused with other benign nodules and parts of malignant tumors. In our practice, correct diagnosis on the formal radiologic report of the conventional enhanced chest CT is possible in only 30.3% of 76 patients despite tertiary hospital. Primary lung cancer (21.1%) and metastasis (15.8%) for patients with an underlying malignancy are common radiological misdiagnoses. Hamartoma (14.5%) is the third most common radiological misdiagnosis, although it was most commonly misdiagnosed as a benign tumor.
In a study of PSPs using dynamic CT,7 the lesions with strong enhancement seen on early enhanced images correlated with the area of the hemangiomatous component on histopathologic analysis and papillary (50%) and hemangiomatous (40%) are the most common predominant patterns. However, our study showed that the most common predominant pattern is solid (31.6%), followed by hemangiomatous (21.1%) and papillary (21.1%) pattern.
The mean attenuation (76 HU) of lesions is lower than those of previous study11 and it is more frequently found as hypodense (42.1%) or isodense (36.8%) nodules rather than hyperdense (21.1%). We think that these differences might be attributable to the different conditions of the patient population as well as the use of different imaging and enhancement protocols including image acquisition time after contrast media injection. However, many hospitals do not examine the dynamic CT study for solitary pulmonary nodules except in some patients with special needs and there is a problem of high level of radiation exposure during additional dynamic CT. In our study, there is no obvious correlation between the attenuation of PSP and the dominant histopathologic pattern. So, we believe that using morphologic clues is more practical and applicable rather than the pattern of attenuation or enhancement in clinical practice.
In our study, in the 61 patients with nodules and 15 patients with masses, the frequencies do not differ from that seen in other studies.3,7,9 Most patients (92.1%) manifest with a single lesion and 7.9% of the cases manifest with >2 lesions. The classical pattern of a PSP presenting as a nonspecific solitary pulmonary nodule is found in two thirds.
In our study, most nodules are round to oval in shape with a smooth boundary. However, one-third nodules have an irregular boundary or one-fifth nodules have outer GGO these can be misdiagnosed as lung cancer, especially when the lesions are >3 cm, those were correlated with the tumor infiltration and the area of hemorrhage on histopathologic analysis, respectively. The axial location of the tumors is juxta-pleural or juxta-fissural in 44.7% of patients and enveloped by the lungs in 55.3% of patients, and this result is different from previous study that juxta-pleural location is more common.10
In particular, when there is an underlying malignancy (21.1%), it is quite challenging to make a differential diagnosis or select nodules for tissue confirmation when multiple lung nodules are seen on chest CT.
We want to emphasize several CT signs of PSP by focusing on the tumor boundary.
The marginal pseudocapsule sign (50%) is correlated focal compressed parenchyma next to tumor, which is the most common sign.
The overlying vessel sign (26.3%) is correlated with small a feeder or drainer adjacent the tumor and sometimes displaced by the mass effect. In our study, 6 patients with hemoptysis show internal or adjacent pulmonary vascular structures on CT.
The air-gap sign (2.6%) is caused by the proliferation and hyaline change of the undifferentiated alveolar mesenchymal cells surrounding the bronchus, causing the expansion of the far-end air gap. Nam et al18 suggested that the air-trapping zone around PSP is possibly because of the peritumoral hemorrhage followed by clearance through air space and finally forms the peritumoral air space and patients manifested hemoptysis. However, in our study, there is no patient presenting hemoptysis among lesions with the air-gap sign.
Rarely, the halo sign (17.1%) is caused by the shrinkage at different speeds of the coating membrane and the tumors, causing bleeding via the gas channel, in turn potentially causing GGOs.18 Therefore, such a surrounding GGO could be an important indicator of PSP among benign tumors, indicating that lepidic growth of the tumor results from not having a capsule.
To date, the known CT imaging findings diagnostic for PSP are quite nonspecific. We think that the CT findings concerning the tumor boundary such as 4 CT signs could be helpful for suggesting PSP, especially in middle-aged women with nonspecific lung nodules and no symptoms or mild hemoptysis.
There has been debate about the factors related with symptoms including hemoptysis.3,19,20 In our study, only 6 patients presenting hemoptysis do not show statistically significant difference for the clinical and CT parameters with patients those do not have hemoptysis. There is only a case of malignant PSP with LN metastasis and it shows a heterogeneously enhancing lobulated mass, slowly growing over 2 years.
There are 16 patients of underlying malignancy who underwent FDG PET for metastasis evaluation. In cases of underlying malignancy, incidental pulmonary nodules can easily be confused with lung metastases. The question of which nodules should be selected for tissue confirmation is also a common dilemma. FDG PET findings can help to solve this problem. In our study, the 17 patients who underwent FDG PET show a hypo or intermediate metabolic lesion. Despite in a recent exceptional case report,21 they reported a case of bilateral multiple PSP with high FDG PET uptake. They explained the reason of hypermetabolic lesions by possibility of active cell proliferation or more cellularity of lesions. However, in majority of case reports previously reported, PSP has been shown to have similar results of with ours hypo or intermediate uptake.13–15 It is helpful to differentiate it from other lung cancers or metastasis that usually showing high FDG uptake on PET.
To date, except in a few case that cannot exclude a malignancy, limited resection is preferable surgery technique to decrease both hospital stay and complication if accurate diagnosis before surgery could be done.22 Herein, 12 patients underwent wider resection (lobectomy or bilobectomy) to rule out the possibility of malignancy after percutaneous core-needle biopsy. Most of these patients underwent limited resection, and all cases, including those with recurrence or malignant features, achieved an excellent clinical outcome. Only one patient has lymph-node involvement and also another patient has recurrent PSP after resection (Figure 7).
FIGURE 7.
CT images and the corresponding histopathologic sections obtained in a 37-y-old woman with PSP in the left lower lobe and with recurrence after segmentectomy. It was misdiagnosed as lung cancer in the initial radiological report. (A) The enhanced CT transverse image (5 mm reconstruction) shows a lobulated nodule (15 mm) in the left lower lobe with a heterogeneous texture. (B) and (C) One year after the segmentectomy (B), recurrent tumor is shown abutting the surgical suture material and 3 y later after scan B (C), as the nodule showed slow growth, a rebiopsy was performed and finally confirmed as a PSP. (D)–(F) Segmentectomy was performed and the pathologic images shows not only an area of atypical cells (shown in F) but also an area of the solid (D) and papillary (E) components (hematoxylin–eosin stain; original magnification, ×200). CT = computed tomography, PSP = pulmonary sclerosing pneumocytoma.
Our study had several limitations. First, it was a retrospective study performed at a single, tertiary referral center. Second, the diversity of the CT findings prevented the categorization of thoracic abnormalities. Third, histopathologic diagnosis was performed by percutaneous core-needle biopsy in 32 patients with tumors who were undergoing clinical observation. In such patients, core-needle biopsy might not have been sufficiently representative of the tumors, especially for evaluation of pathologic pattern. Fourth, morphologic evaluation by CT can be subjective. Finally, the number of FDG PET studies performed was relatively small.
However, the strengths of this study include the large number of cases in a single ethnic group, and the detailed descriptions of the CT features, with a focus on the specific outer morphology of the tumor. In addition, 2 experienced chest radiologists analyzed the CT features and 2 pathologists correlated the pathology. We also clarified the FDG PET findings. Confirming the presence of any underlying intrathoracic or extrathoracic malignancy using both chest CT and FDG PET, together with observation by core biopsy or (limited) pulmonary resection, is necessary for such a rare benign tumor. Through further histopathological analysis, it could be interesting to study the correlations between CT, PET findings, and pathological characteristics, particularly KI-67 staining. It would be of great value if there is a correlation between proliferation and glucose metabolism.
In conclusion, PSP should be considered in middle-aged women whose CT features show incidental nodule(s), commonly with surrounding GGO and characteristic CT signs of the tumor boundary, and hypometabolic uptake on FDG PET. Outcome of patients is excellent.
Footnotes
Abbreviations: CT = computed tomography, FDG PET = 18F-fluorodeoxyglucose positron emission tomography, GGO = ground-glass opacity, LN = lymph node, MaxSUV = maximum standardized uptake value, PSP = pulmonary sclerosing pneumocytoma.
The authors have no funding and conflicts of interest to disclose.
REFERENCES
- 1.Cheung YC, Ng SH, Chang JWC, et al. Histopathological and CT features of pulmonary sclerosing haemangiomas. Clin Radiol 2003; 58:630–635. [DOI] [PubMed] [Google Scholar]
- 2.Iyoda A, Hiroshima K, Shiba M, et al. Clinicopathological analysis of pulmonary sclerosing hemangioma. Ann Thorac Surg 2004; 78:1928–1931. [DOI] [PubMed] [Google Scholar]
- 3.Sugio K, Yokoyama H, Kaneko S, et al. Sclerosing hemangioma of the lung: radiographic and pathological study. Ann Thorac Surg 1992; 53:295–300. [DOI] [PubMed] [Google Scholar]
- 4.Haimoto H, Tsutsumi Y, Nagura H, et al. Immunohistochemical study of so-called sclerosing haemangioma of the lung. Vichows Arch A Pathol Anat 1985; 407:419–430. [DOI] [PubMed] [Google Scholar]
- 5.Devouassoux-Shisheboran M, Hayashi T, Linnoila RI, et al. A clinicopathologic study of 100 cases of pulmonary sclerosing hemangioma with immunohistochemical studies: TTF-1 is expressed in both round and surface cells, suggesting an origin from primitive respiratory epithelium. Am J Surg Pathol 2000; 24:906–916. [DOI] [PubMed] [Google Scholar]
- 6.Keylock CPTJB, Galvin JR, Franks TJ. Sclerosing hemangioma of the lung. Arch Pathol Lab Med 2009; 133:820–825. [DOI] [PubMed] [Google Scholar]
- 7.Chung MJ LK, Han J, Sung YM, et al. Pulmonary sclerosing hemangioma presenting as solitary pulmonary nodule: dynamic ct findings and histopathologic comparisons. Am J Roentgenol 2006; 187:430–437. [DOI] [PubMed] [Google Scholar]
- 8.Im JG, Kim WH, Han MC, et al. Sclerosing hemangiomas of the lung and interlobar fissures: CT findings. J Comp Assist Tomogr 1994; 18:34–38. [DOI] [PubMed] [Google Scholar]
- 9.Lin H, Yao H, Peng F. CT image morphology features of pulmonary sclerosing hemangiomas. Chin Ger J Clin Oncol 2011; 10:19–23. [Google Scholar]
- 10.Wang QB, Chen YQ, Shen JJ, et al. Sixteen cases of pulmonary sclerosing haemangioma: CT findings are not definitive for preoperative diagnosis. Clin Radiol 2011; 66:708–714. [DOI] [PubMed] [Google Scholar]
- 11.Xie RM, Zhou XH, Lu PX, et al. Diagnosis of pulmonary sclerosing hemangioma with incremental dynamic CT: analysis of 20 cases. Chin J Tuberculosis Respir Dis 2003; 26:7–9. [PubMed] [Google Scholar]
- 12.Liu W, Tian XY, Li Y, et al. Coexistence of pulmonary sclerosing hemangioma and primary adenocarcinoma in the same nodule of lung. Diagn Pathol 2011; 6:41–46. [DOI] [PMC free article] [PubMed] [Google Scholar]
- 13.Hara M, Iida A, Tohyama J, et al. FDG-PET findings in sclerosing hemangioma of the lung: a case report. Rad Med 2001; 19:215–218. [PubMed] [Google Scholar]
- 14.Timpone V, Danielson D, Woods A, et al. FDG–PET imaging findings of a pulmonary sclerosing hemangioma. Eur J Radiol Extra 2011; 79:e65–e67. [Google Scholar]
- 15.Chen Q, Wu LJ, Hu H, et al. A case of pulmonary sclerosing hemangioma with low (18)FDG uptake in PET. Oncol Lett 2012; 3:646–648. [DOI] [PMC free article] [PubMed] [Google Scholar]
- 16.Yan W, Wang E, WU G, et al. Immunohistochemical and ultrastructural study of so-called sclerosing hemangioma of the lung suggests different origins of cells. Chin J Lung Cancer 2003; 6:89–93. [DOI] [PubMed] [Google Scholar]
- 17.Hanaoka J, Ohuchi M, Inoue S, et al. Bilateral multiple pulmonary sclerosing hemangioma. Jpn J Thorac Caridovasc Surg 2005; 53:157–161. [DOI] [PubMed] [Google Scholar]
- 18.Nam JE, Ryu YH, Cho SH, et al. Air-trapping zone surrounding sclerosing hemangioma of the lung. J Comp Assist Tomogr 2002; 26:358–361. [DOI] [PubMed] [Google Scholar]
- 19.Kalhor N, Staerkel GA, Moran CA. So-called sclerosing hemangioma of lung: current concept. Ann Diagn Pathol 2010; 14:60–67. [DOI] [PubMed] [Google Scholar]
- 20.Jungraithmayr W, Eggeling S, Ludwig C, et al. Sclerosing hemangioma of the lung: a benign tumour with potential for malignancy? Ann Thorac Cardiovasc Surg 2006; 12:352–354. [PubMed] [Google Scholar]
- 21.Kamaleshwaran KK, Rajan F, Mehta S, et al. Multiple pulmonary sclerosing hemangiomas (pneumocytoma) mimicking lung metastasis detected in fluorine-18 fluorodeoxyglucose positron emission tomography/computed tomography. Ind J Nuclear Med 2014; 29:168–170. [DOI] [PMC free article] [PubMed] [Google Scholar]
- 22.Park JS, Kim K, Shin S, et al. Surgery for pulmonary sclerosing hemangioma: lobectomy versus limited resection. Korean J Thorac Cardiovasc Surg 2011; 44:39–43. [DOI] [PMC free article] [PubMed] [Google Scholar]