Abstract
Hepatocellular carcinoma (HCC) patients with performance status (PS) 1 or 2 are considered similar in the Barcelona Clinic Liver Cancer (BCLC) system. The rationales are not fully studied.
A total of 693 and 335 HCC patients were classified as PS 1 and 2, respectively, in a prospectively followed up database. One-to-one matched pairs between HCC patients were generated by using the propensity score with matching model. Survival analysis was performed and the hazard ratio was calculated with the Cox proportional hazards model.
Patients with PS 1 were significantly younger and had better liver and renal functions compared with patients with PS 2 (all P < 0.05). Patients with PS 1 had earlier BCLC stages and higher chances to undergo curative treatments (both P < 0.05). After matching, patients with PS 1 or 2 had similar age, gender, liver diseases, severity of cirrhosis, tumor burden, and treatments (all P > 0.05); patients with PS 1 had significantly better prognosis compared with patients with PS 2 (P < 0.05). There were 68% of patients with PS 1 that underwent aggressive treatments (resection, transplantation, percutaneous ablation, or transarterial chemoembolization), which were significantly correlated to better outcome with a hazard ratio of 0.539 in the matching model (P = 0.002). For patients with PS 2, aggressive treatments were not significantly associated with better long-term survival.
Aggressive treatments provide survival benefits for patients with PS 1, but not for patients with PS 2. HCC patients with PS 1 or 2 should be considered clinically different disease entities in the BCLC system.
INTRODUCTION
Hepatocellular carcinoma (HCC) is one of the most common malignant neoplasms worldwide. Surgical resection, liver transplantation, and percutaneous ablation are suggested as curative treatments in an attempt to achieve complete remission.1,2 Transarterial chemoembolization (TACE), targeted/chemotherapy, or best supportive care are recommended for patients with more advanced HCC accordingly by the Barcelona Clinic Liver Cancer (BCLC) system to improve long-term survival and quality of life.3,4
The BCLC classification provides treatment algorithm for HCC according to patients’ performance status (PS), severity of liver cirrhosis, and tumor burden.5,6 Patients with PS 1 are defined as symptomatic individuals who can move around freely, whereas PS 2 describes symptomatic patients with less than 50% of time limited in bed during the day.7 In the BCLC system, HCC patients having Child–Turcotte–Pugh (CTP) class A or B and PS 1 or 2 were categorized in the advanced stage (stage C). However, the rationales to allocate HCC patients with PS 1 or 2 in the same staging category are not clear, and the differences between these 2 groups of patients are rarely studied.
Alternatively, in the BCLC system, sorafenib is suggested as the treatment of choice for patients with advanced HCC.6 For patients with PS 1 or 2, aggressive anti-HCC treatments including surgical resection, liver transplantation, percutaneous ablation, and TACE are not suggested because of limited survival benefit and increased risk of complications. However, according to the design of BCLC system, patients with PS 1 or 2 categorized as BCLC class C could have treatable tumor burden; their chances to receive aggressive anticancer treatments should not be completely eliminated. For patients with PS 1 or 2, the survival benefits of aggressive therapies are not clear; the feasibility of customized treatment strategies focusing on patients with different PS remains undetermined.
In this study, we have investigated the presentations of HCC patients with PS 1 and 2, and compared the long-term outcome between patients with different PS. We used propensity score analysis in a matching model and have reassessed the long-term prognosis after removing possible confounders and calculated the adjusted hazard ratio (HR) of poor PS. In addition, we used matching models to examine different treatment strategies in patients with PS 1 or 2 separately in order to elaborate the role of aggressive anticancer treatments.
PATIENTS AND METHODS
Patients
A prospective cohort of HCC patients in a 12-year period from 2002 to 2014 at Taipei Veterans General Hospital was reviewed, and a total of 3121 treatment-naive primary HCC patients were identified in this study. The baseline features, including gender, age, cause and severity of chronic liver disease, tumor extent, serum biochemical data, PS, and cancer stages, were recorded at the time of diagnosis. Part of the patient profiles had been described in our previous studies.8,9 This study complies with current ethical guidelines and is approved by the ethics committee. Waiver of consent was obtained from every patient, and patient records/information was anonymized and deidentified prior to analysis.
Diagnosis and Definitions
The diagnosis of HCC was made based on the findings of radiological characteristics in at least 2 imaging methods including ultrasound, liver angiography, magnetic resonance imaging, and contrast-enhanced four-phase dynamic computed tomography. Alternatively, the diagnosis was confirmed by 1 positive imaging modality along with serum α-fetoprotein (AFP) level > 400 ng/mL or biopsy confirmed as previously described.1,8,10,11 Patients were considered to have hepatitis C virus (HCV) infection if they were seropositive for antibody against HCV (anti-HCV, Abbott Laboratories). Hepatitis B virus (HBV) infection was diagnosed if patients were seropositive for hepatitis B surface antigen (HBsAg) (Abbott Laboratories). Alcoholism was diagnosed in patients with daily consumption of at least 40 g of alcohol for 5 years or more.10,11 PS was determined at enrollment defined by to the Eastern Cooperative Oncology Group.12 The modification of diet in renal disease formula was used to calculate estimated glomerular filtration rate (eGFR). We estimated total tumor volume by using mathematical formulas as indicated in our previous studies.13
Treatment
A total of 6 treatment strategies were recorded in this study. Surgical resection, transplantation, percutaneous ablation (acetic or ethanol acid injection and radiofrequency ablation), and TACE were collectively classified as aggressive treatments. Targeted/chemotherapy and best supportive care were defined as nonaggressive treatments.
Propensity Score Analysis
The propensity score was generated by using a logistic regression, which calculated the possibility of each patient to be PS 1 or 2. The clinical variables that may be associated with the survival, including age, sex, tumor burden, severity of cirrhosis, vascular invasion, kidney function, serum AFP level, diabetes mellitus, and treatment strategies, were used for generating propensity scores. To compare the independent association between experimental variable (PS) and response (survival), one-to-one pairs were selected by using the propensity score and greedy algorithm to reduce selection bias in survival analysis.14,15 Similarly, for patients receiving different treatment strategies, the propensity score with matching model was used to balance the baseline characteristics before the survival distributions were reassessed.
Statistics
Mann–Whitney ranked sum test was used for continuous data, and Chi-squared test was applied for categorical data. The survivals were calculated by using the Kaplan–Meier method and compared with a log-rank test. The Cox proportional hazards model was employed to adjust the final HR. A statistical significance was reached when the P value was less than 0.05 (SAS institute, NC).10
Results Characteristics and Overall Survival in Patients With PS 1 and 2
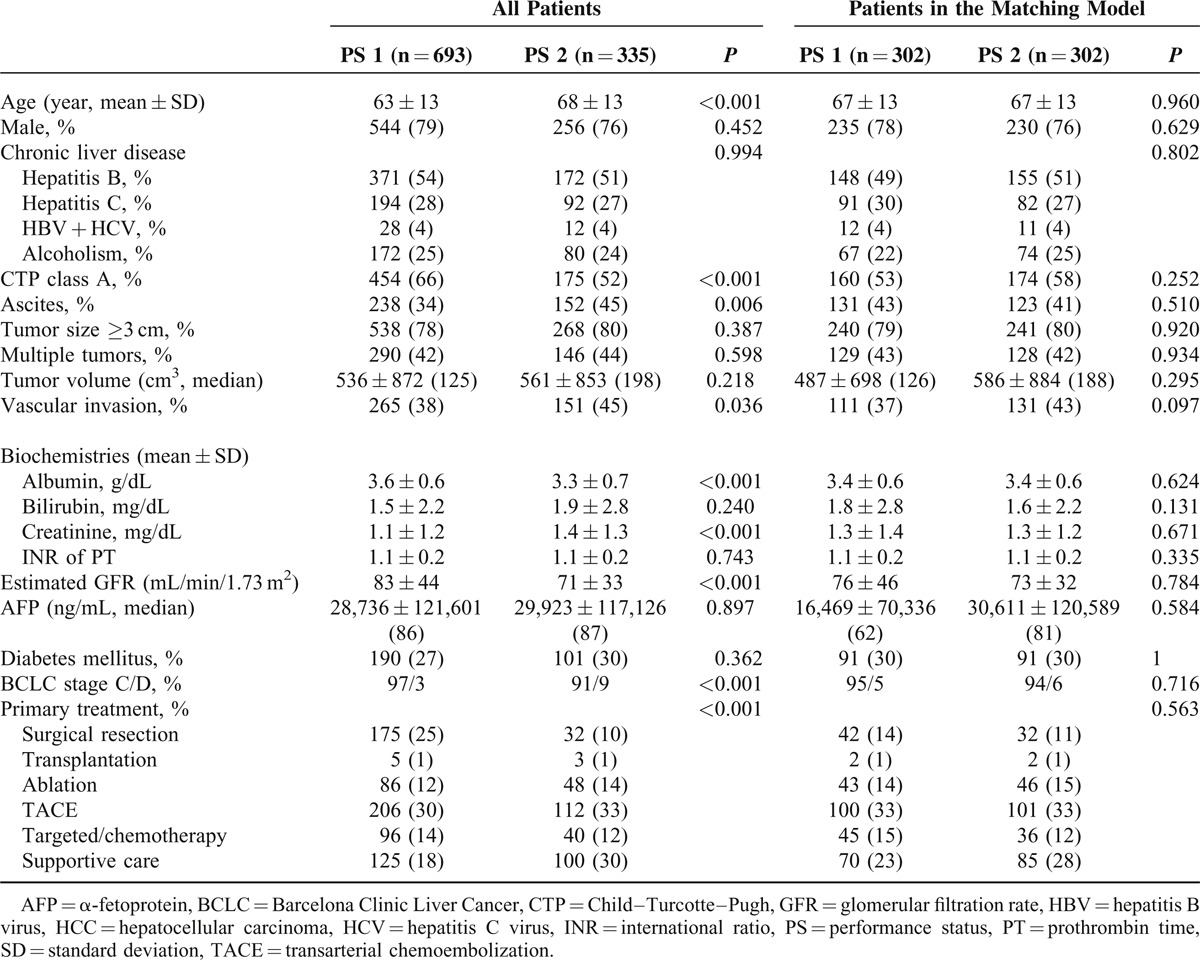
A total of 693 (22%) and 335 (11%) patients were classified as PS 1 and 2, respectively (Table 1). Patients with PS 1 were significantly younger, and more likely to have better liver and kidney function in comparison with patients with PS 2 (all P < 0.001). Patients with PS 1 less often had ascites, vascular invasion, and hypoalbuminemia (all P < 0.001). Patients with PS 1 or 2 had similar etiologies of chronic liver disease, tumor burden (number, size, and total tumor volume), serum bilirubin and AFP levels, prothrombin time, and prevalence of diabetes mellitus (all P > 0.05). Compared to patients with PS 2, patients with PS 1 had earlier HCC stages and their chances to receive aggressive anticancer treatments were higher (both P < 0.05).
TABLE 1.
Comparison of Demographics Between all HCC Patients and Patients in Matching Model
The comparison of long-term survival between HCC patients with difference PS is shown in Figure 1A. During a mean follow-up period of 28 ± 30 months, patients with PS 1 had significantly better long-term survival than patients with PS 2 (P < 0.001).
FIGURE 1.
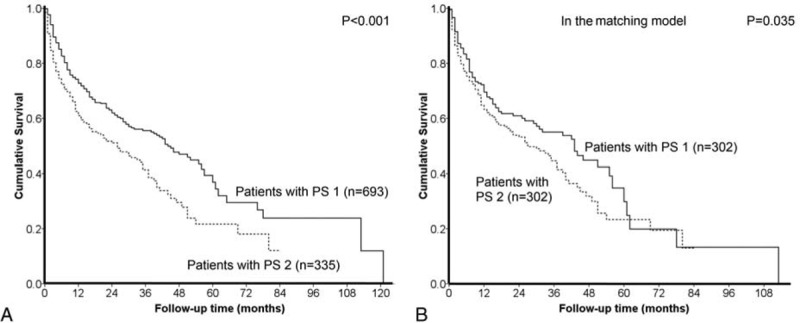
Crude comparison of the survival distributions between HCC patients with PS 1 and 2. Patients with PS 1 had significantly better prognosis (panel A, P < 0.001). In the propensity score model, after confounding effects were reduced, patients with PS 1 consistently had better long-term survival (panel B, P = 0.035).
Characteristics and Survival in Patients With PS 1 or 2 in the Propensity Score With Matching Model
With the propensity score and matching model, 302 pairs of matched HCC patients with PS 1 or 2 had similar distributions of age, gender, etiologies of liver disease, liver and kidney function, tumor burden, diabetes mellitus, HCC stages, and similar treatment strategies (Table 1).
The comparison of long-term survival between HCC patients with different PS in the matching model is given in Figure 1B. After confounding effects were reduced, patients with PS 1 had significantly better long-term survival than did patients with PS 2 (P = 0.035). With the Cox proportional hazards model, PS 2 was associated with an HR of 1.31 (95% confidence interval 1.014–1.693).
Comparison of Baseline Features Between Patients With PS 1 Receiving Aggressive Versus Nonaggressive Treatments
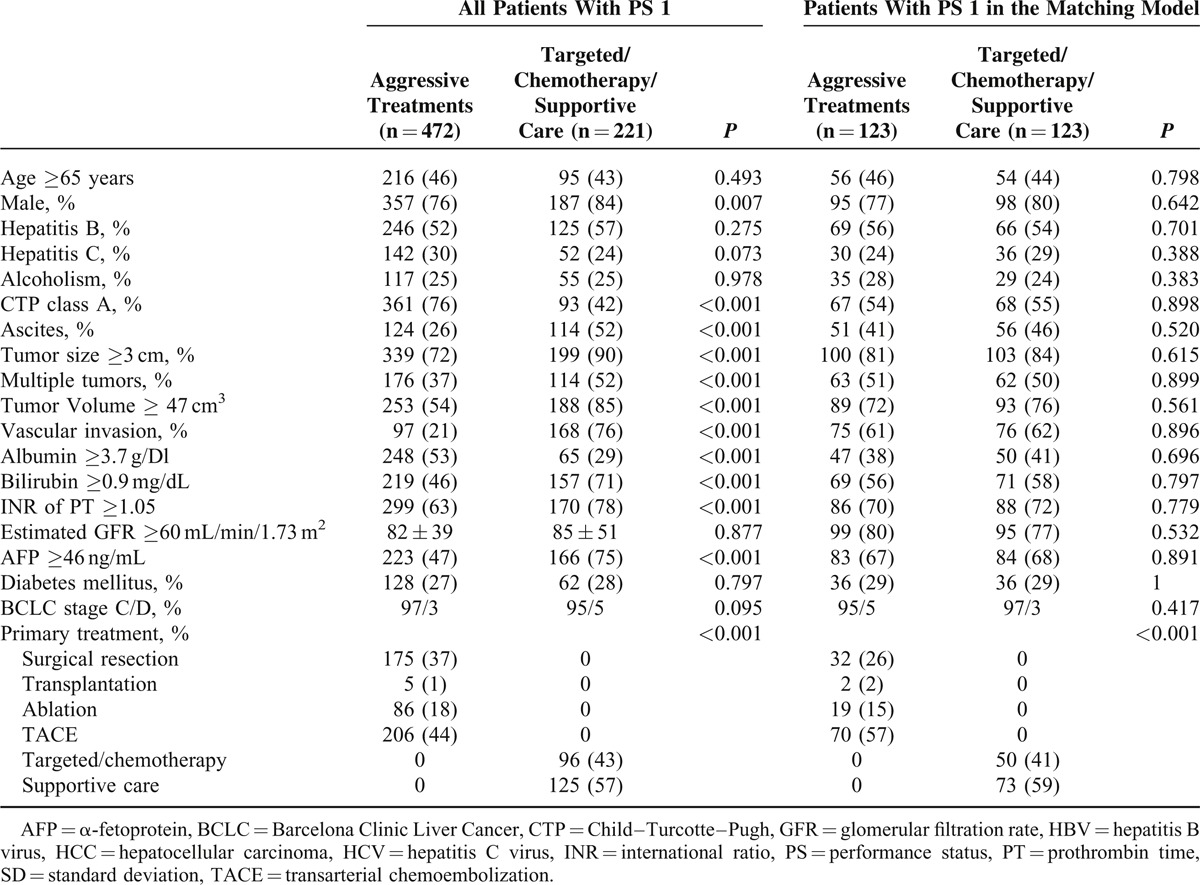
Among 693 HCC patients with PS 1, 472 (68%) patients received aggressive anticancer treatments as their primary management (Table 2). A total of 175, 5, 86, and 206 patients underwent surgical resection, transplantation, percutaneous ablation, and TACE, respectively. Of the remaining 221 patients, 96 and 125 patients received targeted/chemotherapy and best supportive care, respectively. Compared to patients undergoing targeted/chemotherapy or supportive care, patients undergoing aggressive treatments had better liver function, less ascites, smaller tumor burden, less vascular invasion, lower serum AFP level, and more often were female (all P < 0.05). There were no significant differences in age, etiologies of liver disease, kidney function, and prevalence of diabetes mellitus between patients receiving different treatments (all P > 0.05).
TABLE 2.
Comparison of Demographics Between all HCC Patients With PS 1, and Patients With PS 1 in the Matching Model Receiving Different Treatment Strategies
Comparison of Survival Between Patients With PS 1 Receiving Aggressive Versus Nonaggressive Treatments
The difference of long-term survival between PS 1 patients undergoing aggressive anti-HCC treatments and targeted/chemotherapy or supportive care is shown in Figure 2A. Patients with PS 1 who underwent aggressive anticancer treatments survived significantly longer after enrollment than patients receiving solely targeted/chemotherapy or supportive care (P < 0.001).
FIGURE 2.
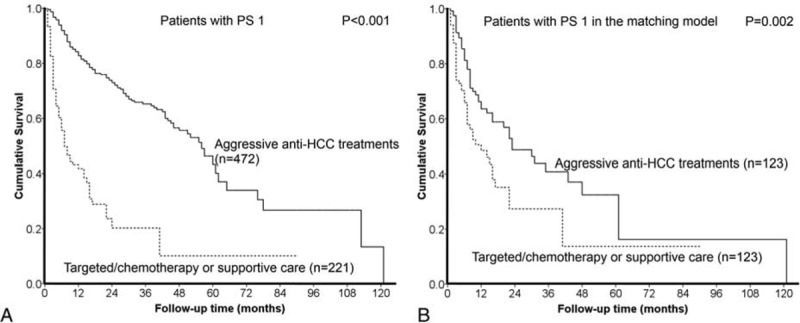
HCC patients with PS 1 undergoing aggressive anti-HCC treatments had better prognosis than patients with PS 1 choosing targeted/chemotherapy or supportive care (panel A, P < 0.001). After confounding effects were removed in the propensity score model, patients with PS 1 undergoing aggressive treatments still had significantly better prognosis (panel B, P = 0.002).
Characteristics of Patients With PS 1 Selected in the Propensity Score With Matching Model
A total of 123 pairs of matched HCC patients were identified in the propensity model (Table 2). Of these matched patients choosing different treatment strategies, no significant differences in age, gender, etiology and severity of liver disease, tumor extent, kidney function, AFP, ascites, prevalence of vascular invasion, and diabetes mellitus were found (all P > 0.05).
Comparison of Survival Between Patients With PS 1 Receiving Aggressive Versus Nonaggressive Treatments in the Propensity Score With Matching Model
Patients with PS 1 receiving aggressive anti-HCC treatments had better prognosis than patients receiving targeted/chemotherapy or supportive care in the propensity score with matching model (P = 0.002, Figure 2B). With the Cox proportional hazards model, the adjusted HR of aggressive treatments was 0.539 (95% confidence interval 0.361–0.805) in comparison with nonaggressive therapies.
Comparison of Baseline Features Between Patients With PS 2 Receiving Aggressive Versus Nonaggressive Treatments
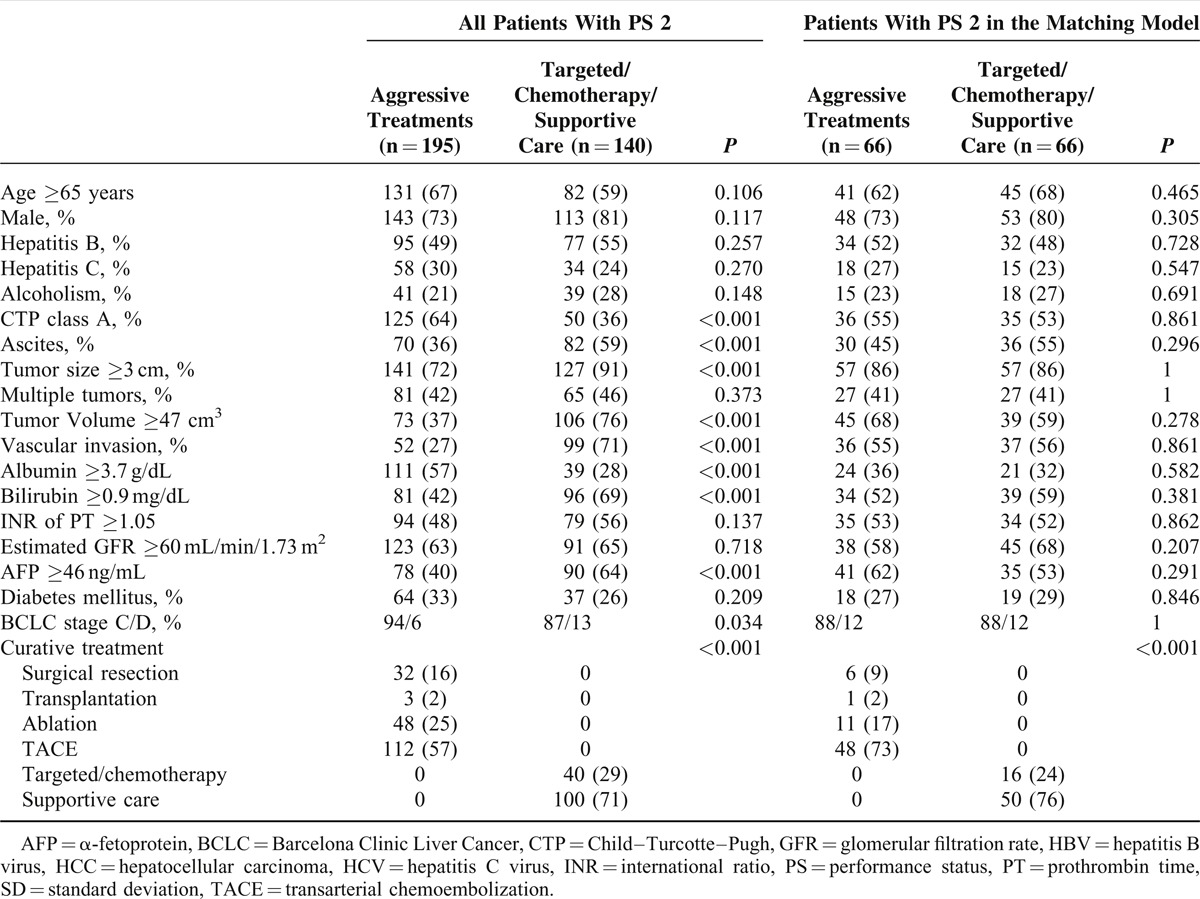
Among 335 HCC patients with PS 2, 195 (58%) patients received aggressive anti-HCC treatments (Table 3). A total of 32, 3, 48, and 112 patients underwent surgical resection, transplantation, percutaneous ablation, and TACE, respectively. Of the remaining 140 patients, 40 and 100 patients received targeted/chemotherapy and supportive care, respectively. Compared to patients receiving targeted/chemotherapy or supportive care, patients undergoing aggressive treatments had better liver function, less ascites, smaller tumor volume, less vascular invasion, and lower serum AFP level (all P < 0.05). Otherwise there were no significant differences in age, gender, etiologies of liver disease, tumor number, prothrombin time prolongation, kidney function, and prevalence of diabetes mellitus between patients receiving different treatments (all P > 0.05).
TABLE 3.
Comparison of Demographics Between all HCC Patients With PS 2 and Patients With PS 2 in the Matching Model Receiving Different Treatment Strategies
Comparison of Survival Between Patients With PS 2 Receiving Aggressive Versus Nonaggressive Treatments
The difference of long-term outcome between patients with PS 2 receiving aggressive anticancer treatments and targeted/chemotherapy or supportive care is shown in Figure 3A. PS 2 patients who underwent aggressive therapies had a significantly better survival than patients undergoing targeted/chemotherapy or supportive care (P < 0.001).
FIGURE 3.
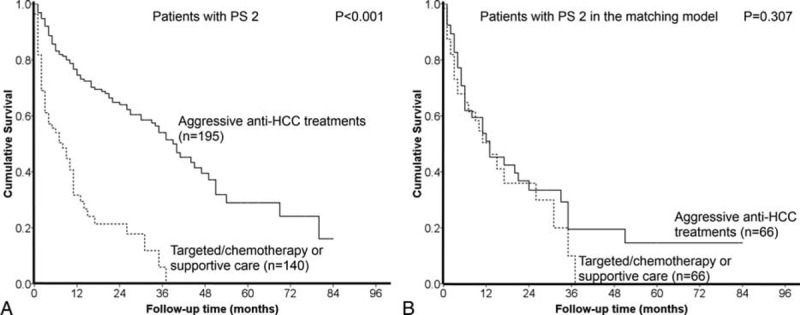
HCC patients with PS 2 undergoing aggressive anti-HCC treatments had better prognosis than patients with PS 2 undergoing targeted/chemotherapy or supportive care (panel A, P < 0.001). After confounding factors were balanced, there was no significant survival difference between patients with different treatments in the propensity score model (panel B, P = 0.307).
Characteristics of Patients With PS 2 Selected in the Propensity Score With Matching Model
In the propensity score-adjusted matching model, a total of 66 matched pairs of HCC patients were found (Table 3). Of the selected patients, there were no significant baseline differences in age, gender, etiology and severity of liver disease, tumor extent, kidney function, AFP level, ascites, vascular invasion, and diabetes mellitus (all P > 0.05).
Comparison of Survival Between Patients With PS 2 Receiving Aggressive Versus Nonaggressive Treatments in the Propensity Score With Matching Model
After all the potential confounders were adjusted in the propensity model, there was no significant survival difference between patients undergoing different treatment strategies (P = 0.307, Figure 3B).
DISCUSSION
PS is widely used to evaluate the general condition of patients with various malignancies. Notably, it has been included in the BCLC system for outcome prediction and treatment allocation for HCC. Recently, PS has been documented as an independent prognostic predictor for HCC patients,12 and it also helps to refine the treatment strategy.16 In this study, we used a large prospectively collected HCC cohort to study the differences between patients with PS 1 and 2 to clarify the underlying rationales of categorizing patient with PS 1 or 2 into the same HCC stage. The current study is the first one to evaluate the staging strategy for HCC patients with PS 1 or 2 in the BCLC system. Our results show that patients with PS 1 or 2 are fundamentally different in terms of age, severity of cirrhosis, prevalence of vascular invasion, and kidney function. Based on these findings, the design of the BCLC system, which considers patients with PS 1 or 2 as similar population, may need further modifications.
PS is considered a competent and comprehensive parameter to determine the degree of general condition in cancer patients. For HCC patients, the BCLC system, which exclusively includes PS as the surrogate of patients’ physical condition, has been recognized as the most accurate model by different research groups.17,18 In our study, HCC patients with PS 2 were older and had more advanced cirrhosis, more vascular invasion, and poorer kidney function compared with patients with PS 1. By using the propensity score with matching model to reduce the possible confounders, PS 2 was identified as an independent predictor of poor long-term prognosis with 31% increased risk of mortality. This finding further highlights the prognostic capability of PS in HCC, and patients with PS 1 or 2 should be considered clinically different entities. Consistently, our previous study focusing on PS in the BCLC system showed that patients with PS 1 or 2 had different long-term prognosis, and separating patients with PS 1 from patients with PS 2 improved the predictive accuracy of the BCLC system.12 Taken together, progression from PS 1 (symptomatic but without limitation) to PS 2 (symptomatic with limitations) reflects critical deterioration of general wellness of HCC patients; bundling patients with PS 1 or 2 together might decrease the prognostic power of the BCLC system.
Including PS in the allocation system has been regarded as the niche of the BCLC model. HCC patients with deteriorated PS are considered fragile and the benefit of aggressive anticancer treatments could be profoundly offset by possible complications. In the current BCLC guidelines, patients with PS 1 or 2 are classified as advanced- or terminal-stage HCC; targeted/chemotherapy and best supportive care are suggested as the treatment of choice. However, this recommendation is not followed by most patients in real clinical scenario, and a recent study from Hong Kong showed the survival benefits of aggressive treatment strategies for patients with intermediate to advanced-stage HCC.19 In our study, approximately 68% of HCC patients with PS 1 underwent aggressive treatments as their primary management against the BCLC recommendations. Compared to patients received targeted/chemotherapy or best supportive care, patients with PS 1 undergoing aggressive treatments had milder cirrhosis and/or smaller tumor burden, and they were more likely to benefit rather than deteriorate after aggressive anticancer treatments. However, it should be noted that a better long-term survival in patients with PS 1 receiving aggressive treatments might be biased by the differences in baseline features. After baseline imbalance between 2 treatment groups was reduced in the propensity model, patients undergoing targeted/chemotherapy or supportive care had a significantly shortened survival compared with patients receiving aggressive anticancer treatments. Importantly, for patients with PS 1, their chances to receive aggressive treatments should be evaluated individually to maximize the survival benefit. This idea has been discussed by a number of independent studies. Ablation and TACE were correlated to higher survival rate in selected HCC patients with CTP class C cirrhosis.20 Surgical resection was considered safe and associated with improved outcome in selected patients with advanced HCC.21 Altogether, the current recommendations of the BCLC system for patients with PS 1 are not followed by a substantially high proportion of patients, and aggressive anticancer treatments may result in improved long-term survival.
For HCC patients with PS 2, 58% of them underwent aggressive treatments as the primary therapy. Patients receiving aggressive anticancer treatments had better liver function and smaller tumor burden in comparison with patients undergoing targeted/chemotherapy or supportive care. After removing the confounders, reassessing survival distributions between patients with PS 2 undergoing different treatment strategies showed similar long-term prognosis. Unlike HCC patients with PS 1, the long-term survival of HCC patients with PS 2 was not improved with aggressive anti-HCC treatments against the of BCLC recommendations. It is likely that advanced cirrhosis, overwhelming tumor burden, and poor PS per se in HCC patients with PS 2 could result in rapid disease progression and shortened survival regardless of treatment strategies. Besides, because of their poor general condition, complications may offset or even outweigh the therapeutic benefits of aggressive treatments in patients with PS 2.
This study has a few potential limitations. First, because very few patients in our cohort received transplantation as the primary treatment, our findings may not be readily applied to centers with a high volume of liver transplantation. Second, in this study, more than half of our patients had evidence of hepatitis B infection. This feature is distinctly different from countries where hepatitis C infection is the predominant etiology of chronic liver disease.22,23 Lastly, the cost-effectiveness in relation to PS was not analyzed in this study and should be addressed in future trials.
In conclusion, our results indicate that HCC patients with PS 1 or 2 at the time of diagnosis are not uncommon.24 Patients with PS 1 or 2 should be considered as different groups in terms of baseline characteristics, treatment strategies, and outcome. For selected HCC patients with PS 1, aggressive treatments against the BCLC guidelines may improve their survival; however, the benefit of aggressive therapies for HCC patients with PS 2 might not be obvious. As a prognostic model, the predictive accuracy of BCLC system might be compromised by classifying PS 1 and 2 in the same category; in addition, as a treatment allocation algorithm, the BCLC system could limit the survival benefit of aggressive therapies for patients with PS 1. External validation from future studies is needed to modify the BCLC system.
Footnotes
Abbreviations: AFP = α-fetoprotein, BCLC = Barcelona Clinic Liver Cancer, HCC = hepatocellular carcinoma, PS = performance status, TACE = transarterial chemoembolization.
This study was supported by grants from the Center of Excellence for Cancer Research at Taipei Veterans General Hospital (MOHW104-TDU-B-211-124-001), Taiwan, from Taipei Veterans General Hospital (V104C-008), Taipei, Taiwan, and from the Ministry of Education, Aiming for the Top University Plan (103AC-P618), Taiwan.
The authors have no conflicts of interest to disclose.
REFERENCES
- 1.El-Serag HB, Marrero JA, Rudolph L, et al. Diagnosis and treatment of hepatocellular carcinoma. Gastroenterology 2008; 134:1752–1763. [DOI] [PubMed] [Google Scholar]
- 2.Li L, Zhang J, Liu X, et al. Clinical outcomes of radiofrequency ablation and surgical resection for small hepatocellular carcinoma: a meta-analysis. J Gastroenterol Hepatol 2012; 27:51–58. [DOI] [PubMed] [Google Scholar]
- 3.Chan SL, Yeo W. Targeted therapy of hepatocellular carcinom: present and future. J Gastroenterol Hepatol 2012; 27:862–872. [DOI] [PubMed] [Google Scholar]
- 4.Chaparro M, Gonzalez Moreno L, Trapero-Marugan M, et al. Review article: pharmacological therapy for hepatocellular carcinoma with sorafenib and other oral agents. Aliment Pharmacol Ther 2008; 28:1269–1277. [DOI] [PubMed] [Google Scholar]
- 5.Llovet JM, Ducreux M, Lencioni R, et al. EASL-EORTC clinical practice guidelines: management of hepatocellular carcinoma. J Hepatol 2012; 56:908–943. [DOI] [PubMed] [Google Scholar]
- 6.Bruix J, Sherman M. Management of hepatocellular carcinoma: an update. Hepatology 2011; 53:1020–1022. [DOI] [PMC free article] [PubMed] [Google Scholar]
- 7.Oken MM, Creech RH, Tormey DC, et al. Toxicity and response criteria of the Eastern Cooperative Oncology Group. Am J Clin Oncol 1982; 5:649–655. [PubMed] [Google Scholar]
- 8.Hsu CY, Lee YH, Liu PH, et al. Decrypting cryptogenic hepatocellular carcinoma: clinical manifestations, prognostic factors and long-term survival by propensity score model. PLoS One 2014; 9:e89373. [DOI] [PMC free article] [PubMed] [Google Scholar]
- 9.Lee YH, Hsu CY, Hsia CY, et al. Defining the severity of liver dysfunction in patients with hepatocellular carcinoma by the model for end-stage liver disease-derived systems. Dig Liver Dis 2012; 44:868–874. [DOI] [PubMed] [Google Scholar]
- 10.Hsu CY, Liu PH, Lee YH, et al. Active treatments prolong the survival in patients with hepatocellular carcinoma and performance status 3 or 4: a propensity score analysis. J Clin Gastroenterol 2015; (in press) PMID:25710525. [DOI] [PubMed] [Google Scholar]
- 11.Hsu CY, Liu PH, Lee YH, et al. Using serum α-fetoprotein for prognostic prediction in patients with hepatocellular carcinoma: what is the most optimal cutoff? PLoS One 2015; 10:e0118825. [DOI] [PMC free article] [PubMed] [Google Scholar]
- 12.Hsu CY, Lee YH, Hsia CY, et al. Performance status in patients with hepatocellular carcinoma: determinants, prognostic impact, and ability to improve the Barcelona Clinic Liver Cancer system. Hepatology 2013; 57:112–119. [DOI] [PubMed] [Google Scholar]
- 13.Hsu CY, Huang YH, Hsia CY, et al. A new prognostic model for hepatocellular carcinoma based on total tumor volume: the Taipei Integrated Scoring System. J Hepatol 2010; 53:108–117. [DOI] [PubMed] [Google Scholar]
- 14.Austin PC, Schuster T. The performance of different propensity score methods for estimating absolute effects of treatments on survival outcomes: a simulation study. Stat Methods Med Res 2015; (in press). [DOI] [PMC free article] [PubMed] [Google Scholar]
- 15.Austin PC. A comparison of 12 algorithms for matching on the propensity score. Stat Med 2014; 33:1057–1069. [DOI] [PMC free article] [PubMed] [Google Scholar]
- 16.Hsu CY, Lee YH, Hsia CY, et al. Performance status enhances the selection of treatment for patients with hepatocellular carcinoma within the milan criteria. Ann Surg Oncol 2013; 20:2035–2042. [DOI] [PubMed] [Google Scholar]
- 17.Gomaa AI, Hashim MS, Waked I. Comparing staging systems for predicting prognosis and survival in patients with hepatocellular carcinoma in egypt. PLoS One 2014; 9:e90929. [DOI] [PMC free article] [PubMed] [Google Scholar]
- 18.Kim BK, Kim SU, Park JY, et al. Applicability of BCLC stage for prognostic stratification in comparison with other staging systems: single centre experience from long-term clinical outcomes of 1717 treatment-naive patients with hepatocellular carcinoma. Liver Int 2012; 32:1120–1127. [DOI] [PubMed] [Google Scholar]
- 19.Yau T, Tang VY, Yao TJ, et al. Development of Hong Kong Liver Cancer staging system with treatment stratification for patients with hepatocellular carcinoma. Gastroenterology 2014; 146:1691–1700. [DOI] [PubMed] [Google Scholar]
- 20.Kudo M, Osaki Y, Matsunaga T, et al. Hepatocellular carcinoma in Child-Pugh C cirrhosis: prognostic factors and survival benefit of nontransplant treatments. Dig Dis 2013; 31:490–498. [DOI] [PubMed] [Google Scholar]
- 21.Ruzzenente A, Capra F, Pachera S, et al. Is liver resection justified in advanced hepatocellular carcinoma? Results of an observational study in 464 patients. J Gastrointest Surg 2009; 13:1313–1320. [DOI] [PubMed] [Google Scholar]
- 22.Tokushige K, Hashimoto E, Yatsuji S, et al. Prospective study of hepatocellular carcinoma in nonalcoholic steatohmepatitis in comparison with hepatocellular carcinoma caused by chronic hepatitis C. J Gastroenterol 2010; 45:960–967. [DOI] [PubMed] [Google Scholar]
- 23.Kew MC, Geddes EW. Hepatocellular carcinoma in rural southern African blacks. Medicine 1982; 61:98–108. [DOI] [PubMed] [Google Scholar]
- 24.Lee IC, Chen YT, Chao Y, et al. Determinants of survival after sorafenib failure in patients with BCLC-C hepatocellular carcinoma in real-world practice. Medicine 2015; 94:e688. [DOI] [PMC free article] [PubMed] [Google Scholar]


