Abstract
We investigated the role of F-18 fluorodeoxyglucose (FDG)-positron emission tomography (PET)/computed tomography (CT) for the differential diagnosis of malignant and benign pleural effusion.
We studied 36 consecutive patients with histologically proven cancer (excluding malignant mesothelioma) who underwent FDG-PET/CT for suspected malignant pleural effusion. Fourteen patients had cytologically proven malignant pleural effusion and the other 22 patients had either negative cytology or clinical follow-up, which confirmed the benign etiology. We examined the maximum standardized uptake values (SUVmax) of pleural effusion and the target-to-normal tissue ratio (TNR), calculated as the ratio of the pleural effusion SUVmax to the SUVmean of the normal tissues (liver, spleen, 12th thoracic vertebrae [Th12], thoracic aorta, and spinalis muscle). We also examined the size and density (in Hounsfield units) of the pleural effusion and pleural abnormalities on CT images.
TNR (Th12) and increased pleural FDG uptake compared to background blood pool were significantly more frequent in cases with malignant pleural effusion (P < 0.05 for both). The cutoff TNR (Th12) value of >0.95 was the most accurate; the sensitivity, specificity, and accuracy for this value were 93%, 68%, and 75%, respectively.
FDG-PET/CT can be a useful method for the differential diagnosis of malignant and benign pleural effusion.
INTRODUCTION
Pleural effusion is a common medical problem with various causes, including disease local to the pleura or underlying lung, systemic conditions, organ dysfunction, infection, and drugs. The diagnosis of malignant pleural effusion adversely affects a patient's staging and prognosis and may alter the therapeutic approach. Several tests have been used to assess the nature of pleural effusion in cancer patients, including invasive tests such as thoracocentesis with cytologic and/or biochemical analysis.
The purposes of the present study were to evaluate the accuracy of F-18 fluorodeoxyglucose (FDG)-positron emission tomography (PET)/computed tomography (CT) in the detection of malignant pleural effusion in cancer patients, and to define the most accurate criteria to be used for such a differentiation.
MATERIALS AND METHODS
Patient Population
This retrospective study was approved by the institutional review board and the requirement of written informed consent was waived. We reviewed whole medical records of 100 patients with a history of malignant diseases, who underwent FDG-PET/CT for suspected malignant pleural effusion between January 2013 and April 2014 at our institution. Nine patients were excluded because they revealed to have benign diseases (immunoglobulin G4-related disease, pulmonary lymphangioleiomyomatosis, pleural inflammation, etc) or malignant mesotheliomas. We also excluded 55 patients who did not have a history of pleural cytology or biopsy without a ≥6-month clinical follow-up, a single negative cytology result without a >6-month clinical follow-up, or a history of chemotherapy or injection of granulocyte macrophage colony-stimulating factor (GM-CSF) within 3 months of PET/CT and pleural biopsy. Histopathological analyses showed 14 patients had malignant pleural diseases. Nine patients were confirmed to have benign diseases with at least 2 negative cytology test results1,2 and 13 were also judged to have pleural diseases of benign etiology because of a >6-month clinical follow-up. Finally, the total of 36 consecutive patients (25 men, 11 women; age 41–87 years; mean age, 69 years) were included in this study.
FDG-PET/CT
All patients fasted for at least 5 hours and had a blood sugar (BS) level of <200 mg/dL before being injected intravenously with FDG (3.5 MBq/kg), after which they rested for approximately 75 minutes. FDG-PET/CT images were obtained with an integrated PET/CT scanner (Biograph Sensation 16 or Biograph mCT S (64) 4R; Siemens Healthcare, Erlangen, Germany).
The Biograph Sensation 16 consists of a 16-slice multidetector CT and a lutetium oxyorthosilicate PET with ultrafast detector electronics. Before the PET image acquisition, low-dose CT (tube voltage, 120 kV; tube current, auto mA) was performed for attenuation correction and precise anatomical localization. The patient was instructed to maintain shallow breathing during the scanning procedure. Three-dimensional (3D) PET data were then acquired in 7 to 8 bed positions from the top of the skull to the mid-thigh level for 2 minutes per bed position, for a total acquisition period of approximately 20 minutes. Attenuation-corrected FDG-PET images were reconstructed with the CT data with an ordered-subset expectation maximization algorithm for 2 iterations and 8 subsets. A Gaussian filter was applied for smoothing, with a transaxial spatial resolution of 5 mm at full width at half maximum.
The PET/CT Biograph mCT S (64) 4R system has an integrated PET scanner with a lutetium oxyorthosilicate crystal and a 64-slice multidetector CT. Before this PET image acquisition, low-dose CT (tube voltage, 120 kV; tube current, auto mA) was performed. The PET data were acquired in 7 to 8 bed positions for 90 seconds per bed position. PET images were reconstructed with a 3D-ordered-subset expectation maximization algorithm for 3 iterations and 21 subsets. Time-of-flight and point spread function techniques were also used for the image reconstruction (ultrahigh-definition PET). A 3D Gaussian filter was applied for smoothing, with a transaxial spatial resolution of 6 mm at full width at half maximum.
The CT and PET scan data were accurately coregistered with dedicated software (e-soft; Siemens Healthcare) to generate the fusion images.
Scan Interpretation
The FDG-PET/CT images were reviewed by 2 experienced nuclear medicine physicians who were unaware of the other imaging results and the histopathology of the pleural lesions. If the results of the 2 physicians differed, they discussed the findings and reached a consensus. After this review of the FDG-PET/CT images, we reviewed and analyzed the medical records of the patients, other imaging commodities, and the histopathological results.
Interpretation of CT (PET/CT)
The parameters that were assessed using the PET/CT images were the density (Hounsfield units [HU]) and the size of pleural effusion. The pleural effusion size was defined as the maximal anteroposterior depth on the supine images. We also assessed the abnormal pleural lesions on PET/CT that were defined as either a diffuse thickening or nodular lesions.
Interpretation of FDG-PET/CT
Regions of interest (ROIs) were drawn on the axial PET/CT images of the pleural effusion, and the maximal standardized uptake values (SUVmax) were calculated. ROIs were overlaid onto the pleural effusion while avoiding the chest wall and the mediastinal structures on the PET/CT images. We assessed the degree of pleural FDG uptake in axial slices that were defined as either a diffuse thickening or focal lesions. FDG uptake was accepted when the positive pleural activity was greater than the background blood pool activity. As reference values, the SUVmeans of the liver, spleen, 12th thoracic vertebrae (Th12), thoracic aorta, and spinalis muscle were also calculated. Each patient had an only 1 scan but 1 examiner performed 2 repeated measurements of the pleural effusion SUVmax and the SUVmean of the reference organ values for each patient at 6-month intervals. We then averaged the 2 sets of SUVmax and SUVmean measurements for each patient.
The target-to-normal tissue ratio (TNR) was obtained as follows
 |
The patient characteristics, including sex, age, and BS values were assessed.
Statistical Analysis
The sensitivity, specificity, positive predictive value (PPV), negative predictive value (NPV), and accuracy in differentiating benign from malignant pleural effusion were calculated for the CT and PET parameters. For the nonparametric parameters (abnormal pleural lesions on PET/CT and abnormal pleural uptake on PET images), Fisher exact test was used. We assessed the statistical differences in the parametric parameters (age, SUVmax, TNRs [liver, spleen, aorta, and muscle]) of the malignant and benign pleural effusions using an independent t test. For the nonparametric parameters (sex, BS, HU, and TNR [Th12]), the Mann–Whitney U test was used. A P value of 0.05 was considered significant. We used a receiver operating curve (ROC) analysis to assess the size, HU, pleural uptake, SUVmax, and TNRs measured in the pleural effusions, which best separated the benign and malignant effusions. Logistic regression was performed for all CT and PET parameters. The statistical analyses were performed using the JMP, SAS Institute Japan Ltd., Tokyo for Windows package, version 11.
RESULTS
Patient Characteristics
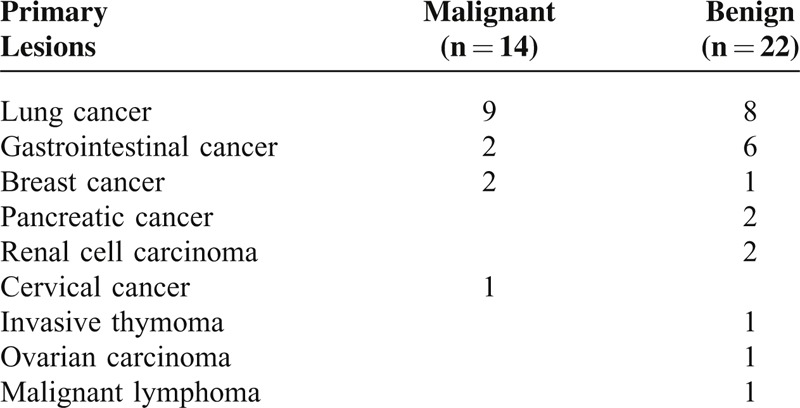
Tables 1 and 2 summarize the clinical characteristics of the patients included in this study. We examined 36 cancer patients with pleural effusion. All 36 patients had histologically proven cancer and the histological types of primary lesions were shown in Table 1. Fourteen of the 36 patients showed evidence of malignant pleural effusions on the basis of their pleural biopsy or thoracocentesis, and the other 22 patients had negative results in at least 2 cytological tests (n = 9) or they were followed up clinically for >6 months with confirmation of the benign etiology (n = 13).
TABLE 1.
Primary Lesions of the Patients

TABLE 2.
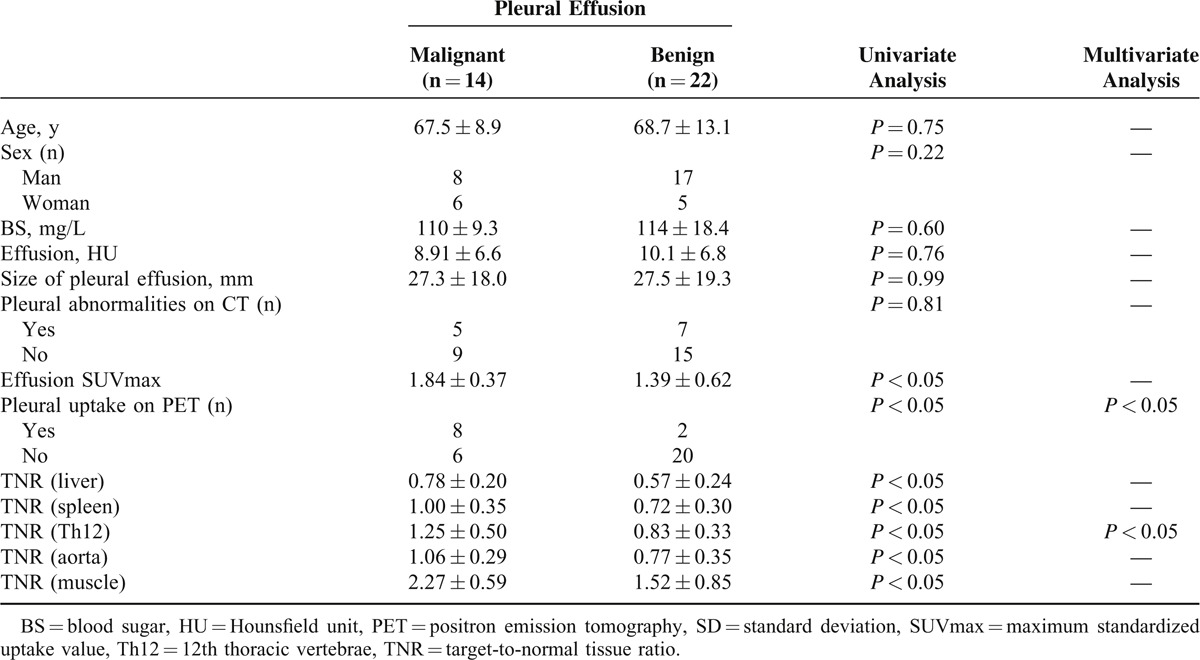
Clinical Characteristics of the Patients

There were no significant differences in patient age, sex, BS, HU, size of the pleural effusion, or pleural abnormalities on CT images between the patients with malignant effusion and those with benign pleural effusion (Table 2).
Comparison of the Parameters Detected by FDG-PET/CT in Malignant and Benign Pleural Effusions
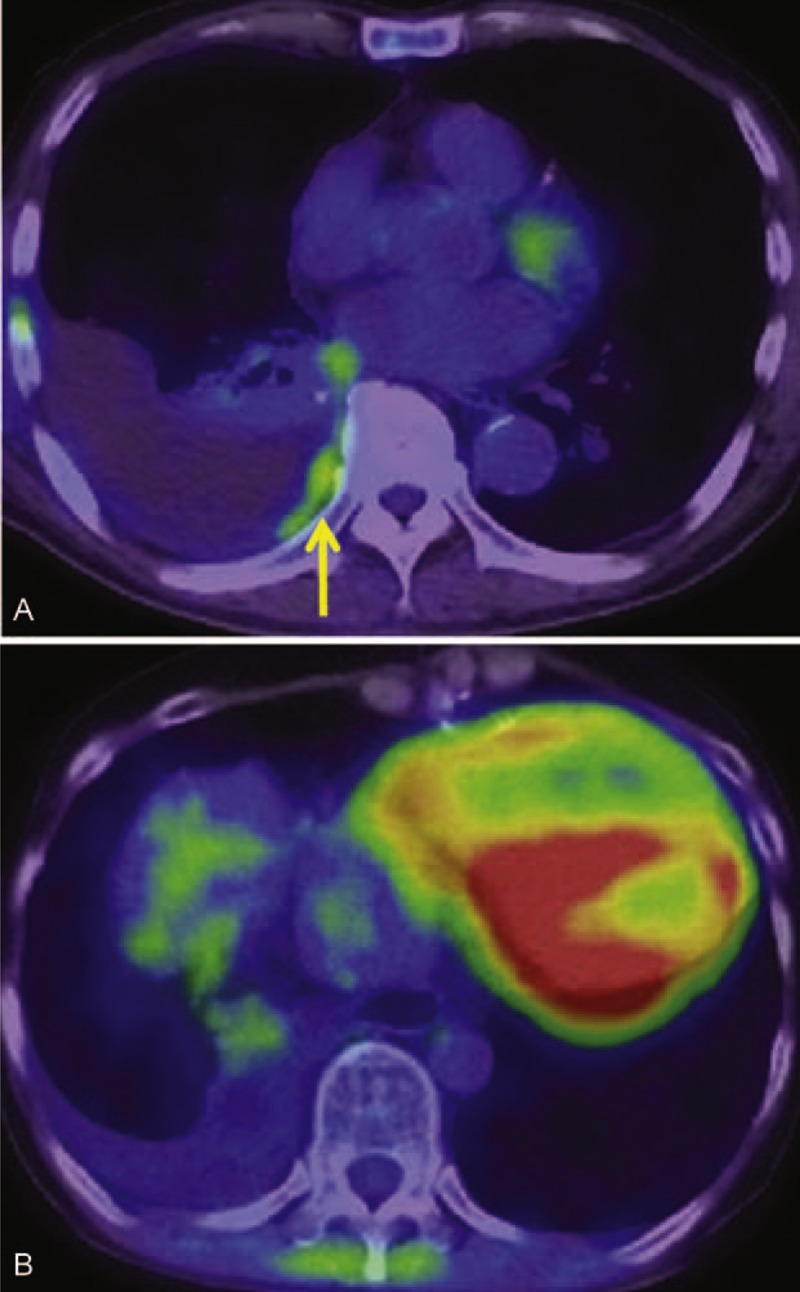
All TNR values and SUVmax were significantly higher in the patients with malignant pleural effusion than in those with benign pleural effusions (P < 0.05 Table 1, Figure 1). Eight of the 14 patients with malignant pleural effusion showed increased pleural FDG uptake. Two of the 22 patients with benign pleural effusion showed increased pleural FDG uptake. These patients had chronic empyema (false-positive result). The pleural FDG uptake was significantly higher in the patients with malignant pleural disease than in those with benign pleural effusions (Table 2).
FIGURE 1.

(A) An 80-year-old man was found to have a right pleural effusion after the resection of right lung adenocarcinoma. A weak but obvious FDG uptake was found along the right pleura (arrow). SUVmax of this lesion was 1.41 and TNR with the reference of Th12 was 1.21. Malignant pleural effusion was diagnosed by thoracocentesis. (B) A 60-year-old woman developed a right pleural effusion after the resection of colon cancer. No definite FDG accumulation was observed, SUVmax = 1.07, TNR (Th12) = 0.88. Cytopathologic examination of pleural fluid was negative for malignancy. It finally disappeared after the treatment of heart failure. FDG = fluorodeoxyglucose, SUVmax = maximum standardized uptake value, Th12 = 12th thoracic vertebrae, TNR = target-to-normal tissue ratio.
We performed ROC analyses to determine the optimal cutoff values of HU, pleural effusion size, the pleural abnormalities on CT images, SUVmax, TNR (liver, spleen, Th12, aorta, and muscle), and increased pleural FDG uptake for the differential diagnosis of malignant effusion and benign pleural effusion (Table 3). The ROC analysis revealed that the ideal cutoff value for TNR (Th12) was 0.95, with 93% sensitivity, 68% specificity, and 75% accuracy. Increased pleural FDG uptake had 57% sensitivity, 91% specificity, and 78% accuracy. Of these indices, TNR (Th12) (malignant pleural effusion: 1.25 ± 0.5, range, 0.59–2.33; benign pleural effusion: 0.83 ± 0.33, range, 0.07–1.47; P < 0.05) and increased pleural FDG uptake (P < 0.05) were the best-fitting parameters for the differential diagnosis of malignant pleural effusion and benign pleural effusion by logistic regression analyses (Table 2).
TABLE 3.
ROC Analyses of Quantitative Indices and PET/CT Scan Parameters

DISCUSSION
Pleural effusion in a patient with cancer may represent metastatic disease or reactive fluid collection, or it may be the result of another nonmalignant disease process such as infection or renal/cardiac failure. In particular, the diagnosis of malignant pleural effusion adversely affects staging and prognosis3 and may alter the therapeutic approaches to cancer patients. Classically, invasive tests have been used to assess the nature of effusion; these tests include thoracocentesis with cytological and/or biochemical analyses and blind/open-needle biopsies.
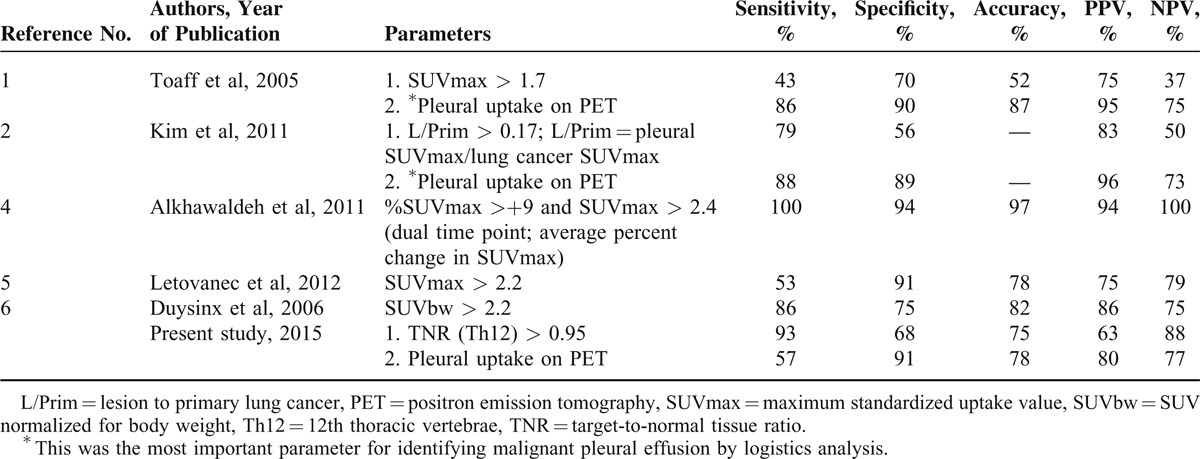
FDG-PET/CT is a noninvasive procedure and has been shown to be an accurate imaging modality for the differential diagnosis of malignant and benign disease processes. Several studies have reported the usefulness of FDG-PET as a highly accurate and noninvasive modality for the differential diagnosis of pleural diseases in patients with cancer (sensitivity 53%–100%; specificity 67%–94%; accuracy 79%–97%; PPV 76%–87%; and NPV 78%–100%).1,2,4–11 A number of previous studies used only visual examinations of FDG-PET images,7–10 and other studies used semiquantitative indices such as the SUVmax (Table 4).1,2,4–6 Three of these 5 studies using the SUVmax normalized it for primary lesions and body weight2,6 or used dual-phase PET imaging.4
TABLE 4.
Characteristics of the Included Previous Studies

Kim et al2 also found that the SUVmax values that were normalized for the primary lesion and increased pleural FDG uptake showed similar diagnostic values on an ROC analysis; however, a logistic regression analysis showed that the increased pleural FDG uptake was the most important parameter for identifying malignant pleural effusion.2 In a semiquantitative analysis, Duysinx et al6 found that SUV normalized for body weight was the best parameter for identifying malignant effusion. Alkhawaldeh et al4 calculated the average percent change in SUVmax (%SUV) between 1 and 2 hours after FDG administration. They used SUVmax values >2.4 and %SUV of >+9 as the criteria for malignancy, with 100% sensitivity, 94% specificity, and 97% accuracy.
Compared with SUVmax alone, normalized SUVmax2,6 and dual-phase PET imaging4 were shown to increase the diagnostic accuracy of FDG-PET/CT for the assessment of pleural effusion in patients with cancer (Table 4). The SUV is influenced by several factors that are related to the patient (eg, body weight and BS) as well as technical aspects (eg, scan protocols, scan time, and FDG injection activity). Considering these factors, SUV alone should not be used for the differential diagnosis of malignant effusion and benign pleural effusion in patients with cancer.
In the present study, the TNR (Th12) values were significantly higher among the patients with malignant effusion compared to those with benign effusion. Our results were similar to those of 2 earlier studies.2,6 However, a dual-time point FDG-PET study reported higher accuracy than that obtained from single-image acquisition.4 In particular, a higher increase of SUV in delayed FDG-PET images in malignant pleural effusion compared to benign pleural effusion was mentioned in this study. Although the change in SUVs over time that were estimated with the dual-time point technique is helpful for the differential diagnosis of malignant pleural effusions from benign inflammatory processes, routine use of this technique is limited in daily examination schedule.
We obtained multiple TNR values in the present study and found that the Th12 reference value was the best parameter. The effect of chemotherapy and GM-CSF on the FDG accumulation is ignorable in this study because of our exclusion criteria. However, the intensity of physiological FDG uptake in the liver, spleen, muscle, aorta, and also Th12 might be variable in some conditions. Hepatic FDG uptake quantified as SUVmax and SUVmean is correlated with the body mass index and liver function.12 Splenic uptake is observed in many inflammatory and hematopoietic diseases13; muscle uptake reflects insulin levels and obesity14; and aorta uptake is abnormal in aneurysms and inflammation.15 Although vertebral FDG accumulation in patients might be affected by several factors such as serum C-reactive protein, hemoglobin level, and patient age,16 there were no patients with severe anemia or chronic inflammatory disease in this study.
The use of FDG-PET/CT should allow clinicians to avoid performing invasive diagnostic tests in patients in whom a benign lesion is suspected by a TNR (Th12) value <0.95, and such imaging may help prevent complications that are associated with invasive procedures. Considering the high sensitivity and NPV of FDG-PET, this modality may provide valuable information noninvasively for evaluating pleural disease when a pleural effusion analysis is not possible, when the results are questionable, or when it is difficult to obtain enough pleural fluid. Early diagnosis of the primary etiology of malignant pleural effusion is crucial for developing a proper clinical treatment plan and predicting the prognosis.
The mechanisms of malignant pleural effusion uptake are still unclear. We have occasionally observed that the FDG accumulation of a malignant pleural effusion moves when the patient's position has changed from the supine position to the prone position (data not shown). We thus suspect that FDG may be taken up by cancer cells in the pleural effusion and that the degree of FDG accumulation reflects the number of malignant cells in the pleural effusion.
The main limitation of our present study is the relatively small number of patients (n = 36), which was a result of our strict inclusion criteria. In addition, this study was retrospective. Prospective studies with a larger number of patients must be conducted to validate our results. Another limitation is that not all of the patients underwent an open pleural biopsy as a standard procedure.
CONCLUSION
Our results suggest that FDG-PET/CT is a noninvasive and can be a useful method for the differential diagnosis of malignant and benign pleural effusion in patients with cancer. The cutoff TNR (Th12) value of >0.95 on PET images would be the most accurate parameter for identifying malignant pleural effusion.
Footnotes
Abbreviations: 3D = three dimensional, BS = blood sugar, FDG-PET/CT = F-18 fluorodeoxyglucose-positron emission tomography/computed tomography, GM-CSF = granulocyte macrophage colony-stimulating factor, HU = Hounsfield unit, NPV = negative predictive value, PPV = positive predictive value, ROC = receiver operating curve, SUVmax = maximum standardized uptake value, SUVmean = mean standardized uptake value, Th12 = 12th thoracic vertebrae, TNR = target-to-normal tissue ratio.
The authors have no funding and conflicts of interest to disclose.
REFERENCES
- 1.Toaff JS, Metser U, Gottfried M, et al. Differentiation between malignant and benign pleural effusion in patients with extra-pleural primary malignancies: assessment with positron emission tomography-computed tomography. Invest Radiol 2005; 40:204–209. [DOI] [PubMed] [Google Scholar]
- 2.Kim BS, Kim IJ, Kim SJ, et al. Predictive value of F-18 FDG PET/CT for malignant pleural effusion in non-small cell lung cancer patients. Onkologie 2011; 34:298–303. [DOI] [PubMed] [Google Scholar]
- 3.DeBiasi EM, Pisani MA, Murphy TE, et al. Mortality among patients with pleural effusion undergoing thoracentesis. Eur Respir J 2015; ERJ-02171-2014 [Epub ahead of print]. [DOI] [PMC free article] [PubMed] [Google Scholar]
- 4.Alkhawaldeh K, Biersack HJ, Henke A, et al. Impact of dual-time-point F-18 FDG PET/CT in the assessment of pleural effusion in patients with non-small-cell lung cancer. Clin Nucl Med 2011; 36:423–428. [DOI] [PubMed] [Google Scholar]
- 5.Letovanec I, Allenbach G, Mihaescu A, et al. 18F-fluorodeoxyglucose PET/CT findings in pleural effusions of patients with known cancer. A cytopathological correlation. Nuklearmedizin 2012; 51:186–193. [DOI] [PubMed] [Google Scholar]
- 6.Duysinx BC, Larock MP, Nguyen D, et al. 18F-FDG PET imaging in assessing exudative pleural effusions. Nucl Med Commun 2006; 27:971–976. [DOI] [PubMed] [Google Scholar]
- 7.Erasmus JJ, McAdams HP, Rossi SE, et al. FDG PET of pleural effusions in patients with non-small cell lung cancer. AJR Am J Roentgenol 2000; 175:245–249. [DOI] [PubMed] [Google Scholar]
- 8.Gupta NC, Rogers JS, Graeber GM, et al. Clinical role of F-18 fluorodeoxyglucose positron emission tomography imaging in patients with lung cancer and suspected malignant pleural effusion. Chest 2002; 122:1918–1924. [DOI] [PubMed] [Google Scholar]
- 9.Schaffler GJ, Wolf G, Schoellnast H, et al. Non-small cell lung cancer: evaluation of pleural abnormalities on CT scans with 18F FDG PET. Radiology 2004; 231:858–865. [DOI] [PubMed] [Google Scholar]
- 10.Liao R, Yang X, Wang S, et al. Clinical role of F-18 FDG PET/CT in differentiating malignant and benign pleural effusion in patients with lung cancer. Zhongguo Fei Ai Za Zhi 2012; 15:652–655. [DOI] [PMC free article] [PubMed] [Google Scholar]
- 11.Abdel-Dayem HM, Rosen G, El-Zeftawy H, et al. Fluorine-18 fluorodeoxyglucose splenic uptake from extramedullary hematopoiesis after granulocyte colony-stimulating factor stimulation. Clin Nucl Med 1999; 24:319–322. [DOI] [PubMed] [Google Scholar]
- 12.Pak K, Kim SJ, Kim IJ, et al. Hepatic FDG uptake is not associated with hepatic steatosis but with visceral fat volume in cancer screening. Nucl Med Mol Imaging 2012; 46:176–181. [DOI] [PMC free article] [PubMed] [Google Scholar]
- 13.Liu Y. Clinical significance of diffusely increased splenic uptake on FDG-PET. Nucl Med Commun 2009; 30:763–769. [DOI] [PubMed] [Google Scholar]
- 14.Büsing KA, Schönberg SO, Brade J, et al. Impact of blood glucose, diabetes, insulin, and obesity on standardized uptake values in tumors and healthy organs on 18F-FDG PET/CT. Nucl Med Biol 2013; 40:206–213. [DOI] [PubMed] [Google Scholar]
- 15.Courtois A, Nusgens BV, Hustinx R, et al. 18F-FDG uptake assessed by PET/CT in abdominal aortic aneurysms is associated with cellular and molecular alterations prefacing wall deterioration and rupture. J Nucl Med 2013; 54:1740–1747. [DOI] [PubMed] [Google Scholar]
- 16.Inoue K, Goto R, Okada K, et al. A bone marrow F-18 FDG uptake exceeding the liver uptake may indicate bone marrow hyperactivity. Ann Nucl Med 2009; 23:643–649. [DOI] [PubMed] [Google Scholar]


