Abstract
The aim of this study was to examine the association between sex-specific serum uric acid (sUA) levels and NAFLD in a large population-based study.
A total of 60,455 subjects from 2 separate medical centers were included. Sex-specific sUA quartiles (Q1–Q4) were defined: ≤330, 331–380, 381–435, and ≥436 μmol/L for male; ≤230, 231–270, 271–310, and ≥311 μmol/L for female. The odds ratios (ORs), hazard ratios (HRs), and 95% confidence intervals (CIs) for NAFLD were calculated across each quartile of sUA, using the Q1 as reference.
After adjusting for known confounding variables in this study, the ORs for NAFLD in the cross-sectional population were 1.211 (95% CI 1.109–1.322), 1.519 (95% CI 1.395–1.654), 1.903 (95% CI 1.748–2.072) for Q2, Q3, and Q4, respectively. In the longitudinal population, compared with the reference group, those in Q2, Q3, and Q4 had HRs of 1.127 (95% CI 0.956–1.330), 1.380 (95% CI 1.157–1.644), 1.589 (95% CI 1.310–1.927) for NAFLD, respectively. Analysis for the sex-specific subgroup showed the adjusted ORs for Q4 versus Q1 were 2.898 (95% CI 2.36–3.588) in female and 1.887 (95% CI 1.718–2.072) in male in the cross-sectional population. In the longitudinal population, the HRs for the Q4 were 2.355 (95% CI 1.702–3.259) in female and 1.249 (95% CI 0.975–1.601) in male, compared with Q1.
We report that a sex-specific sUA level is independently associated with NAFLD. The association between sUA and NAFLD was significantly greater in females than in males.
INTRODUCTION
Non-alcoholic fatty liver disease (NAFLD) is the result of hepatic fat accumulation in patients without excessive alcohol intake or other causes of liver disease.1,2 It is commonly associated with obesity, insulin resistance, hypertension, and dyslipidemia, which are comorbidities closely related to a cluster of metabolic disorders.3,4 NAFLD is the most common form of chronic liver disease and affects 24% to 42% of the general population in Western countries and 5% to 42% in Asian countries.5–8 Patients with NAFLD have a markedly higher risk of death compared with the general population.9,10 Therefore, identifying potential risk factors is essential for the prevention of NAFLD.
Serum uric acid (sUA) is the major end product of purine metabolism. It has been shown to be an independent predictor of outcome in the general population and in patients with metabolic syndrome, type-2 diabetes mellitus, atherosclerosis, and gout.11,12 There is an increasing body of evidence, which suggests that sUA levels are associated with the development or progression of NAFLD and even a normal sUA level is independently associated with the presence of NAFLD.13–16 However, some studies found that this association was not statistically significant.17,18 An apparently conflicting conclusion from these studies may be as a result of small sample sizes and differences in patient demographics.
Males and females have different sUA levels at all ages,19 sUA levels are higher in males than in age-matched females, a finding that has been related to the fact that estrogens are uricosuric.20,21 sUA plays a sex-specific causal role in development of metabolic syndrome–related diseases. Compared with males, the impact of hyperuricemia in cardiovascular or renal outcomes is generally associated with a worse prognosis in women.19,22,23 However, little is known regarding the association between sex-specific sUA levels and NAFLD.
In this study, we conducted our analyses from 2 large populations from the southeast of China who consume a rice-based diet to examine the relationship between sex-specific sUA levels and NAFLD.
MATERIALS and METHODS
Study Design
To identify whether sUA may play a sex-specific causal role in the development of NAFLD, subjects from 2 separate medical centers were included: a cross-sectional population and a longitudinal population. The cross-sectional population consisted of 58849 individuals who underwent a health examination in the First Affiliated Hospital of Wenzhou Medical University, from January 2007 to December 2009. The longitudinal population was based on a prospective study and was conducted from 14734 initially fatty liver disease–free individuals who underwent an annual health screen in the Xinyu People's Hospital of Jiangxi Province. The tests used during the follow-up were the same as were used in the first health examination. The study period was initiated in January 2010 and concluded in June 2013.
Verbal informed consent was obtained from each subject before participation in the study after all procedures had been explained. The research protocol of the study was approved by the Ethics Committee of the First Affiliated Hospital of Wenzhou Medical University and Xinyu People's Hospital of Jiangxi Province, respectively.
Diagnostic Criteria
A diagnosis of NAFLD was made in reference to Guidelines for the assessment and management of NAFLD in the Asia-Pacific region.24 In general, NAFLD can be diagnosed as follows: the histological or imaging findings are in accord with the diagnostic criteria of fatty liver disease; there is no history of alcohol drinking habit or the ethanol intake <140 g/week for men and 70 g/week for women; and specific diseases that could lead to steatosis, such as viral hepatitis, drug-induced liver disease, and autoimmune liver disease, should be excluded. In this study, fatty liver is defined by the presence of at least 2 of 3 abnormal findings on abdominal ultrasonography: diffusely increased echogenicity (“bright”) liver with liver echogenicity greater than kidney or spleen, vascular blurring, and deep attenuation of ultrasound signal. The ultrasound was assessed by 2 experienced imaging specialists who were blinded to the examinee history and the study during the ultrasonic examination. A third imaging specialist was invited if the diagnoses made by the 2 imaging specialists were not in agreement or inconclusive.
Metabolic syndrome was defined by the presence of ≥3 of the following risk factors:7 central obesity: waist circumference ≥90 cm for male and ≥80 cm for female and/or BMI ≥25 kg/m2 in both sexes; hypertriglyceridemia: triglycerides ≥1.7 mmol/L; low HDL-C: HDL-C <1.03 mmol/L for male and 1.29 mmol/L for female; elevated blood pressure: blood pressure ≥130/85 mmHg or previously diagnosed; elevated fasting plasma glucose: FPG ≥5.6 mmol/L or previously diagnosed type 2 diabetes.
Exclusion Criteria
Subjects meeting the following criteria were excluded: age <18 years or >65 years; alcohol consumption >140 g/week for men and 70 g/week for women; those taking antihypertensive or anti-diabetic agents, lipid-lowering, or hypouricemic agents; any other known potential causes of chronic liver disease such as viral or autoimmune hepatitis and those using hepatotoxic medications; subjects with history of cancer, respiratory, renal, or hepatobiliary disease, gout, and other rheumatologic diseases; subjects who lost to follow-up.
Clinical Examination
Clinical examination and data recording were conducted in the morning after an overnight fast and subjects were also instructed to refrain from exercise during the day before their examination. Medical history and a health habit inventory were taken by a physician.
Standing height and body weight were measured without shoes or thick clothing. Body mass index (BMI, kg/m2), used as an index of body fat, was calculated as weight in kilograms divided by height in meters squared. Blood pressure, including systolic blood pressure (SBP) and diastolic blood pressure (DBP), was measured using an automated sphygmomanometer with the subject in a quite environment and in a sitting position.
Laboratory Examination
Fasting blood samples were obtained from each subject and were used for the analysis of biochemical measurements. The measurements included serum uric acid (sUA), fasting plasma glucose (FPG), albumin (ALB), alanine aminotransferase (ALT), aspartate aminotranferase (AST), blood urea nitrogen (BUN), creatinine (Cr), total cholesterol (TC), triglyceride (TG), high-density lipoprotein cholesterol (HDL-C), and low-density lipoprotein cholesterol (LDL-C). All factors were measured by an immunochemical automated analyzer (Abbott AxSYM) using standard methods. Hepatitis B virus serologic markers were collected for each patient (Abbott AxSYM). Hepatitis C virus antibody and human immunodeficiency virus antibody were detected using ELISA (IEGAN, Freedom evolyzer/150). Antinuclear antibody (ANA) was evaluated using indirect immunofluorescence. Soluble liver antigen/liver pancreas antigen (SLA/LP), anti-liver/kidney microsomal antibody Type 1 (anti-LKM-1) and anti-liver cytosol antibody Type 1 (anti-LC-1) were evaluated using immunoblot analysis (Euroimmun, Lubeck, Germany)
Statistical Analysis
Due to the sUA concentration differing significantly by gender, data was presented according to sex-specific quartiles statistically. Quartiles in the cross-sectional population were categorized separately as follows: Q1: ≤330 μmol/L, Q2: 331–380 μmol/L, Q3: 381–435 μmol/L and Q4 ≥436 μmol/L for male; Q1 ≤230 μmol/L, Q2: 231–270 μmol/L, Q3:271–310 μmol/L and Q4 ≥311 μmol/L for female. The grouping in the longitudinal population had the same sUA range as the cross-sectional population.
In the cross-sectional population, the odds ratios (ORs) and 95% confidence intervals (CIs) for NAFLD were calculated after adjusting for known confounding variables across each quartile of sUA concentration using multivariate logistic regression analysis. In the subgroup analysis, 95% CI was used to compare the statistical difference of ORs in the different sexes. Hazard ratios (HRs) based on Cox's proportional hazards regression were determined in the longitudinal population analysis. Kaplan–Meier analysis was applied to calculate the cumulative hazard of NAFLD during the follow-up, stratified by sex-specific quartiles of sUA. Multivariable models were used to adjust the confounding variables. Model 1 was a univariate analysis for sUA. Model 2 was adjusted for clinical parameters: age, sex, BMI, and SBP. Model 3 was adjusted for all confounding variables included in this study: age, sex, BMI, SBP, GPF, ALB, ALT, AST, BUN, Cr, TC, TG, HDL-C, LDL-C.
Continuous variables were summarized as mean ± standard deviation (SD), and categorical variables were displayed as counts or percentages (%). The characteristics of the study population according to sUA quartiles were compared using a 1-way analysis of variance (ANOVA) or Kruskal–Wallis test for continuous variables and χ2 test for categorical variables. All P values are 2-sided and a P value of <0.05 was considered statistically significant. Analyses were performed in SPSS version 20.0 (SPSS, Chicago, IL) and MedCalc version 12.7 (MedCalc Software, Ostend, Belgium).
RESULTS
Subject Characteristics
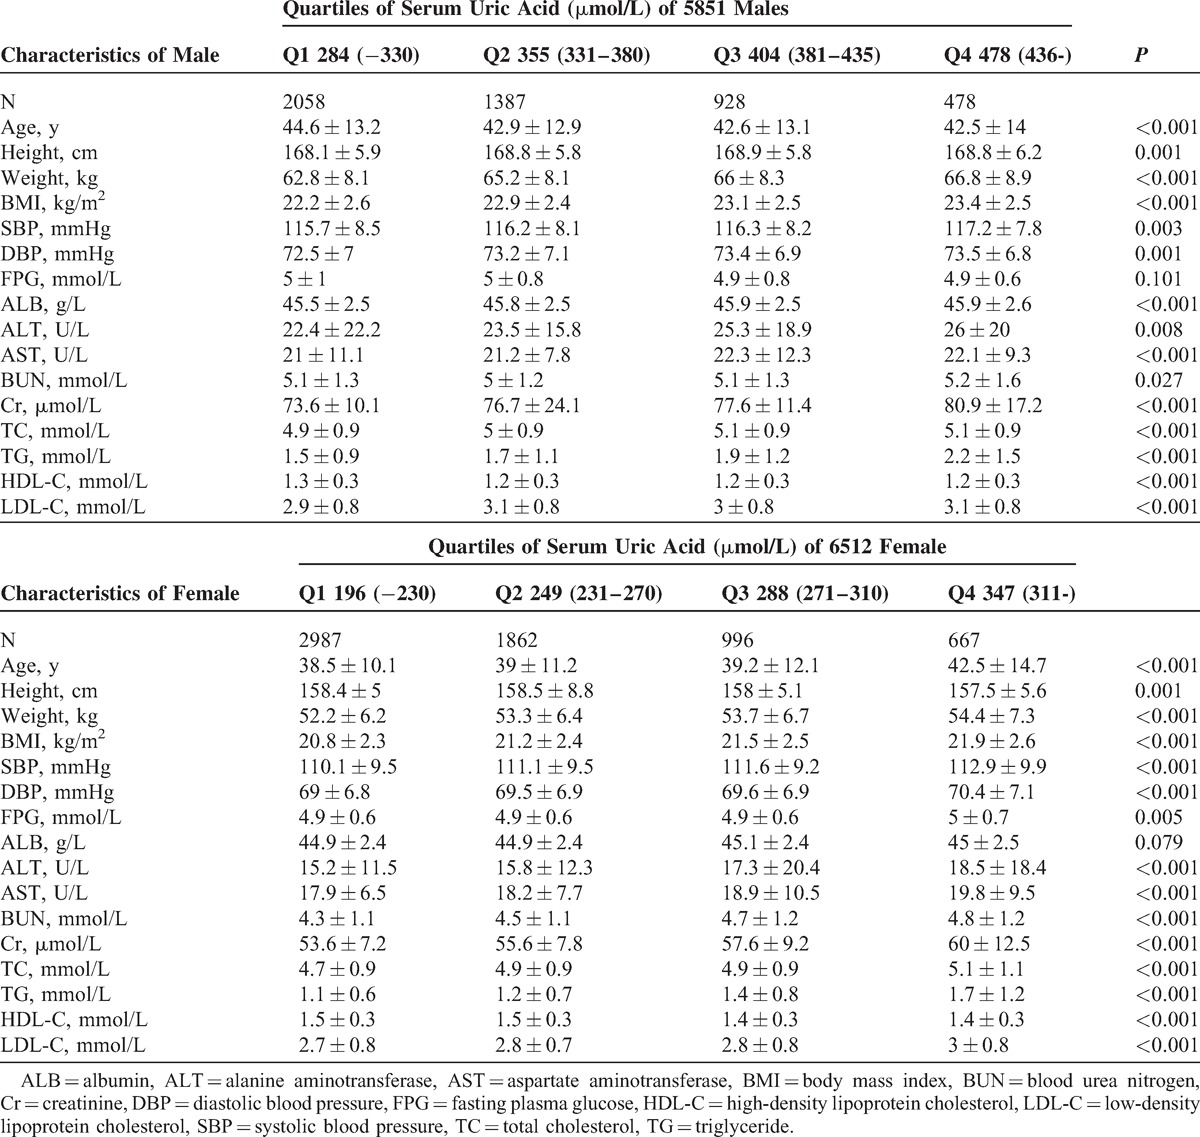
A total of 73,583 subjects who underwent annual health examination in the First Affiliated Hospital of Wenzhou Medical University and the Xinyu People's Hospital of Jiangxi Province were initially enrolled into the study. After exclusion of those individuals who did not meet the inclusion criteria (Fig. 1), 60,455 subjects remained for study. In the cross-sectional population, 49,092 eligible subjects were enrolled, including 26,682 males and 22,410 females, with a mean age of 42.7 ± 10.3 years and 41.7 ± 10.3 years, respectively. Table 1 shows the characteristics of study subjects according to their quartile measurements of sUA. Subjects with higher sUA concentrations exhibited higher prevalence of NAFLD. BMI, SBP, DBP, FPG, ALT, AST, BUN, Cr, TC, TG, LDL-C were significantly higher, whereas HDL-C was lower, among subjects with higher sUA levels. A total of 11,363 eligible subjects were enrolled in the longitudinal population, including 4851 males and 6512 females, with a mean age of 43.5 ± 13.2 years and 39.1 ± 11.6 years, respectively. The median follow-up time was 23.6 months. A similar change in the measured clinical characteristics was observed in this population. Details of the subjects according to quartile of sUA are presented in Table 2.
FIGURE 1.
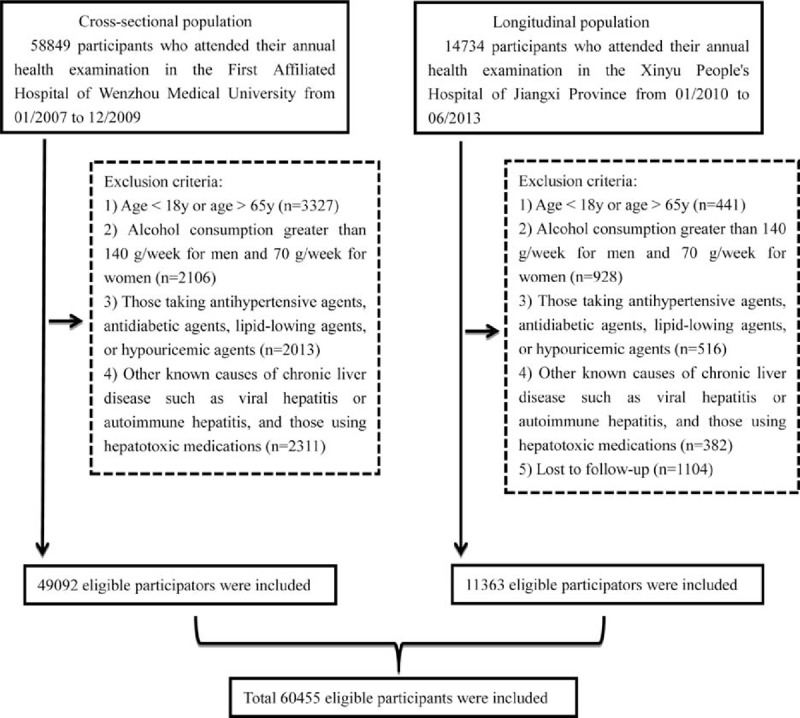
Study flow diagram. A total of 73,583 participants were enrolled initially, whereas 13,128 participants who did not meet the inclusion criteria were excluded. Finally, 60,455 individuals (49,092 in the cross-sectional population and 11,363 in the longitudinal population) were included.
TABLE 1.
Baseline Characteristics of Cross-sectional Population of 26,682 Males and 22,410 Females, Stratified by Quartiles of Serum Uric Acid
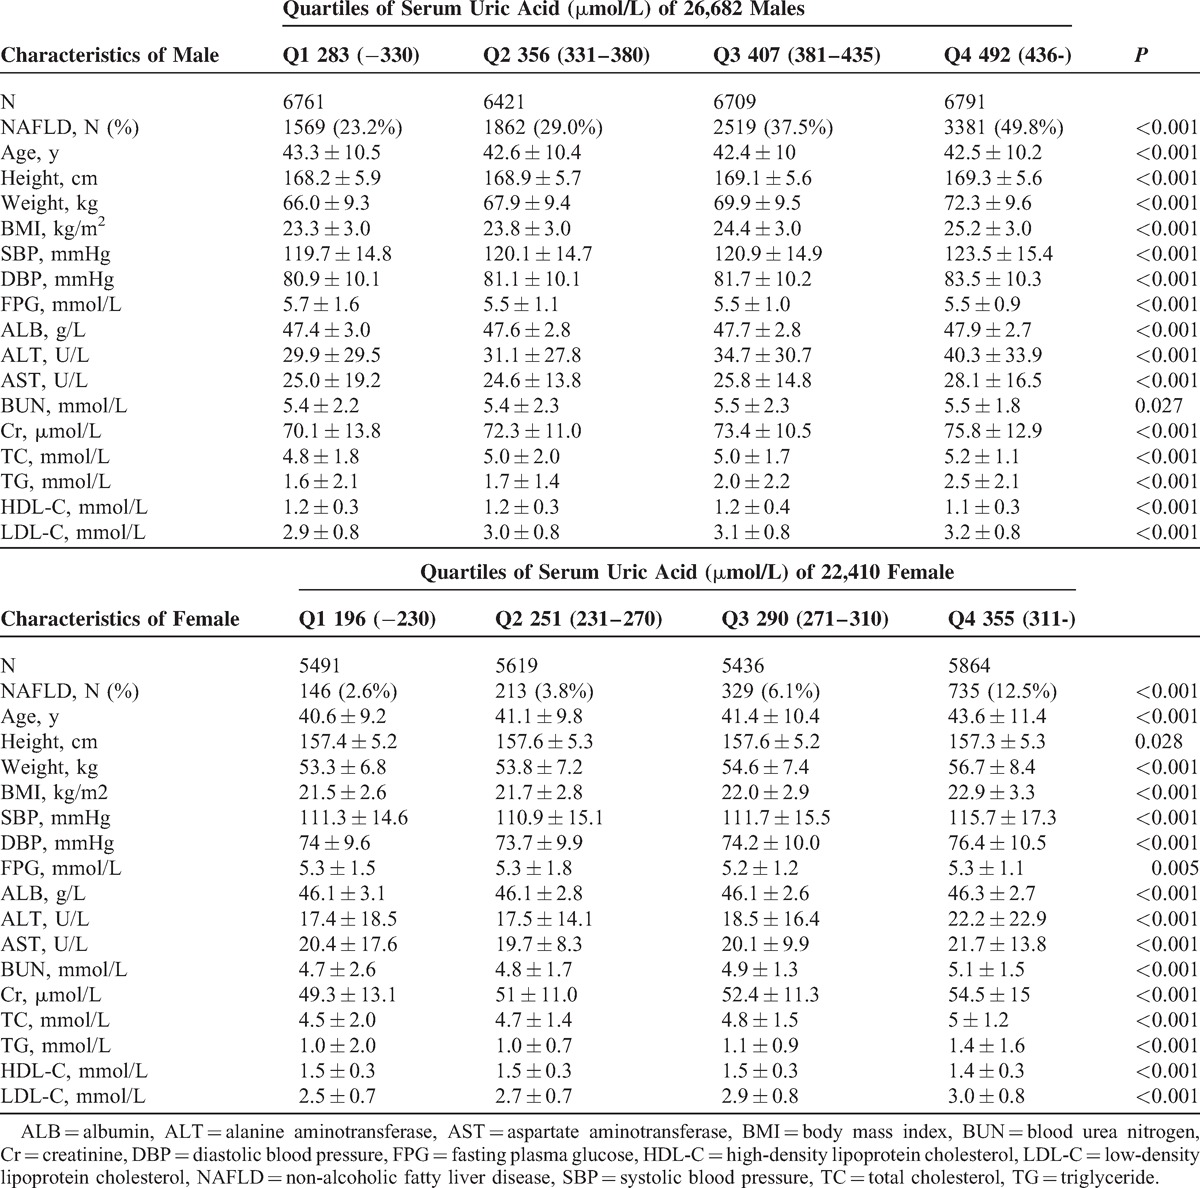
TABLE 2.
Baseline Characteristics of Longitudinal Population of 4851 Males and 6512 Females, Stratified by Quartiles of Serum Uric Acid
Higher sUA Level Related to Higher Prevalence of NAFLD
As shown in Table 1, the prevalence of NAFLD from Q1 to Q4 were 23.2%, 29.0%, 37.5%, and 49.8% in males and 2.6%, 3.8%, 6.1%, and 12.5% in females, respectively. To gain a deeper understanding of the relationship between sUA level and the prevalence of NAFLD, the ORs for NAFLD were calculated after adjusting for confounding variables. In model 1, compared with the subjects in Q1, the ORs for the subjects in Q2, Q3, and Q4 were 1.279 (95% CI 1.193–1.372), 1.882 (95% CI 1.762–2.011), and 2.962 (95% CI 2.781–3.155), respectively (all P values <0.001). Adjustment for age, sex, BMI, and SBP (model 2) substantially attenuated the magnitude of the ORs for NAFLD by approximately 2.3-folds when comparing the fourth with the first quartile of sUA level. Furthermore, the ORs for NAFLD were 1.221 (95%CI 1.1109–1.322), 1.519 (95% CI 1.395–1.654), and 1.903 (95% CI 1.748–2.072) for Q2, Q3, and Q4, respectively, in the fully adjusted model (Model 3). These results suggest that the subjects with higher sUA levels are more likely to develop NAFLD than individuals with lower sUA levels.
Figure 2 shows the ORs for NAFLD of Q2, Q3, and Q4 using the Q1 as the reference. A stratified analysis for risk factors of metabolic syndrome showed a successive increase in ORs for both males and females. Subjects had a significantly higher ORQ4vs.Q1 in females than in males in subgroups wherein BMI <25 kg/m2, HDL-C ≥1.03 mmol/L (male) or ≥1.3 mmol/L (female), BP <130/85 mmHg, and FPG ≥5.6 mmol/L, after adjusting for all confounding variables, indicating a stronger association between sUA and NAFLD in females. Although association between NAFLD and sUA were similar in both sexes in other subgroups, numerically higher ORs were observed in females.
FIGURE 2.
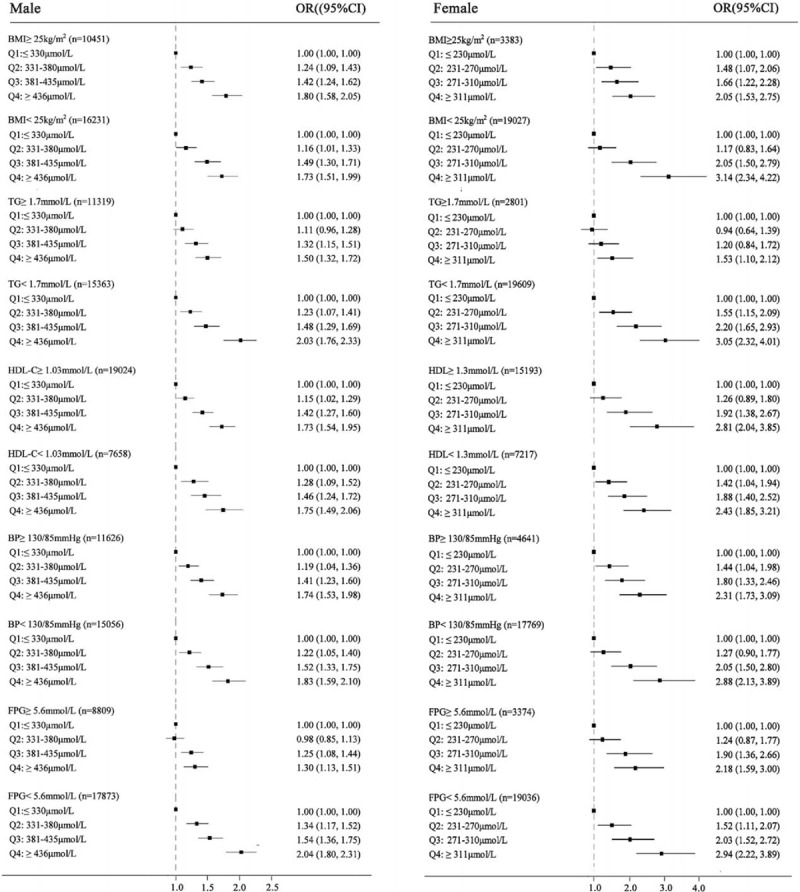
Forest plots of odds ratios (ORs) (95% confidence interval [CI]) for quartiles of serum uric acid in the cross-sectional population, stratified by sex. (A) male, (B) female. Confounding variables contained age, body mass index, systolic blood pressure, fasting plasma glucose, albumin, alanine aminotransferase, aspartate aminotransferase, blood urea nitrogen, creatinine, total cholesterol, triglyceride, high-density lipoprotein cholesterol, and low-density lipoprotein cholesterol.
Risk Factor Analysis for NAFLD in the Longitudinal Population
To identify whether sUA plays a sex-specific causal role in incidence of NAFLD, Cox proportional hazards regression and cumulative hazard functional analyses were performed. The HRs for incidence of NAFLD substantially increased with increasing concentrations of sUA. As shown in Table 3, compared with subjects in the lowest sUA quartile (Model 1), those subjects in the highest quartile had an HR of 2.851 (95% CI 2.380–3.415). Furthermore, in Model 2, adjusted for age, sex, BMI, and SBP, sUA levels in Q4 showed a attenuated HR of 1.877 (1.563–2.253) with that derived from Model 1. HRs from Model 3 were further decreased after adjusting for other known confounding variables across the range (Table 2). Compared with the reference group, those in subjects Q2, Q3, and Q4 had ORs of 1.127 (95% CI 0.956–1.330), 1.380 (95% CI 1.157–1.644), and 1.589 (95% CI 1.310–1.927) for NAFLD, respectively.
TABLE 3.
Adjusted Odds Ratio or Hazard Ratio (95% Confidence Interval) for Non-alcoholic Fatty Liver Disease According to Sex-specific Quartiles of Serum Uric Acid
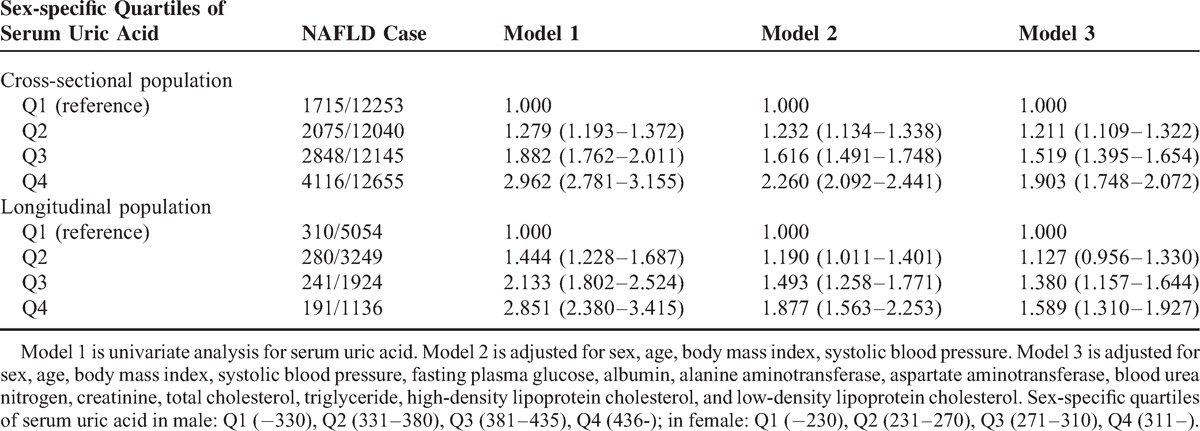
Figure 3 shows the cumulative hazard rate of NAFLD in the longitudinal population, stratified by sex-specific quartiles of sUA. The median follow-up of the entire cohort of subjects was 23.6 months (range 3–39 months). Details on the correlation of quartiles of SUA with incident of NAFLD are shown in Figure 3. At the time of the last follow-up, the actuarial incidence of NAFLD from Q1 to Q4 were 11.9%, 13.7%, 17.1%, and 21.8% in males and 2.9%, 4.8%, 8.2%, and 13.1% in females, respectively. Males had a higher incidence of NAFLD; however, the sUA level appeared to play a more crucial role on the development of NAFLD in females by a factor of 4.5-fold actuarial incidence enhancement (Q4 vs Q1), when compared with a 1.8-fold enhancement (Q4 vs Q1) in males.
FIGURE 3.
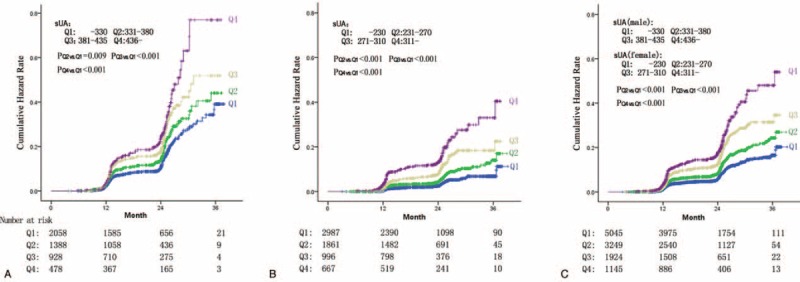
Incidence of nonalcoholic fatty liver disease (NAFLD) in the longitudinal population, stratified by sex-specific quartiles of serum uric acid. (A) Incidence of NAFLD in 4851 male subjects stratified by quartiles of serum uric acid. (B) Incidence of NAFLD in 6512 female subjects stratified by quartiles of serum uric acid. (C) Incidence of NAFLD in a total of 11,636 participators stratified by sex-specific quartiles of serum uric acid.
Sex-Specific Analysis for the Risk of NAFLD
In the next part of our study, we wished to determine whether the sUA quartile categorization could be applied to predict the incidence of NAFLD in a sex-specific manner. We also duplicated our analysis among the male and female subgroups. Interestingly, our results show that the OR increased more markedly in females. As described in Figure 4 A and B- in the cross-sectional population and when compared with the lowest sUA quartile (reference group), females with the highest quartile had an OR of 5.275 (95% CI 4.397–6.329), higher than that of 3.281 (95% CI 3.047–3.532) in males. After adjustment for BMI, SBP, FPG, ALT, AST, BUN, Cr, TC, TG, HDL-C, and LDL-C, the adjusted ORs for the highest versus the lowest quartile were 2.898 (95% CI 2.36–3.588) in females and 1.887 (95% CI 1.718–2.072) in males. Our assessment of the sex-specific association between quartiles of sUA and risk of NAFLD in the longitudinal population, as shown in Figure 4C and 4D, demonstrated a similar variation tendency of HR in both males and females.
FIGURE 4.
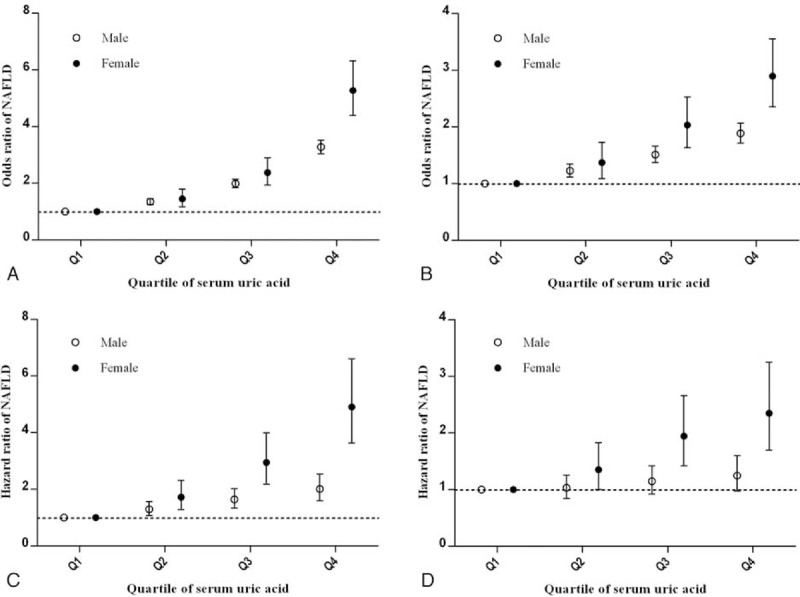
Unadjusted and adjusted odds ratios (ORs) and hazard ratios (HRs) for nonalcoholic fatty liver disease (NAFLD). Panels A and C showed the OR and HR of serum uric acid for NAFLD in the cross-sectional population and longitudinal population, respectively. Panels B and D showed the OR and HR of serum uric acid for NAFLD in the cross-sectional population and longitudinal population, respectively, adjusted for age, body mass index, systolic blood pressure, fasting plasma glucose, albumin, alanine aminotransferase, aspartate aminotransferase, blood urea nitrogen, creatinine, total cholesterol, triglyceride, high-density lipoprotein cholesterol, and low-density lipoprotein cholesterol.
DISCUSSION
To our knowledge, this is the first and largest study specifically aimed at evaluating the association between sex-specific sUA levels and NAFLD in a nationally representative sample of Chinese adults. In this study, we have presented data categorized according to sex-specific quartiles and we show significant sex difference in the distribution of sUA.19–21 The cross-sectional population that included 49,092 subjects showed that the prevalence of NAFLD was increased at higher sUA levels. To identify whether sUA is a risk factor actively involved in the development of NAFLD, we performed a prospective longitudinal population analysis that included 11,363 subjects who were initially NAFLD-free. We demonstrate that the elevation of sUA appears to make a significant contribution to an increased risk of developing NAFLD. Our results are in agreement with previous studies13–16,25; however, in those studies, sex difference was not fully considered. Our study shows that these associations between sUA levels and NAFLD may be applied to both males and females through sex-specific multivariate regression analysis. We demonstrated that an increase in the sUA level may be associated with a higher additional risk for NAFLD in females rather than in males.
One possible explanation for this relationship may be that the observations are simply confounded by a shared background of metabolic syndrome.16 Previous studies have shown that hyperinsulinemia may induce hyperuricemia by decreasing urinary excretion of uric acid and that hyperuricemia can result from the oxidative stress manifest in metabolic syndrome25–27 As NAFLD is a condition closely related to metabolic syndrome, it may partially explain why elevation of sUA appears to significantly increase the risk of NAFLD.
However, a significantly strong association between sUA levels and NAFLD was still observed after adjusting for the features of metabolic syndrome and other known confounding variables. The strong relationship between increased sUA levels and NAFLD raises the possibility that sUA overload might play some pathogenic role in the development of NAFLD. Yet, multiple studies have shown that sUA can act as a pro-oxidant and/or pro-inflammatory both in adipose tissue and in animal and cell culture models.28,29 An experimental study showed that sUA can induce inflammatory pathways, with activation of activator protein-1 and increased expression of cyclooxygenase-2 and monocyte chemoattractant protein-130 and this finding has been confirmed in a clinical research study, which included 957 subjects from Italy.31 A study showed that treatment with uric acid (UA) in obese ob/ob mice may lead to a nearly complete resolution of fatty liver, indicating that down-regulation of UA may play a protective role in NAFLD.32 Recently, Lanaspa et al33 presented the novel finding that sUA can directly stimulate hepatic fat accumulation and identified a mechanism that may involve the translocation of NADPH oxidase to the mitochondria with subsequent inactivation of aconitase, accumulation of citrate, and stimulation of fat synthesis. However, further studies investigating the role of sUA in NAFLD are required.
As previously known, hyperuricemia and gout affects males more commonly than females and there is a difference in UA levels of between 30–120 μmol/L between adult males and females.19,21 However, it was observed in our study that the relationship for prevalence and incidence of NAFLD in females with hyperuricemia was significantly greater than in males, after adjustment for known confounding variables. Previous studies have shown a significant association between baseline sUA and cardiovascular events in females, but not in males.22,34,35 Even though this differential effect appears a consistent finding across both sexes, it remains challenging to explain the underlying mechanism that may account for the sex difference in the results from our study. As NAFLD is a condition closely related to metabolic syndrome, a prospective study that may demonstrate a greater impact of hyperuricemia on the risk of metabolic syndrome in females versus males may support our observation.36 Hormonal differences may underlie any potential biochemical mechanism; however, this concept requires further investigation in the appropriate animal and cell culture models.19,22
Some limitations of our study merit comment. The main limitation is the lack of anthropometric parameters regarding central obesity (ie, waist/hip ratio), lifestyle, and dietary factors, which may be helpful to better understand the relationship between NAFLD and sUA levels. Further studies including more complete personal information were required. Secondly, the diagnosis of NAFLD was based on ultrasonography, with lower sensitivity and specificity versus liver biopsy. However, liver ultrasonography is widely used in epidemiological surveys of NAFLD, and several strengths of this technique include the non-invasive nature of the test and its safety, economical, and practical utility.
In conclusion, we have clearly demonstrated that sUA is a significant factor associated with the prevalence and development of NAFLD in our analyses in both a cross-sectional and longitudinal population. sUA levels appear to play a more crucial role on the prevalence and incidence of NAFLD in females than in males. Thus, sUA evaluation and control should be an integral component of clinical management of the general population, especially in females.
Acknowledgments
None.
Footnotes
Abbreviations: ALB = albumin, ALT = alanine aminotransferase, AST = aspartate aminotransferase, BMI = body mass index, BUN = blood urea nitrogen, CIs = confidence intervals, Cr = creatinine, DBP = diastolic blood pressure, FPG = fasting plasma glucose, HDL-C = high-density lipoprotein cholesterol, HRs = hazard ratios, LDL-C = low-density lipoprotein cholesterol, NAFLD = non-alcoholic fatty liver disease, ORs = odds ratios, SBP = systolic blood pressure, sUA = serum uric acid, TC = total cholesterol, TG = triglyceride.
Authors’ contributions: S-JW: study design, data collection and analysis, interpreted data, drafted the manuscript; G-QZ, data analysis and helped to draft the manuscript; B-ZY: data collection and analysis, interpreted data, prepared figures; F-QK: data collection and analysis; Z-XZ: data collection; HZ: data collection and analysis, interpretation of data; K-QS: data collection; LL: data collection; MB: helped to draft the manuscript; W-JH: study design; Y-PC: study design; M-HZ: study design, study supervision, obtained funding, and helped to draft the manuscript. All authors saw and approved the final version of the article.
This work was supported by grants from the Scientific Research Foundation of Wenzhou, Zhejiang Province, China (H20090014, Y20090269), Health Bureau of Zhejiang Province (2010KYB070), Research Foundation of Education Bureau of Zhejiang Province (Y201009942), Fresh Talent Program for Science and Technology Department of Zhejiang Province (2013R413018, 2013R413035 and 2013R413015), Research Funds for Tian Qing Liver Diseases (TQGB20120057) and Project of New Century 551 Talent Nurturing in Wenzhou.
The authors report no conflicts of interest.
REFERENCES
- 1.Day CP, Saksena S. Non-alcoholic steatohepatitis: definitions and pathogenesis. J Gastroenterol Hepatol 2002; 17 Suppl 3:S377–384. [DOI] [PubMed] [Google Scholar]
- 2.Jian-gao F, Chinese Liver Disease A. Guidelines for management of nonalcoholic fatty liver disease: an updated and revised edition. Zhonghua Gan Zang Bing 2010; 18:163–166. [PubMed] [Google Scholar]
- 3.Socha P, Wierzbicka A, Neuhoff-Murawska J, et al. Nonalcoholic fatty liver disease as a feature of the metabolic syndrome. Roczniki Panstwowego Zakladu Higieny 2007; 58:129–137. [PubMed] [Google Scholar]
- 4.Marchesini G, Brizi M, Bianchi G, et al. Nonalcoholic fatty liver disease: a feature of the metabolic syndrome. Diabetes 2001; 50:1844–1850. [DOI] [PubMed] [Google Scholar]
- 5.Amarapurkar DN, Hashimoto E, Lesmana LA, et al. How common is non-alcoholic fatty liver disease in the Asia-Pacific region and are there local differences? J Gastroenterol Hepatol 2007; 22:788–793. [DOI] [PubMed] [Google Scholar]
- 6.Bedogni G, Miglioli L, Masutti F, et al. Prevalence of and risk factors for nonalcoholic fatty liver disease: the Dionysos nutrition and liver study. Hepatology 2005; 42:44–52. [DOI] [PubMed] [Google Scholar]
- 7.Fan JG, Saibara T, Chitturi S, et al. What are the risk factors and settings for non-alcoholic fatty liver disease in Asia-Pacific? J Gastroenterol Hepatol 2007; 22:794–800. [DOI] [PubMed] [Google Scholar]
- 8.Fung J, Lee CK, Chan M, et al. High prevalence of non-alcoholic fatty liver disease in the Chinese - results from the Hong Kong liver health census. Liver Int 2015; 35:542–549. [DOI] [PubMed] [Google Scholar]
- 9.Ekstedt M, Hagstrom H, Nasr P, et al. Fibrosis stage is the strongest predictor for disease-specific mortality in NAFLD after up to 33 years of follow-up. Hepatology 2014; doi: 10.1002/hep.27368. [DOI] [PubMed] [Google Scholar]
- 10.Zoppini G, Fedeli U, Gennaro N, et al. Mortality from chronic liver diseases in diabetes. Am J Gastroenterol 2014; 109:1020–1025. [DOI] [PubMed] [Google Scholar]
- 11.Gustafsson D, Unwin R. The pathophysiology of hyperuricaemia and its possible relationship to cardiovascular disease, morbidity and mortality. BMC Nephrol 2013; 14:164. [DOI] [PMC free article] [PubMed] [Google Scholar]
- 12.Katsiki N, Karagiannis A, Athyros VG, et al. Hyperuricaemia: more than just a cause of gout? J Cardiovasc Med 2013; 14:397–402. [DOI] [PubMed] [Google Scholar]
- 13.Li Y, Xu C, Yu C, et al. Association of serum uric acid level with non-alcoholic fatty liver disease: a cross-sectional study. J Hepatol 2009; 50:1029–1034. [DOI] [PubMed] [Google Scholar]
- 14.Ryu S, Chang Y, Kim SG, et al. Serum uric acid levels predict incident nonalcoholic fatty liver disease in healthy Korean men. Metabolism 2011; 60:860–866. [DOI] [PubMed] [Google Scholar]
- 15.Hwang IC, Suh SY, Suh AR, et al. The relationship between normal serum uric acid and nonalcoholic fatty liver disease. J Korean Med Sci 2011; 26:386–391. [DOI] [PMC free article] [PubMed] [Google Scholar]
- 16.Sirota JC, McFann K, Targher G, et al. Elevated serum uric acid levels are associated with non-alcoholic fatty liver disease independently of metabolic syndrome features in the United States: Liver ultrasound data from the National Health and Nutrition Examination Survey. Metabolism 2013; 62:392–399. [DOI] [PMC free article] [PubMed] [Google Scholar]
- 17.Baba T, Amasaki Y, Soda M, et al. Fatty liver and uric acid levels predict incident coronary heart disease but not stroke among atomic bomb survivors in Nagasaki. Hypertens Res 2007; 30:823–829. [DOI] [PubMed] [Google Scholar]
- 18.Cardoso AS, Gonzaga NC, Medeiros CC, et al. Association of uric acid levels with components of metabolic syndrome and non-alcoholic fatty liver disease in overweight or obese children and adolescents. J Pediatr 2013; 89:412–418. [DOI] [PubMed] [Google Scholar]
- 19.Borges RL, Ribeiro AB, Zanella MT, et al. Uric acid as a factor in the metabolic syndrome. Curr Hypertens Rep 2010; 12:113–119. [DOI] [PubMed] [Google Scholar]
- 20.Culleton BF, Larson MG, Kannel WB, et al. Serum uric acid and risk for cardiovascular disease and death: the Framingham Heart Study. Ann Intern Med 1999; 131:7–13. [DOI] [PubMed] [Google Scholar]
- 21.Nicholls A, Snaith ML, Scott JT. Effect of oestrogen therapy on plasma and urinary levels of uric acid. Br Med J 1973; 1:449–451. [DOI] [PMC free article] [PubMed] [Google Scholar]
- 22.Kawamoto R, Tabara Y, Kohara K, et al. Serum uric acid is more strongly associated with impaired fasting glucose in women than in men from a community-dwelling population. PloS One 2013; 8:e65886. [DOI] [PMC free article] [PubMed] [Google Scholar]
- 23.Kim SY, Guevara JP, Kim KM, et al. Hyperuricemia and coronary heart disease: a systematic review and meta-analysis. Arth Care Res 2010; 62:170–180. [DOI] [PMC free article] [PubMed] [Google Scholar]
- 24.Farrell GC, Chitturi S, Lau GK, et al. Asia-Pacific Working Party on NAFLD. Guidelines for the assessment and management of non-alcoholic fatty liver disease in the Asia-Pacific region: executive summary. J Gastroenterol Hepatol 2007; 22:775–777. [DOI] [PubMed] [Google Scholar]
- 25.Xu C, Yu C, Xu L, et al. High serum uric acid increases the risk for nonalcoholic fatty liver disease: a prospective observational study. PloS One 2010; 5:e11578. [DOI] [PMC free article] [PubMed] [Google Scholar]
- 26.Waring WS, Webb DJ, Maxwell SR. Systemic uric acid administration increases serum antioxidant capacity in healthy volunteers. J Cardiovasc Pharmacol 2001; 38:365–371. [DOI] [PubMed] [Google Scholar]
- 27.Marangella M. Uric acid elimination in the urine. Pathophysiological implications. Contrib Nephrol 2005; 147:132–148. [DOI] [PubMed] [Google Scholar]
- 28.Baldwin W, McRae S, Marek G, et al. Hyperuricemia as a mediator of the proinflammatory endocrine imbalance in the adipose tissue in a murine model of the metabolic syndrome. Diabetes 2011; 60:1258–1269. [DOI] [PMC free article] [PubMed] [Google Scholar]
- 29.St George D. Nurse triage in accident and emergency departments. BMJ 1992; 304:1379. [DOI] [PMC free article] [PubMed] [Google Scholar]
- 30.Kanellis J, Watanabe S, Li JH, et al. Uric acid stimulates monocyte chemoattractant protein-1 production in vascular smooth muscle cells via mitogen-activated protein kinase and cyclooxygenase-2. Hypertension 2003; 41:1287–1293. [DOI] [PubMed] [Google Scholar]
- 31.Ruggiero C, Cherubini A, Ble A, et al. Uric acid and inflammatory markers. Eur Heart J 2006; 27:1174–1181. [DOI] [PMC free article] [PubMed] [Google Scholar]
- 32.Garcia-Ruiz I, Rodriguez-Juan C, Diaz-Sanjuan T, et al. Uric acid and anti-TNF antibody improve mitochondrial dysfunction in ob/ob mice. Hepatology 2006; 44:581–591. [DOI] [PubMed] [Google Scholar]
- 33.Lanaspa MA, Sanchez-Lozada LG, Choi YJ, et al. Uric acid induces hepatic steatosis by generation of mitochondrial oxidative stress: potential role in fructose-dependent and -independent fatty liver. J Biol Chem 2012; 287:40732–40744. [DOI] [PMC free article] [PubMed] [Google Scholar]
- 34.Hoieggen A, Alderman MH, Kjeldsen SE, et al. The impact of serum uric acid on cardiovascular outcomes in the LIFE study. Kidney Int 2004; 65:1041–1049. [DOI] [PubMed] [Google Scholar]
- 35.Fang J, Alderman MH. Serum uric acid and cardiovascular mortality the NHANES I epidemiologic follow-up study, 1971-1992. National Health and Nutrition Examination Survey. JAMA 2000; 283:2404–2410. [DOI] [PubMed] [Google Scholar]
- 36.Sui X, Church TS, Meriwether RA, et al. Uric acid and the development of metabolic syndrome in women and men. Metabolism 2008; 57:845–852. [DOI] [PMC free article] [PubMed] [Google Scholar]


