

Supplemental Digital Content is available in the text
Abstract
Clinical practice recommends eating ≥2.5 cups of fruits and vegetables (FVs) each day for cancer prevention, in which the evidence from epidemiological studies for the association between FVs intake and bladder cancer (BC) prevention is inconsistent.
We searched the PubMed, Embase, and Willy online Library for relevant studies published up to September 27, 2014. Prospective cohort studies investigated FVs intake, and the risk of BC with ≥3 categories of exposure was included. A dose-response meta-analysis was carried out to evaluate the association between FVs intake and risk of BC.
Fourteen cohorts with 17 studies including 9447 cases were identified. No evidence of nonlinear association was examined between FVs intake and risk of BC. The summarized relevant risk (RR) of every 0.2 serving increment a day was 1.00 (95%CI: 0.99, 1.00; P = 0.17; I2 = 41.7%; n = 14) for total fruits; 0.99 (95%CI: 0.96, 1.01; P = 0.28; I2 = 37.0%; n = 13) for total vegetables; and 0.99 (95%CI: 0.97, 1.01; P = 0.24; I2 = 57.5%; n = 8) for both FVs. In further analysis, we observed inverse association between every 0.2 serving increment of green leafy vegetables intake a day and risk of BC (RR = 0.98, 95%CI: 0.96, 0.99; I2 = 0.0%; P < 0.01; Power = 0.76; n = 6), but neither for cruciferous vegetables (RR = 0.97, 95%CI: 0.93, 1.01; P = 0.19; I2 = 55.8%; n = 8) nor for citrus (RR = 1.00, 95%CI: 1.00, 1.00; P = 0.83; I2 = 0.0%; n = 7). Subgroup analysis showed consistent results.
Little evidence supports a beneficial effect for total fruits, vegetables, both FVs, and citrus intake against bladder cancer. Green leafy vegetables may help prevent bladder cancer.
INTRODUCTION
Bladder cancer (BC) is the most common malignancy in the urinary tract.1 The incidence rate (age standardized) is about 9 per 10,000 for men and 2.2 for women worldwide.2 According to the newest data of International Agency for Research on Cancer, BC has reached to the 9th most common cancer all over the world (the 6th in men and the 19th in women).2
As the base layer of the food pyramid, fruits and vegetables (FVs) contain many vitamins, fibers, minerals, and other bioactive compounds may be beneficial for cancer prevention.3 Previous randomized controlled trials have suggested improved immune function, enhanced antioxidant status, and reduced oxidative DNA damage for people with high FVs diet.4–6 Evidence from meta-analysis also showed reduced risk of specified cancers (such as renal cancer) in the high FVs intake population.7,8 The American Cancer Society recommended eating ≥2.5 cups of vegetables and fruits each day for cancer prevention.9 However, whether FVs intake can help BC prevention is unknown.
Recently, 2 meta-analyses of observational studies concluded that intake of FVs were associated with reduced risk of BC.10,11 Another meta-analysis12 based on cohort studies detected no associations between FVs intake and risk of BC. However, neither the observational-study-based nor the cohort-study-based meta-analysis performed a sufficient literature search. Moreover, the result of observational-study-based meta-analysis may be confused by the recall bias of case–controls studies,13 and the methodology of the cohort-study-based meta-analysis showed some limitations, such as lack of interactions and sensitivity analysis. Thus, the relationship between FVs intake and BC, to data, still remains controversy.
We designed a more rigorous systematic review and dose-response meta-analysis based on prospective cohort studies to investigate the association between FVs intake and risk of BC.
MATERIALS AND METHODS
Our meta-analysis was designed following the preferred reporting items for systematic reviews and meta-analyses (PRISMA Compliant) statement.14 There are no ethical issues involved in our study for our data were based on published studies.
Literature Search
We searched the PubMed, Embase, and Willy online Library for relevant studies published up to September 27, 2014. The free text words “bladder neoplasm,” “bladder tumor,” “bladder cancer,” “bladder carcinoma,” “urothelium carcinoma,” “transitional cell carcinoma" and “fruit,” “vegetable,” “cruciferae,” “citrus” were used for the search without any restriction (see Table, Supplemental Digital Content 1, http://links.lww.com/MD/A258, which demonstrates the search details). We also checked the reference list of related studies, reviews or meta-analyses.
Eligibility Criteria
Publications that based on prospective cohort, case–cohort, or nested case–control design were only considered in present meta-analysis. The interested exposure was any type of FVs that with ≥3 quantitative exposure levels, for dose-response meta-analysis with restricted cubic splines (RCS) required ≥3 categories.15,16 Given that there were various kinds of FVs, we only focused on those investigated by ≥6 cohorts. For outcomes, primary BC or urothelial (transitional cell) carcinoma were permitted. Because a small number of urothelial carcinoma (<10%) was not originating in bladder,17 sensitivity analysis was used to see if this influences the results. Moreover, studies should report the case/noncase numbers, serving size, relative risk, and relevant 95% confidence intervals (CI) in each category. If not reported, such information should be calculated by the raw data or obtained by the authors. Grey literatures or meeting abstracts were not included.
We totally identified 3 types of exposure including total fruits (n = 14), vegetables (n = 13), both FVs (n = 8), and 3 subtypes of exposure including citrus (n = 7), green leafy vegetables (n = 6), and cruciferous vegetables (n = 8) that met our criteria.
Data Collection and Items
We used the relevant risks (RRs) to measure the association between FVs and BC. A standardized data collection sheet was designed before the extraction. Two reviewers, then, separately extracted the basic information (first author's name, publication year, country, populations, age distribution at entry, and follow-up years), interested data (type of FVs, numbers of cases and noncases or person-years, serving size, adjusted, or crude RRs with 95% CI in each category), and adjusted variables. When different types of adjusted RRs were presented, we extracted the one that controlled for the most confounders.18 Crude RRs were only extracted when no other one were given.18 If multiple measurements of FVs intake were reported, such as gram, serving, times, or cups, we used serving as a common scale. We assumed 68.1 g vegetables or 127.3 g fruits or 97.7 g (the mean value of FVs) FVs as one standard serving.19 Given that multiple publications may lead to reporting bias, we used the data of the study with the largest sample size or with higher quality.20 A third parity author checked the data.
We used the Newcastle-Ottawa Scale checklist for the assessment of the study quality.21 The check list contains 9 items for cohort studies with every item accounts for 1 point. We assumed low quality studies as with a score ≤4.22,23
Statistics Analysis
We conducted our dose-response meta-analysis by the methods of Greenland and Longnecker and Orsini et al.24,25 That is, an RCS function, with the log relative risk as independent variable and the exposure level as dependent variable, was used to fit the potential trend.26,27 The linear regression model was also nested within this function.28 Three knots at fixed 10th, 50th, and 90th percentiles of the exposure distribution were modeled.27 We assumed the coefficient of the second spline equal to zero to examine the probability of a nonlinearity relationship.27 Generalized least-square method was used to estimate the parameters,25 and then, the coefficients in each study were combined in a weighted random-effect model. We assigned the median values or middle point of each category to the corresponding relative risk for each study.29 For open-ended categories, we assumed the range to be the same as the adjacent interval.30 The method of Bekkering et al31 was used to evaluate the missing data if there were incomplete report. For studies reported the data by subsets (eg, men and women), we combined the corresponding RRs of the subsets in a fixed-effect model before pooling them into overall analysis.31
We conducted subgroup analysis on geographical location, length of follow-up (≥10 years and <10 years), primary unit of measurement, assumed for data or not, and controlled for energy or not to investigate the potential discrepancy among each subgroup. Since subgroup analysis may result in credibility lose,32 we reported our subgroup analysis following the Guidelines for Interpreting Subgroup Analysis.33 The interaction test was used to compare the two or more results among subgroups.34 The statistical power of positive results was evaluated by the method of Hedges and Pigott.35
We used Egger regression test to detect the potential small study effect in above analyses that with ≥10 cohorts.36–38 If evidence of asymmetry was detected, we used both fixed- and random-effect trim and fill method for an adjusted meta-analysis to examine whether the bias influence the results.38 Sensitivity analysis was used to test whether the results were robust. All analyses were conducted by Stata/SE12.0 (Stata Corp, College Station, TX, USA). A 2-side test with α=0.05 as significant level.
RESULTS
Figure 1 shows the detailed process of the literature inclusion. We first selected 19 studies39–57 that of interest. Two large cohort studies,56,57 one did not report valid data and another only reported the data of daily versus no FVs intake, were also excluded. We have contacted the authors for details, but got a reply that relevant data are no longer available.
FIGURE 1.
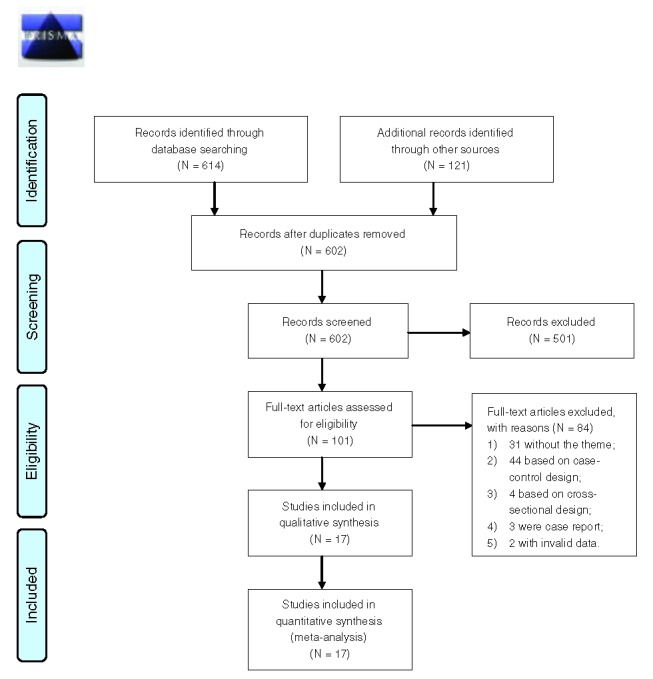
The flow diagram of the literature inclusion.
Of the remaining 17 studies, the studies from references39,49,55, were identified as the same cohort to articles,51,42,53 respectively. Finally, 14 cohorts met our eligibility criteria.
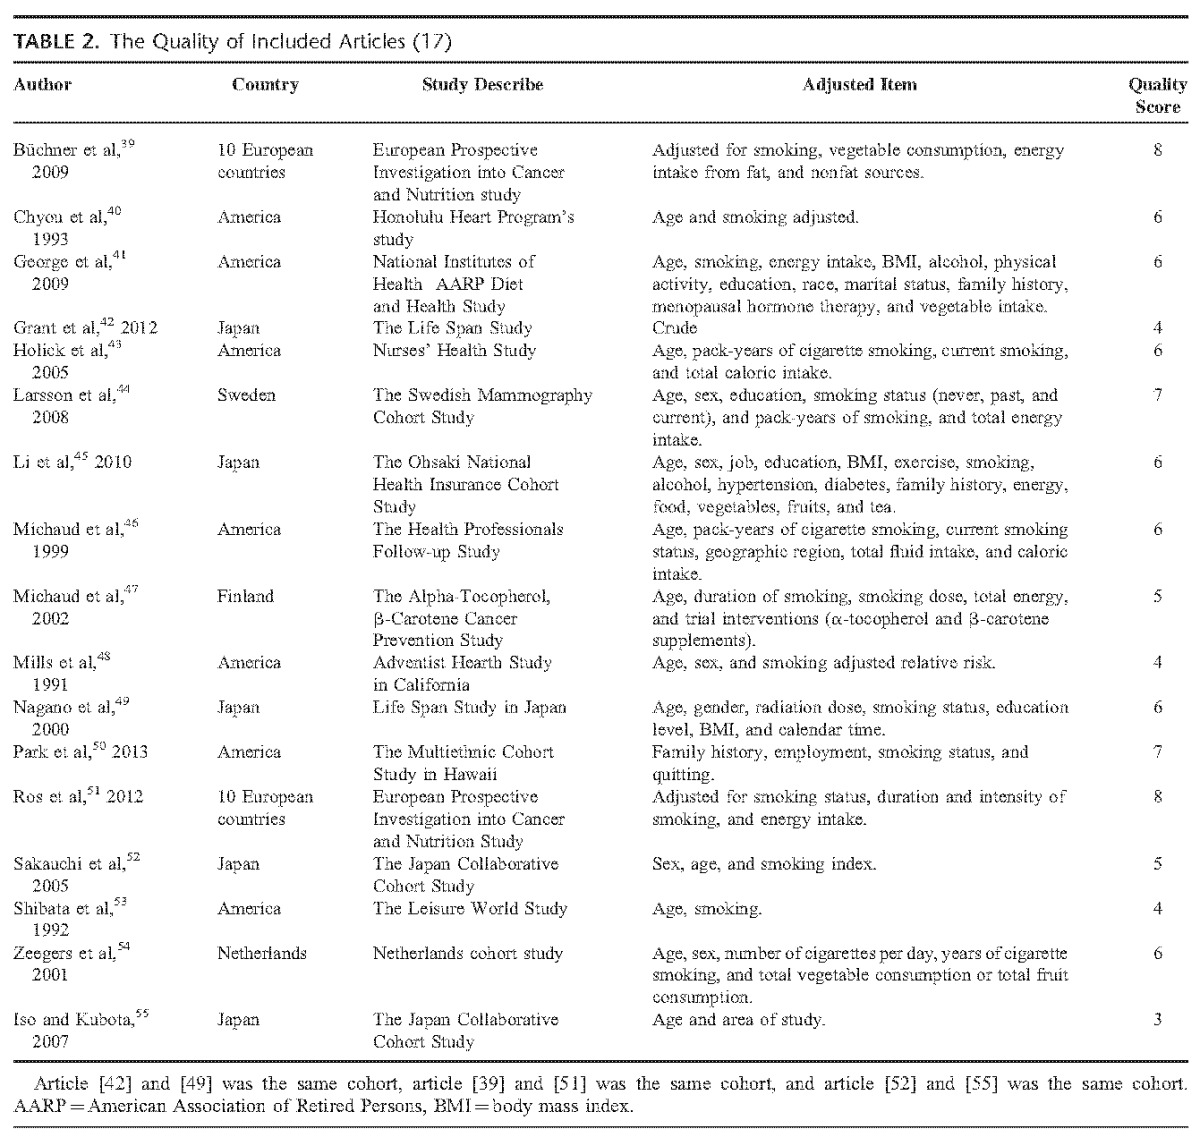
We assessed the quality of all the 17 studies. The scores range from 3 to 8, with a mean quality score was 5.7. Four studies42,48,53,55 were assessed as low quality (score ≤4).
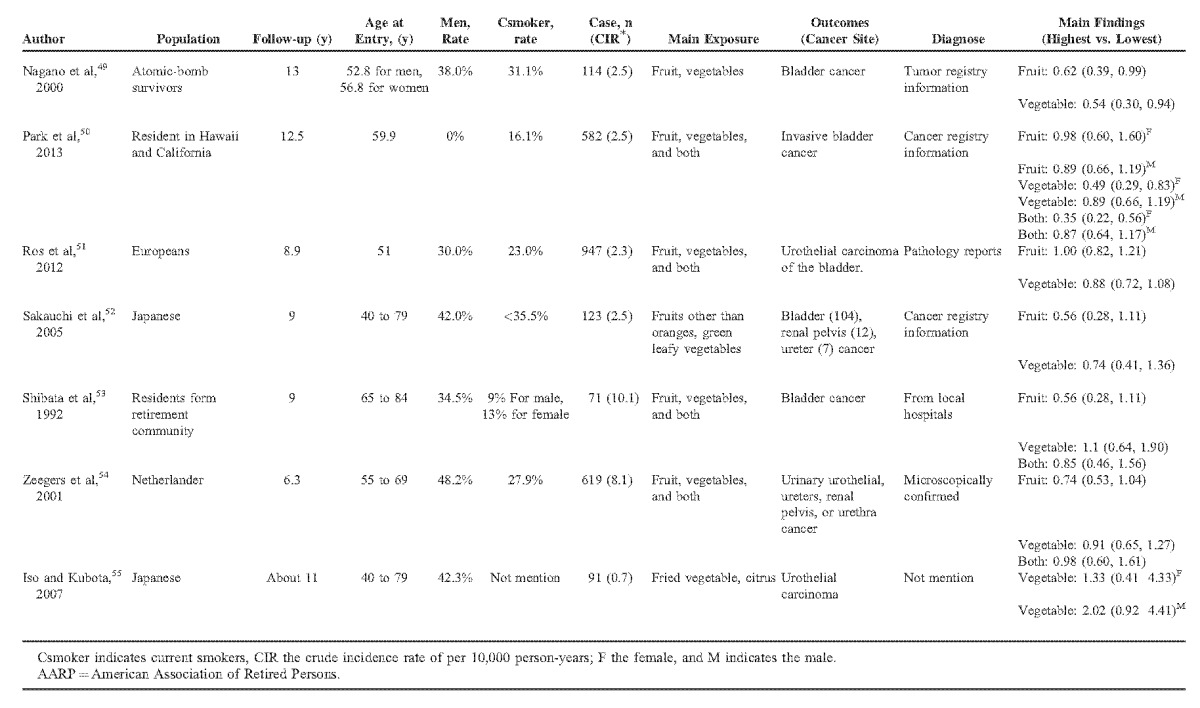
Apart from the duplicate articles, there were 9447 cases and 1 664 036 participants identified in our meta-analysis with a follow-up ranged from 6 to 20 years. The participants were distributed in European, American, and Asian. Tables 1 and Tables 2 show the main characteristics of the included studies.
TABLE 1.
Main Characteristic of 17 Included Cohort Studies
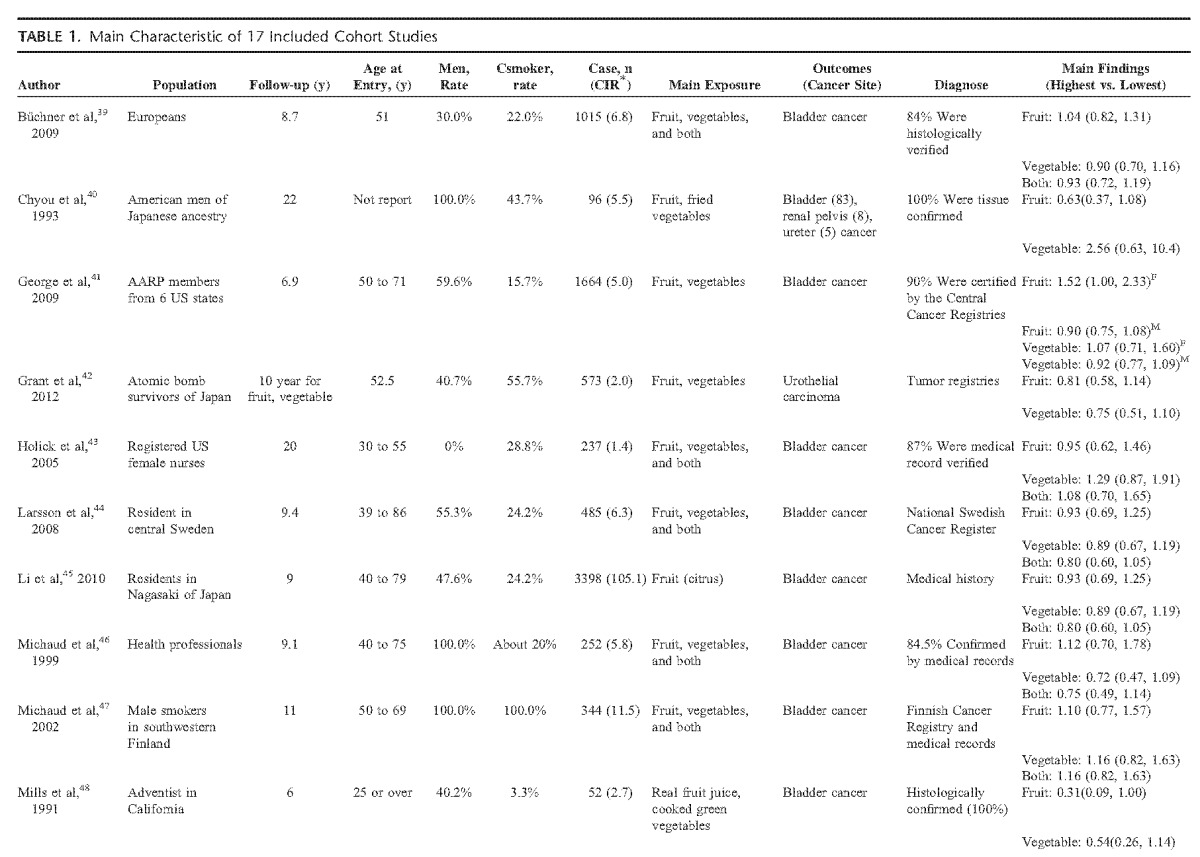
TABLE 1 (Continued).
Main Characteristic of 17 Included Cohort Studies
Fruit Intake and Risk of Bladder Cancer
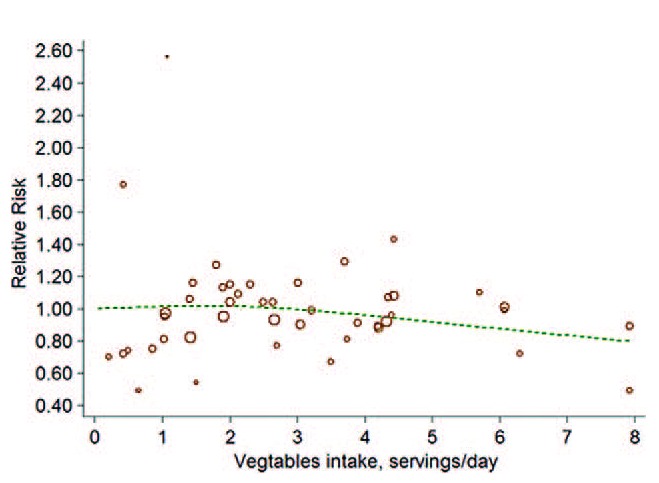
Fourteen cohorts including 17 studies39–55 investigated the association between total fruit intake and risk of BC. There were no evidence for a nonlinear association between them (P = 0.66 for nonlinearity test, Figure 2). We then used a linear regression model. The summarized RR of every 0.2 serving increment of total fruit intake a day was 0.99 (95%CI: 0.99, 1.00; P = 0.17; I2 = 43.1%; Figure 3).
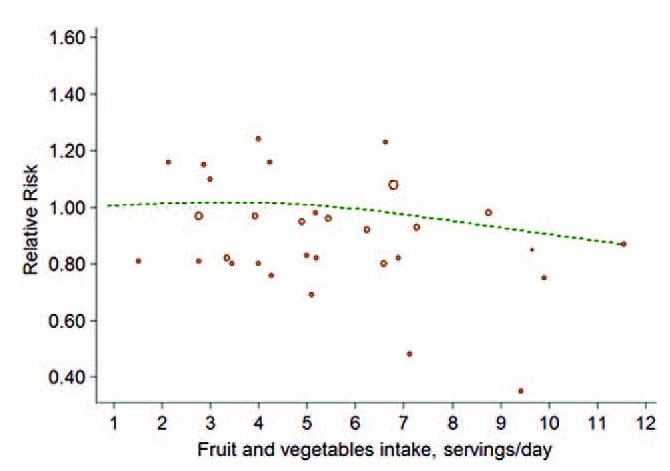
FIGURE 2.
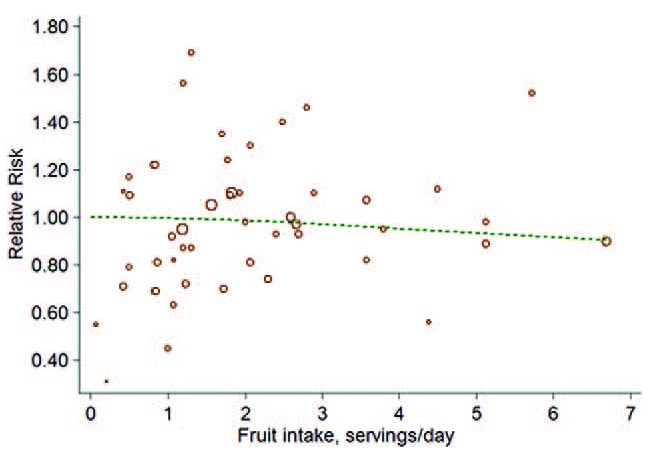
The forest plot of nonlinear association between total fruit intake and risk of bladder cancer. The hollow circles represent the relative ratios in each study weighted with inverse variance, and the green dash line is the nonlinear trend fitted by restricted cubic splines function.
FIGURE 3.
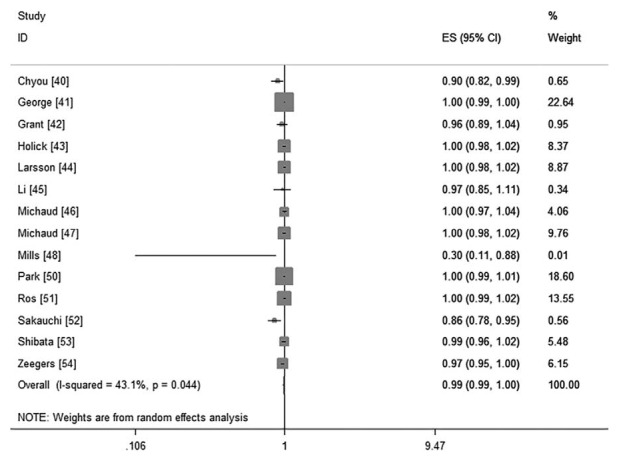
The forest plot of linear trend between total fruit intake and risk of bladder cancer, with the dose scale was every 0.2 serving increment.
Vegetable Intake and Risk of Bladder Cancer
Thirteen cohorts including 16 studies39–44,46–55 investigated the association between vegetables intake and risk of BC. Little evidence supported a nonlinear association between them (P for nonlinearity test was 0.20; Figure 4). The linear model, then, reached a pooled RR was 1.00 (95%CI: 0.99, 1.00; P = 0.28; I2 = 28.1%; Figure 5) for every 0.2 serving increment of total vegetables intake a day.
FIGURE 4.
The forest plot of nonlinear association between total vegetables intake and risk of bladder cancer. The hollow circles represent the relative ratios in each study weighted with inverse variance, and the green dash line is the nonlinear trend fitted by restricted cubic splines function.
FIGURE 5.
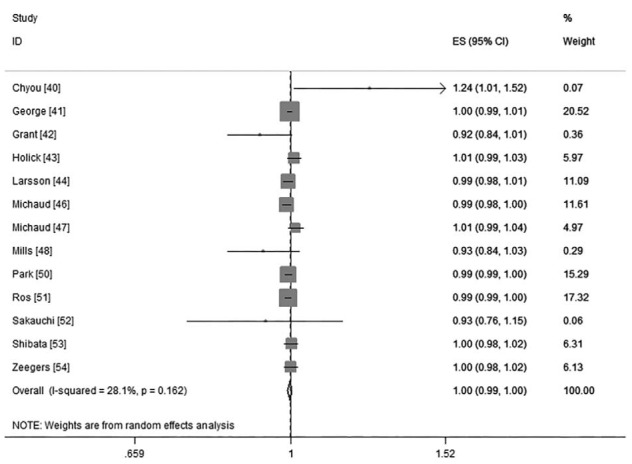
The forest plot of linear trend between total vegetables intake and risk of bladder cancer, with the dose scale was every 0.2 serving increment.
Both FVs Intake and Risk of Bladder Cancer
There were 8 cohorts39,43,44,46,47,50,53,54 investigated the association of both FVs intake on risk of BC. The combined RR was 0.99 (95%CI: 0.97, 1.01; P = 0.24; I2 = 57.5%; Figure 6) of every 0.2 serving increment of FVs intake a day. No evidence of nonlinearity association was examined (P for nonlinearity test was 0.25; Figure 7).
FIGURE 6.
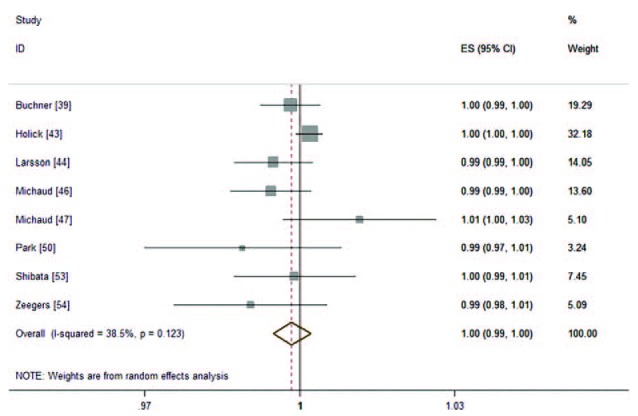
The forest plot of linear trend between both FVs intake and risk of bladder cancer, with the dose scale was every 0.2 serving increment.
FIGURE 7.
The forest plot of nonlinear association between both FVs intake and risk of bladder cancer. The hollow circles represent the relative ratios in each study weighted with inverse variance, and the green dash line is the nonlinear trend fitted by restricted cubic splines function.
Citrus, Cruciferous Vegetables, Green Leafy Vegetables and Risk of BC
Among the studies, there were seven43,44,45,51,52,54,55 cohorts reported citrus, eight43,44,46,47,50,51,52,54 reported cruciferous, six45,46,48,49,50,52 reported green leafy vegetables intake and risk of BC. Because several studies51,52,55 only reported linear association between citrus, cruciferous and risk of BC, we only pooled the linear trend (0.2 serving increment a day) for them.
For green leafy vegetables, no evidence of a nonlinear association was detected (P = 0.11), the pooled RRs of linear association (0.2 serving increment a day) were 0.98 (95%CI: 0.96, 0.99; P < 0.01; I2 = 0.0%; Power = 0.76; see Figure S1, Supplemental Digital Content 2, http://links.lww.com/MD/A258, which demonstrates the forest plot of results). For citrus, the summarized RR was 1.00 (95%CI: 1.00, 1.00; P = 0.83; I2 = 0.0%); for cruciferous vegetables, the pooled RR was 0.97 (95%CI: 0.93, 1.01; P = 0.19; I2 = 55.8%), respectively (see Figures S2 and S3, Supplemental Digital Content 2, http://links.lww.com/MD/A258, which demonstrate the forest plot of the results of citrus and cruciferous, respectively).
Subgroup Analysis and Sensitivity Analysis
Table 3 and Table S1 (see Table S1, Supplemental Digital Content 3, http://links.lww.com/MD/A258, which demonstrates the results of subgroup analysis of citrus, cruciferous, and green leafy vegetables) present the results of subgroup analysis. There were no substantial changes in each subgroup analysis. The interaction test showed no obvious discrepancy between subgroups.
TABLE 2 .
The Quality of Included Articles (17)
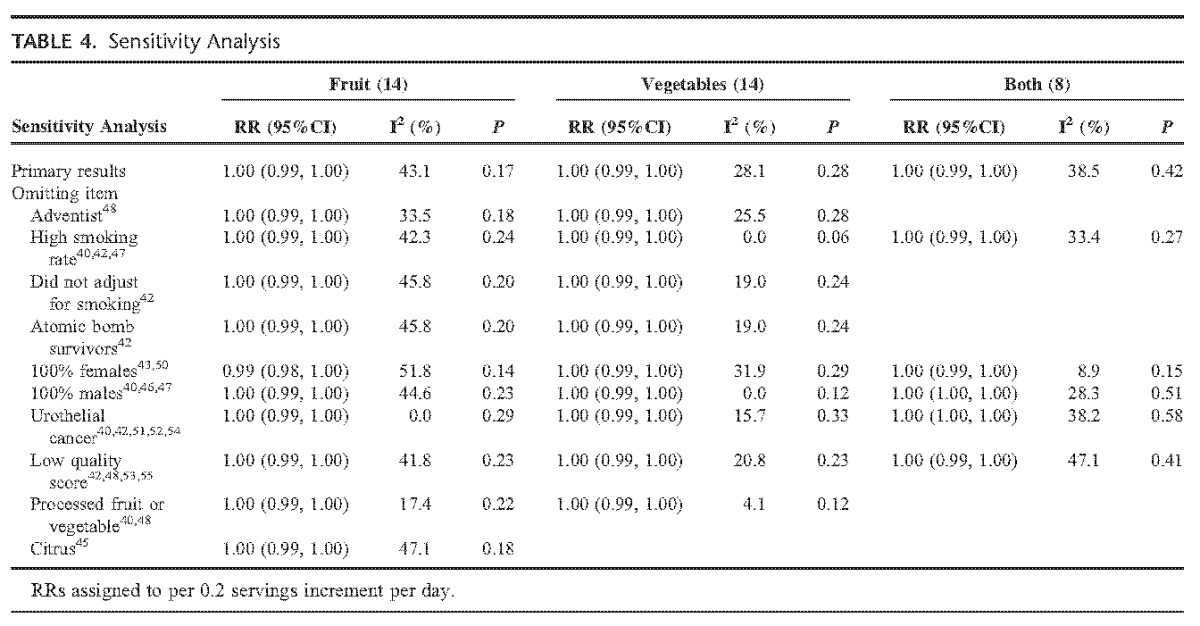
We conducted sensitivity analysis by omitting those studies with special population (such as Adventist), special exposure (such as fried vegetables, high smoking rate [>40%]), or low quality each time on a random-effect model to detect whether these confounders influence our results or not. Sensitivity analysis was also used to test the influence of individual studies on the overall results. After the omitting, for total fruits, vegetables, and both FVs intake, the summarized RRs of remaining studies kept consistency with before (Table 4). But for cruciferous intake, study47 influenced the result obviously. For green leafy vegetables intake, study50 influenced the result obviously (see Table S2, Supplemental Digital Content 3, http://links.lww.com/MD/A258, which demonstrates the results of sensitivity analyses of citrus, cruciferous, and green leafy vegetables).
TABLE 3.
Results of Subgroup Analysis of Total Fruits, Total Vegetables, and Both of Them (per 0.2 Serving Increment per Day)
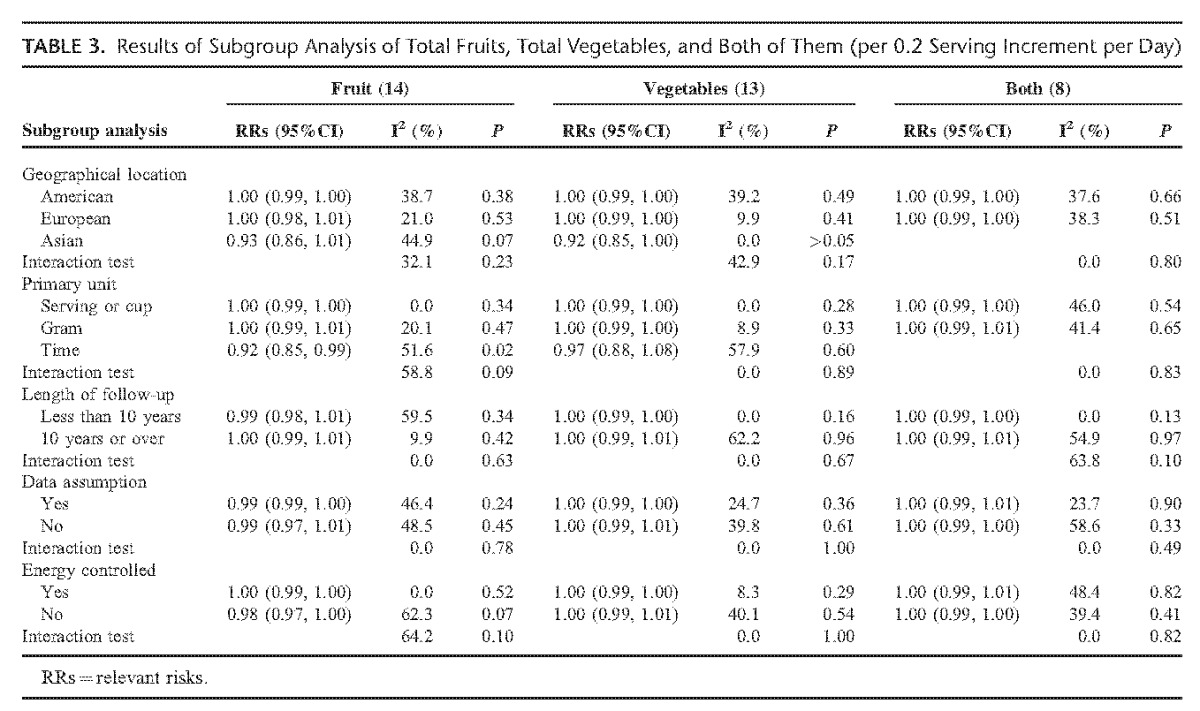
TABLE 4.
Sensitivity Analysis
Publication Bias
No evidence of publication bias was found in the analysis of vegetables intake (P = 0.93). However, we observed obvious asymmetry of the plot in fruit intake and risk of BC (P < 0.01). We then used the trim and fill method for an adjusted meta-analysis. Both fixed- and random-effect model showed stable results (RRfixed = 1.00, 95%CI: 0.99, 1.00, P = 0.14; RRrandom = 1.00, 95%CI: 0.99, 1.00, P = 0.17). (See Figures S4 and S5, Supplemental Digital Content 2, http://links.lww.com/MD/A258, which demonstrate the filled funnel plot for fruit intake and vegetables by trill and fill method.)
DISCUSSION
In present dose-response meta-analysis, we confirmed no associations between total fruits intake, vegetables intake, both FVs intake and risk of BC. We also found no obvious association between citrus, cruciferous vegetables intake and risk of BC. However, we observed inverse association between green leafy vegetables intake and risk of BC. That is, per 0.2 serving increment of daily green leafy vegetables intake is associated with 2% decrease of BC risk.
The results for total fruits, vegetables, and both FVs were credible. It is similar to another meta-analysis of cohort studies,12 although studies in the meta-analysis were insufficiently included. Our subgroup analysis and sensitivity analysis also showed consistent results, which supported the conclusions.
The results of cruciferous vegetables and green leafy vegetables should be treated with caution. In our meta-analysis, we analyzed some subtypes of fruits or vegetables and the risk of BC. We observed unstable results in cruciferous vegetables and green leafy vegetables when conducting sensitivity analysis. Study47,50 influenced the results of cruciferous and green leafy vegetables, respectively. Interestingly, the cases in reference47 were all males while in reference50 were all females. This suggested that, there were some differences between male and female of the prevention effect of some specific vegetables. But we have no sufficient, available data for further subgroup analysis by sex in our included studies. Another possibility may be that different stage or grade of BC may influence the results. We found that, in the study,50 the outcome was invasive BC. But there were no sufficient evidence to verify it since other studies did not subgroup the results by cancer stage or grade.
To our knowledge, this was the first meta-analysis that found green leafy vegetables were associated with reduced risk of BC. Although sensitivity analysis tested unstable result, we have evaluated the statistic power of it and it showed a reasonable amount of power (P = 0.76). We recommend a high green leafy vegetables diet instead of other types of FVs for BC prevention.
Green leafy vegetables contain high concentrations of vitamins such as β-carotene, ascorbic acid, and folic acid.58 These bioactivators are beneficial for immune function, antioxidant status and can protect DNA from oxidative damage4–6 which may help prevent BC. But it is hard to explain why total fruits or vegetables are not associated with reduced BC risk. Research has found that orange fruit is more effective than dark-green leafy vegetables in increasing serum concentrations of β-carotene.59 Further studies were needed.
We detected moderate heterogeneity in our meta-analysis. We found parts of the source of heterogeneity by sensitivity analysis. According to the results of sensitivity analysis, the outcomes, sex, processed fruits or vegetables (such as juice, cooked vegetables), and smoking status consist of the main source of heterogeneity. When omitting the studies with these characteristics, the heterogeneity reduced to a low level.
In our meta-analysis, we detected obvious asymmetry in publication bias analysis of fruit intake and risk of BC. However, our further trim and fill method showed no substantial changes of the results in both fixed- and random-effect model, which suggested that the asymmetry may not be caused by publication bias.
There were some limitations in present meta-analysis. First, smoking is the main risk factor for BC.1 We observed a borderline statistical significant result (P = 0.06) in vegetables when omitting the population with high current smoking rate (>40%), which suggested that smoking may influence our results. Some studies have reported the association between smoker and nonsmoker intake of fruits or vegetables and risk of BC; but we did not pool the results for there were limited studies (n ≤ 5). The influence of smoking on our results should be treated with caution. Second, there did have selection bias in our dose-response meta-analysis—we excluded 2 cohort studies56,57 with the data were not available that may influence our results. Third, as for analyses that with <10 studies, we did not test the publication bias, the influence of publication bias on the results should be noted. Fourth, we did not test the nonlinearity association between citrus, cruciferous vegetables and risk of BC since there were several studies only reported the linear association, which may lead to reporting bias. Moreover, the cases of included studies were only distributed in European, America, and Asian; so, the results of our meta-analysis may suit better for these areas.
CONCLUSIONS
Current published evidence suggests no association between fruits intake, vegetables intake, both FVs intake and risk of BC. No evidence support citrus is benefit for BC prevention. The effect of cruciferous vegetables on BC prevention is inconsistent. Green leafy vegetables may be associated with reduced risk of BC. Studies should provide more detailed data for further analysis.
Acknowledgment
We thank Prof. Kwong Joey Sum Wing for providing statistical consultation for our meta-analysis.
Footnotes
Abbreviations: BC = bladder cancer, CI = confidence intervals, FVs = fruits and vegetables, RCS = restricted cubic splines, RRs = relevant risks.
X-TZ and T-ZL contributed equally to this work.
Study design: CX, T-ZL; Statistical analysis: CX, X-TZ; Literature search and data extraction: CZ, Z-HY; Drafting the manuscript: CX, T-ZL; Interpretation of data: X-TZ; Revise the manuscript: SL; Check the data: X-YC.
The authors have declared no conflicts of interest.
Supplemental digital content is available for this article. Direct URL citations appear in the printed text and are provided in the HTML and PDF versions of this article on the journal's Website (www.md-journal.com).
REFERENCES
- 1.Babjuk M, Burger M, Zigeuner R, et al. Guidelines on non-muscle-invasive urothelial carcinoma of the bladder: update 2013. Eur Urol 2013; 64:639–653. [DOI] [PubMed] [Google Scholar]
- 2.Ferlay J, Soerjomataram I, Dikshit R, et al. Cancer incidence and mortality worldwide: sources, methods and major patterns in GLOBOCAN 2012. Int J Cancer 2015; 136:E359–E386. [DOI] [PubMed] [Google Scholar]
- 3.World Cancer Research Fund/American Institute for Cancer Research. Food, Nutrition, Physical Activity, and the Prevention of Cancer: A Global Perspective. Washington, DC: World Cancer Research Fund/American Institute for Cancer Research, 2007. http://discovery.ucl.ac.uk/4841/1/4841.pdf Accessed December 2014. [Google Scholar]
- 4.Gibson A, Edgar JD, Neville CE, et al. Effect of fruit and vegetable consumption on immune function in older people: a randomized controlled trial. Am J Clin Nutr 2012; 96:1429–1436. [DOI] [PubMed] [Google Scholar]
- 5.Bub A, Watzl B, Blockhaus M, et al. Fruit juice consumption modulates antioxidative status, immune status and DNA damage. J Nutr Biochem 2003; 14:90–98. [DOI] [PubMed] [Google Scholar]
- 6.Watzl B, Bub A, Brandstetter BR, et al. Modulation of human T-lymphocyte functions by the consumption of carotenoid-rich vegetables. Br J Nutr 1999; 82:383–389. [DOI] [PubMed] [Google Scholar]
- 7.Lee JE, Männistö S, Spiegelman D, et al. Intakes of fruit, vegetables, and carotenoids and renal cell cancer risk: a pooled analysis of 13 prospective studies. Cancer Epidemiol Biomarkers Prev 2009; 18:1730–1739. [DOI] [PMC free article] [PubMed] [Google Scholar]
- 8.Aune D, Lau R, Chan DSM, et al. Nonlinear reduction in risk for colorectal cancer by fruit and vegetable intake based on meta-analysis of prospective studies. Gastroenterology 2011; 141:16–20. [DOI] [PubMed] [Google Scholar]
- 9.Kushi LH, Doyle C, McCullough M, et al. American Cancer Society Guidelines on nutrition and physical activity for cancer prevention: reducing the risk of cancer with healthy food choices and physical activity. CA Cancer J Clin 2012; 62:30–67. [DOI] [PubMed] [Google Scholar]
- 10.Liu H, Wang XC, Hu GH, et al. Fruit and vegetable consumption and risk of bladder cancer: an updated meta-analysis of observational studies. Eur J Cancer Prev 2015; (in press). PMID: 25642791. [DOI] [PubMed] [Google Scholar]
- 11.Yao BD, Yan YJ, Ye XW, et al. Intake of fruit and vegetables and risk of bladder cancer: a dose–response meta-analysis of observational studies. Cancer Causes Control 2014; 25:1645–1658. [DOI] [PubMed] [Google Scholar]
- 12.Vieira AR, Vingeliene S, Chan DS, et al. Fruits, vegetables, and bladder cancer risk: a systematic review and meta-analysis. Cancer Med 2014; 4:136–146. [DOI] [PMC free article] [PubMed] [Google Scholar]
- 13.Sedgwick P. What is recall bias? BMJ 2012; 344:e3519. [Google Scholar]
- 14.Moher D, Liberati A, Tetzlaff J, et al. Preferred reporting items for systematic reviews and meta-analyses: the PRISMA statement. BMJ 2009; 339:b2535. [DOI] [PMC free article] [PubMed] [Google Scholar]
- 15.Luan NN, Wu L, Gong TT, et al. Nonlinear reduction in risk for colorectal cancer by oral contraceptive use: a meta-analysis of epidemiological studies. Cancer Causes Control 2015; 26:65–78. [DOI] [PubMed] [Google Scholar]
- 16.Guan HB, Wu L, Wu QJ, et al. Parity and pancreatic cancer risk: a dose-response meta-analysis of epidemiologic studies. PLoS One 2014; 9:e92738. [DOI] [PMC free article] [PubMed] [Google Scholar]
- 17.National Comprehensive Cancer Network (NCCN). NCCN clinical practice guidelines in Oncology. Bladder cancer version 2 2014. National Comprehensive Cancer Network, 2014. http://www.nccn.org/professionals/physician_gls/PDF/bladder.pdf Accessed December 2014. [Google Scholar]
- 18.Bekkering GE, Harris RJ, Thomas S, et al. How much of the data published in observational studies of the association between diet and prostate or bladder cancer is usable for meta-analysis? Am J Epidemiol 2008; 167:1017–1026. [DOI] [PubMed] [Google Scholar]
- 19.Agudo A/WHO. Measuring intake of fruit and vegetables, 2005. http://www.who.int/dietphysicalactivity/publications/f&v_intake_measurement.pdf Accessed December 2014. [Google Scholar]
- 20.Kuang D, Chen W, Song YZ, et al. Association between the HSPA1B ± 1267A/G polymorphism and cancer risk: a meta-analysis of 14 case-control studies. Asian Pac J Cancer Prev 2014; 15:6855–6861. [DOI] [PubMed] [Google Scholar]
- 21.Wells GA, Shea B, O’Connell D, Rabello A. The Newcastle-Ottawa Scale (NOS) for assessing the quality of nonrandomised studies in meta-analyses. 2011. http://www.ohri.ca/programs/clinical_epidemiology/oxford.asp Accessed December 2014. [Google Scholar]
- 22.Yeung WC, Rawlinson WD, Craig ME. Enterovirus infection and type 1 diabetes mellitus: systematic review and meta-analysis of observational molecular studies. BMJ 2011; 342:d35. [DOI] [PMC free article] [PubMed] [Google Scholar]
- 23.Wu L, Jiang Z, Li C, et al. Prediction of heart rate variability on cardiac sudden death in heart failure patients: a systematic review. Int J Cardiol 2014; 174:857–860. [DOI] [PMC free article] [PubMed] [Google Scholar]
- 24.Greenland S, Longnecker MP. Methods for trend estimation from summarized dose-response data, with applications to meta-analysis. Am J Epidemiol 1992; 135:1301–1309. [DOI] [PubMed] [Google Scholar]
- 25.Orsini N, Bellocco R, Greenland S. Generalized least squares for trend estimation of summarized dose-response data. Stata J 2005; 6:40–57. [Google Scholar]
- 26.Orsini N, Li R, Wolk A, et al. Meta-analysis for linear and nonlinear dose-response relations: examples, an evaluation of approximations, and software. Am J Epidemiol 2012; 175:66–73. [DOI] [PMC free article] [PubMed] [Google Scholar]
- 27.Orsini N. Multivariate dose-response meta-analysis: an update on glst. Nordic and Baltic Users Group meeting, Stockholm, Sweden 2013 Available at://www.stata.com/meeting/nordic-and-baltic13/abst Accessed December 2014. [Google Scholar]
- 28.Orsini N. A procedure to tabulate and plot results after flexible modeling of a quantitative covariate. Stata J 2011; 11:1–29. [Google Scholar]
- 29.Berlin JA, Longnecker MP, Greenland S. Meta-analysis of epidemiologic dose-response data. Epidemiology 1993; 4:218–228. [DOI] [PubMed] [Google Scholar]
- 30.Aune D, Saugstad OD, Henriksen T, et al. Maternal body mass index and the risk of fetal death stillbirth, and infant death: a systematic review and meta-analysis. JAMA 2014; 311:1536–1546. [DOI] [PubMed] [Google Scholar]
- 31.Bekkering GE, Harris RJ, Thomas S, et al. How much of the data published in observational studies of the association between diet and prostate or bladder cancer is usable for meta-analysis? Am J Epidemiol 2008; 167:1017–1026. [DOI] [PubMed] [Google Scholar]
- 32.Sun X, Briel M, Walter SD, et al. Is a subgroup effect believable? Updating criteria to evaluate the credibility of subgroup analyses. BMJ 2010; 340:c117. [DOI] [PubMed] [Google Scholar]
- 33.Sun X, Ioannidis JP, Agoritsas T, et al. How to use a subgroup analysis: users’ guide to the medical literature. JAMA 2014; 311:405–411. [DOI] [PubMed] [Google Scholar]
- 34.Altman DG, Bland JM. Interaction revisited: the difference between two estimates. BMJ 2003; 326:219. [DOI] [PMC free article] [PubMed] [Google Scholar]
- 35.Hedges LV, Pigott TD. The power of statistical tests in meta-analysis. Psychol Methods 2001; 6:203–217. [PubMed] [Google Scholar]
- 36.Egger M, Davey Smith G, Schneider M, et al. Bias in meta-analysis detected by a simple, graphical test. BMJ 1997; 315:629–634. [DOI] [PMC free article] [PubMed] [Google Scholar]
- 37.Sterne JAC, Gavaghan D, Egger M. Publication and related bias in meta-analysis: power of statistical tests and prevalence in the literature. J Clin Epidemiol 2000; 53:1119–1129. [DOI] [PubMed] [Google Scholar]
- 38.Peters JL, Sutton AJ, Jones DR, et al. Performance of the trim and fill method in the presence of publication bias and between-study heterogeneity. Stat Med 2007; 26:4544–4562. [DOI] [PubMed] [Google Scholar]
- 39.Büchner FL, Bueno-de-Mesquita HB, Ros MM, et al. Consumption of vegetables and fruit and the risk of bladder cancer in the European Prospective Investigation into Cancer and Nutrition. Int J Cancer 2009; 125:2643–2651. [DOI] [PubMed] [Google Scholar]
- 40.Chyou PH, Nomura AM, Stemmermann GN. A prospective study of diet, smoking, and lower urinary tract cancer. Ann Epidemiol 1993; 3:211–216. [DOI] [PubMed] [Google Scholar]
- 41.George SM, Park Y, Leitzmann MF, et al. Fruit and vegetable intake and risk of cancer: a prospective cohort study. Am J Clin Nutr 2009; 89:347–353. [DOI] [PMC free article] [PubMed] [Google Scholar]
- 42.Grant EJ, Ozasa K, Preston DL, et al. Effects of radiation and lifestyle factors on risks of urothelial carcinoma in the Life Span Study of atomic bomb survivors. Radiat Res 2012; 178:86–98. [DOI] [PubMed] [Google Scholar]
- 43.Holick CN, De Vivo I, Feskanich D, et al. Intake of fruits and vegetables, carotenoids, folate, and vitamins A, C, E and risk of bladder cancer among women (United States). Cancer Causes Control 2005; 16:1135–1145. [DOI] [PubMed] [Google Scholar]
- 44.Larsson SC, Andersson SO, Johansson JE, et al. Fruit and vegetable consumption and risk of bladder cancer: a prospective cohort study. Cancer Epidemiol Biomarkers Prev 2008; 17:2519–2522. [DOI] [PubMed] [Google Scholar]
- 45.Li WQ, Kuriyama S, Li Q, et al. Citrus consumption and cancer incidence: the Ohsaki cohort study. Int J Cancer 2010; 127:1913–1922. [DOI] [PubMed] [Google Scholar]
- 46.Michaud DS, Spiegelman D, Clinton SK, et al. Fruit and vegetable intake and incidence of bladder cancer in a male prospective cohort. J Natl Cancer Inst 1999; 91:605–613. [DOI] [PubMed] [Google Scholar]
- 47.Michaud DS, Pietinen P, Taylor PR, et al. Intakes of fruits and vegetables, carotenoids and vitamins A, E, C in relation to the risk of bladder cancer in the ATBC cohort study. Br J Cancer 2002; 87:960–965. [DOI] [PMC free article] [PubMed] [Google Scholar]
- 48.Mills PK, Beeson WL, Phillips RL, et al. Bladder cancer in a low risk population: results from the Adventist Health Study. Am J Epidemiol 1991; 133:230–239. [DOI] [PubMed] [Google Scholar]
- 49.Nagano J, Kono S, Preston DL, et al. Bladder-cancer incidence in relation to vegetable and fruit consumption: a prospective study of atomic-bomb survivors. Int J Cancer 2000; 86:132–138. [DOI] [PubMed] [Google Scholar]
- 50.Park SY, Ollberding NJ, Woolcott CG, et al. Fruit and vegetable intakes are associated with lower risk of bladder cancer among women in the Multiethnic Cohort Study. J Nutr 2013; 143:1283–1292. [DOI] [PMC free article] [PubMed] [Google Scholar]
- 51.Ros MM, Bueno-de-Mesquita HB, Kampman E, et al. Fruit and vegetable consumption and risk of aggressive and non-aggressive urothelial cell carcinomas in the European Prospective Investigation into Cancer and Nutrition. Eur J Cancer 2012; 48:3267–3277. [DOI] [PubMed] [Google Scholar]
- 52.Sakauchi F, Mori M, Washio M, et al. Dietary habits and risk of urothelial cancer incidence in the JACC Study. J Epidemiol 2005; 15:S190–S195. [DOI] [PMC free article] [PubMed] [Google Scholar]
- 53.Shibata A, Paganini-Hill A, Ross RK, et al. Intake of vegetables, fruits, beta-carotene, vitamin C and vitamin supplements and cancer incidence among the elderly: a prospective study. Br J Cancer 1992; 66:673–679. [DOI] [PMC free article] [PubMed] [Google Scholar]
- 54.Zeegers MP, Goldbohm RA, van den Brandt PA. Consumption of vegetables and fruits and urothelial cancer incidence: a prospective study. Cancer Epidemiol Biomarkers Prev 2001; 10:1121–1128. [PubMed] [Google Scholar]
- 55.Iso H, Kubota Y. Nutrition and disease in the Japan Collaborative Cohort Study for Evaluation of Cancer (JACC). Asian Pac J Cancer Prev 2007; 8:35–80. [PubMed] [Google Scholar]
- 56.Steineck G, Norell SE, Feychting M. Diet, tobacco and urothelial cancer. A 14-year follow-up of 16 477 subjects. Acta Oncol 1988; 27:323–327. [DOI] [PubMed] [Google Scholar]
- 57.Hirayama T. A large scale cohort study on cancer risks by diet – with special reference to the risk reducing effects of green-yellow vegetable consumption. Princess Takamatsu Symp 1985; 16:41–53. [PubMed] [Google Scholar]
- 58.Guptaa S, Lakshmia AJ, Manjunathb MN, et al. Analysis of nutrient and antinutrient content of underutilized green leafy vegetables. LWT 2005; 38:339–345. [Google Scholar]
- 59.de Pee S, West CE, Permaesih D, et al. Orange fruit is more effective than are dark-green, leafy vegetables in increasing serum concentrations of retinol and beta-carotene in schoolchildren in Indonesia. Am J Clin Nutr 1998; 68:1058–1067. [DOI] [PubMed] [Google Scholar]