Abstract
To investigate white matter (WM) alterations and their correlation with cognition function in end-stage renal disease (ESRD) patients undergoing hemodialysis (HD) using diffusion tensor imaging (DTI) with tract-based spatial statistics (TBSS) approach.
This prospective HIPAA-complaint study was approved by our institutional review board. Eighty HD ESRD patients and 80 sex- and age-matched healthy controls were included. Neuropsychological (NP) tests and laboratory tests, including serum creatinine and urea, were performed. DTI data were processed to obtain fractional anisotropy (FA) and mean diffusivity (MD) maps with TBSS. FA and MD difference between the 2 groups were compared. We also explored the associations of FA values in WM regions of lower FA with ages, NP tests, disease, and dialysis durations, serum creatinine and urea levels of ESRD patients.
Compared with controls, HD ESRD patients had lower FA value in the corpus callosum, bilateral corona radiate, posterior thalamic radiation, left superior longitudinal fasciculus, and right cingulum (P < 0.05, FWE corrected). Almost all WM regions had increased MD in HD ESRD patients compared with controls (P < 0.05, FWE corrected). In some regions with lower FA, FA values showed moderate correlations with ages, NP tests, and serum urea levels. There was no correlation between FA values and HD durations, disease durations, and serum creatinine levels of ESRD patients (all P > 0.05).
Diffuse interstitial brain edema and moderate WM integrity disruption occurring in HD ESRD patients, which correlated with cognitive dysfunction, and serum urea levels might be a risk factor for these WM changes.
INTRODUCTION
End-stage renal disease (ESRD) denotes the chronic renal disease deteriorating to the stage when the renal functions eternally decrease to <10% of their normal capacity. ESRD has multi-organ dysfunctions and needs dialytic therapy or kidney transplantation.1,2 Patients with ESRD often have various brain abnormalities, including diverse encephalopathy, and dysequilibrium syndrome.2,3 Importantly, it is reported that up to approximately 60% hemodialysis ESRD patients had impaired cognitive function.4,5 However, cognitive dysfunction was often neglected in the daily care of ESRD patients.6 Memory disturbance, slow motor performance, and impaired concentration are commonly occurrence in ESRD patients undergoing dialysis,7 which may impair the capability of complying with complex medication regimens or providing informed consent for medical procedures,8 and even aggravate into dementia.9 Cognitive impairment detracts from quality of life and has become a risk factor for dialysis-related mortality.10 Thus, it has an important implication for early detection of these cognitive dysfunctions and uncovering the neuropathological mechanism of cognitive dysfunction in ESRD patients.
Neuroimaging plays a pivot role in detecting brain abnormalities in ESRD patients. Some advanced magnetic resonance imaging (MRI) techniques, such as magnetic resonance spectroscopy, resting-state function MRI, and arterial spin labeling MRI have been used to investigate the cerebral metabolic changes,11,12 default-mode network alterations,13,14 and cerebral blood flow15 in the patients without obvious abnormalities in conventional brain MRI. Diffusion tensor imaging (DTI), a further development of the non-invasive diffusion-weighted imaging technique, is specifically sensitive to the presence of subtle white matter (WM) changes. It can be used to measure an effective diffusion tensor of water in vivo and assess microstructural WM integrity in cerebral tissues by virtue of its ability to image water diffusion characteristics.16–19 A few studies have shown WM abnormalities using DTI measurements in ESRD patients.3,20,21 These studies have indicated existence of abnormalities in WM microstructures in ESRD patients even without obvious neurological symptoms. But the relationship between cognitive functions and WM alterations is not completely understood.
Tract-based spatial statistics (TBSS) is an advanced approach for whole-brain analysis of DTI data in WM.22 It has been widely employed to investigate the microstructural changes in various diseases, such as autism spectrum disorders, phenylketonuria, and hepatic encephalopathy.23–25 Compared with voxel-based techniques using statistical parametric mapping, TBSS projects FA data from each subject onto a voxelized skeleton located at the center of major cerebral WM pathways through the brain, and thus minimizes the registration error; it also minimizes personal evaluation bias compared with region-of-interest based analysis.25 The purpose of this study was to investigate WM alterations and their correlation with cognition function in ESRD patients undergoing hemodialysis using DTI with TBSS approach.
MATERIALS AND METHODS
Subjects
This prospective study was approved by our institutional review board and was conducted in compliance with the Health Insurance Portability and Accountability Act. All subjects gave written informed consent before the MRI study. From November 2011 to October 2013, 160 right-handed subjects were recruited in our study, including 80 patients with ESRD undergoing hemodialysis (53 male, 27 female; mean age 32.0 ± 9.9 years) and 80 age- and gender-matched health subjects (48 male, 32 female; mean age 31.6 ± 9.0 years). The inclusion criteria for recruitment of the patients were as following: the patients of 18 years or older with clinically proven ESRD, who were undergoing regular hemodialysis 3 times weekly at the hemodialysis center at our hospital; These patients could finish the MR exams without any MRI contraindication (ie, without dental fixtures or other foreign bodies in the head causing significant image artifacts); All patients’ estimated glomerular filtration rate (eGFR) was lower than 15 mL/min/1.73 m2; All patients had complete laboratory tests including serum creatinine and urea levels to evaluate renal function within 24 hours before MR scans; Dialysis duration and ESRD duration can be retrieved from the patients’ medical history. Health control subjects recruited from the local community had no diseases of the kidney and other systems. Exclusion criteria for all the subjects included history of alcoholism, drug abuse, psychiatric disorder, or any brain lesions, such as tumor or stroke, assessed on the basis of medical history and conventional MRI. No laboratory tests were performed thus unavailable for the health control subjects.
Neuropsychological Tests
Attention and speed of information processing dysfunctions are viewed as important cognitive impairments in patients with ESRD in the current literatures.12,26 We chose the test battery including number connecting-A (NCT-A) and digit symbol test (DST) according to the previous study.13,14,27 NCT-A examines the domain of psychomotor speed. Subjects were asked to connect numbers from 1 to 25 that were randomly printed on the paper as quickly as possible. A longer time to complete the test represents a worse performance. DST is associated with the domains of psychomotor speed, attention, and visual memory. Digits from 1 to 9 and corresponding symbols were displayed in front of the subjects; they were asked to fill in the blanks with the symbol that matched each digit in 90 seconds. The more symbols correctly transcribed into the blank indicate better performance.14 These neuropsychological (NP) tests were regarded as reflecting attention level and cognition functions of the subjects.27
MRI Data Acquisition
The MRI data were acquired at a 3T MR scanner (TIM Trio; Siemens Medical Solutions, Erlangen, Germany). All subjects were placed in a standard head coil and fitted to foam padding to reduce head motion. They were instructed to hold still, keep eyes closed but be awake in the MR scanner. The diffusion tensor images were obtained using a spin echo-based echo planar imaging sequence in contiguous axial planes, including 20 volumes with diffusion gradients applied a long 20 non-collinear directions (b = 1000 s/mm2) and 1 volume without diffusion weighting (b = 0 s/mm2). Each volume consisted of 30 contiguous axial slices covering the whole brain (TR/TE = 4100 ms/93 ms, FOV = 240 × 240 mm2, matrix size = 128 × 128, voxel size = 1.8 × 1.8 × 4 mm3). Then, images with coronal T2-FLASH sequence (TR/TE = 8500/93 ms, slices = 24, matrix = 256 × 204, flip angle = 130°, FOV = 22 × 9.06 cm2, thickness/gap = 5.0 mm/1.5 mm) were acquired to exclude other brain lesions.
DTI Data Processing
The raw DTI data were corrected for eddy-current distortions and head motion by registering the diffusion-weighted images with b0 image through the affine transformations using image registration software FSL v4.1.9 (FMRIB Software Library, FMRIB Image Analysis Group, Oxford, UK). The FA data were calculated using TBSS, a software program of FSL, following several steps. After eddy current correction and brain extraction, the FA maps were aligned into 1 mm × 1 mm × 1 mm Montreal Neurological Institute (MNI) 152 Space to achieve the mean FA image (FA > 0.2 overlaid with the mean FA image). Then, a thresholded mean FA skeleton was created to represent the centers of all tracts common to the 2 groups. Last, each subject's aligned FA data were projected onto the FA skeleton and the resulting data were fed into voxelwise cross-subject statistical analysis. MD was conducted in the same way and aligned to the FA skeleton.
Statistical Analysis
The demographical, clinical, and NP data were analyzed using the software SPSS version 16.0 (SPSS Inc., Chicago, IL) in this study. The differences of age and NP tests between ESRD patients and the controls were compared with independent-samples t test. The Chi-square test was used to detect gender difference between the 2 groups. The threshold for statistical significance was P < 0.05.
We used the Johns-Hopkins University DTI-based white-matter atlases in FSL toolbox to identify the abnormal WM fiber tracts.28 A voxel-wise statistical analysis was performed to detect significant differences of skeletonized FA and MD maps between hemodialysis ESRD patients and healthy controls by using the randomized tool in FSL with adjustments for subjects’ age and gender. The FA and MD difference between the 2 groups was tested using permutation-based statistical analysis with 5000 permutation.29 Correction for multiple comparisons was performed using the threshold-free cluster enhancement (TFCE) approach in FSL with controlling for family wise-error (FWE).30,31 The threshold for significance was P < 0.05.
In addition, the association between FA values and ages, NP tests, disease and dialysis durations, clinical biomarkers was investigated in the hemodialysis ESRD patients. The FA values of different WM regions were extracted using the SPM8 software of MATLAB based on the Johns-Hopkins University DTI-based white-matter atlases. Pearson correlation analysis was performed to investigate the association between these variables and FA value. Multiple linear regression analysis was performed to evaluate the net effect of sex, age, duration of dialysis and disease, serum creatinine, and serum urea levels relative to the FA data. The statistical threshold was set at P < 0.05.
RESULTS
Demographic and Psychometric Data
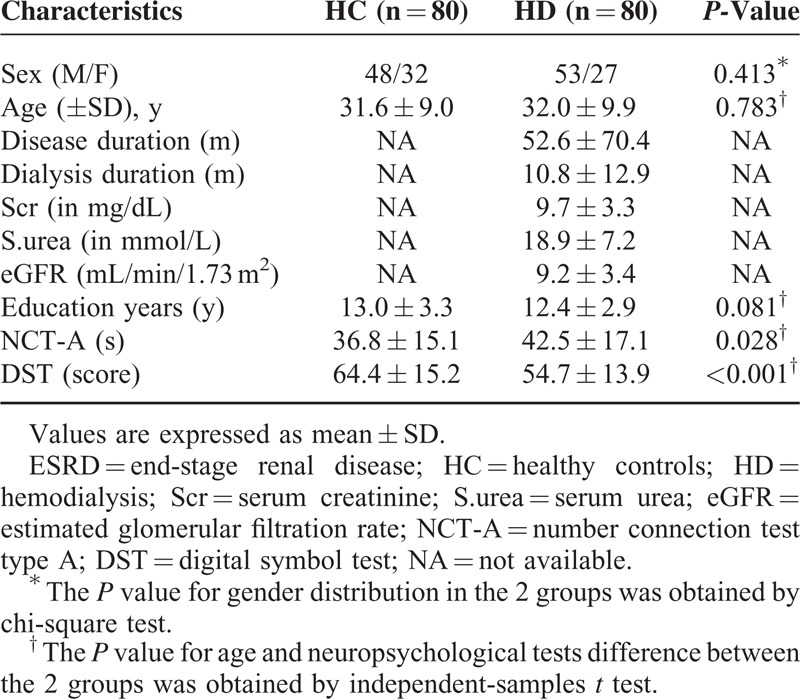
There was no difference for age, sex, and education years (all P > 0.05) between the 2 groups. The mean dialysis duration and ESRD duration of the patients were 10.8 ± 12.9 months and 52.6 ± 70.4 months, and the mean serum creatinine and urea values were 9.7 ± 3.3 mg/dL and 18.9 ± 7.2 mmol/L, respectively. The mean eGFR of all patients is 9.2 ± 3.4 mL/min/1.73 m2. ESRD patients revealed significantly worse NP tests results than healthy controls (all P < 0.05), suggesting the cognitive function impairments. Table 1 shows the demographic and clinical features of the 2 subject groups.
TABLE 1.
Demographics and Clinical Data of Hemodialysis ESRD Patients and Healthy Controls
Comparison of FA and MD Between the Two Groups
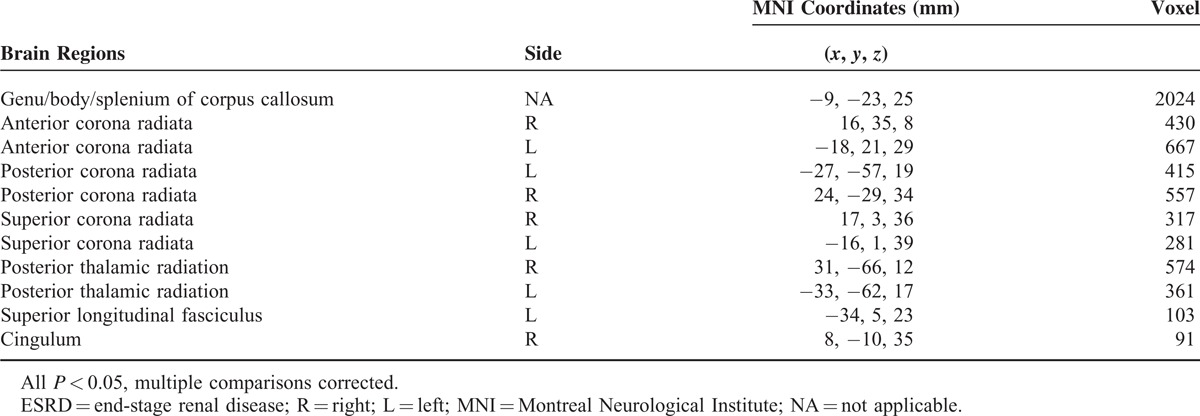
Compared with healthy controls, significantly lower FA was found in patients in the genu, splenium, and body of corpus callosum (CC), bilateral anterior corona radiata (ACR), posterior corona radiata (PCR), superior corona radiata (SCR), and posterior thalamic radiation (PTR), left superior longitudinal fasciculus (SLF), and right cingulum in the hemodialysis ESRD (Figure 1 and Table 2). Almost all WM regions were found having increased MD in hemodialysis ESRD patients compared with healthy controls, and including bilateral cerebellum, midbrain, and pons (Figure 1), which indicated diffusely Interstitial brain edema in these patients.
FIGURE 1.
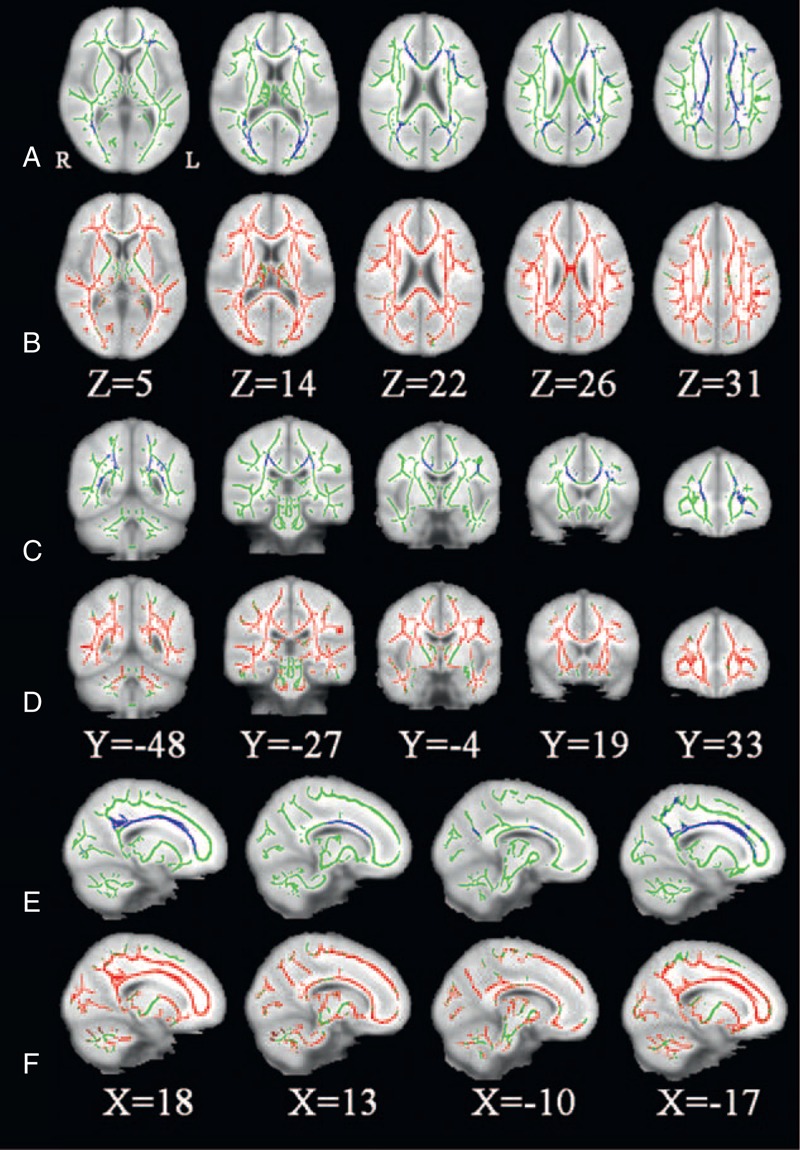
significant altered brain regions with FA and MD in hemodialysis ESRD patients (n = 80) compared with healthy controls (n = 80). The background image is the standard MNI 152 brain template. Green voxels represent the white matter skeleton of FA. (A, C, E) Blue voxels represent brain regions with reduced FA in hemodialysis ESRD patients (P < 0.05, FEW corrected). (A) Axial, (C) coronal, and (E) sagittal FA maps show the reduced FA regions are mainly located in the genu, splenium, and body of corpus callosum, bilateral anterior corona radiata, posterior corona radiata, superior corona radiate, and posterior thalamic radiation, left superior longitudinal fasciculus, and right cingulum. (B, D, F) Red voxels represent brain regions with increased MD in hemodialysis ESRD patients (P < 0.05, FEW corrected). (B) Axial, (D) coronal, and (F) sagittal MD maps show the increased FA regions are located in almost all white matter regions and bilateral cerebellum, midbrain, and pons. ESRD = end-stage renal disease; R = right; L = left.
TABLE 2.
Regions Showing Decreased Fractional Anisotropy Between Hemodialysis ESRD Patients and Healthy Controls
Correlation Analysis Results
As almost all WM regions showed increased MD in hemodialysis ESRD patients, we only chose FA in the brain regions of significantly lower FA values to correlate with ages, NP test scores, disease and dialysis durations, serum creatinine and urea levels.
FA values negatively correlated with ages in the genu of CC (r = −0.310, P = 0.005), right PCR (r = −0.249, P = 0.026), right SCR (r = −0.29, P = 0.008), left SCR (r = −0.296, P = 0.008), right PTR (r = −0.267, P = 0.017), and left PTR (r = −0.280, P = 0.012) (Figure 2 and Table 3).
FIGURE 2.
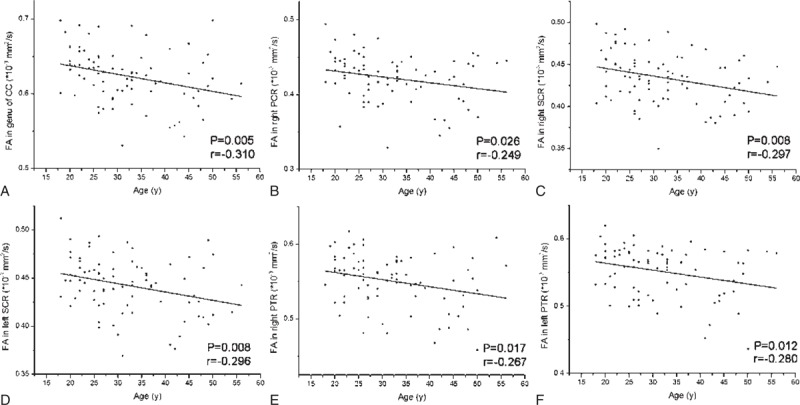
The scatter plots show significant correlation of FA values in significant brain regions with ages of hemodialysis ESRD patients. FA values in genu of corpus callosum (A), right posterior corona radiata (B), bilateral superior corona radiata (C, D) and bilateral posterior thalamic radiation (E, F) correlated negatively with hemodialysis ESRD patients’ ages. The correlation coefficients and P values obtained with a bivariate linear regression model are included. CC = corpus callosum; ESRD = end-stage renal disease; PCR = posterior corona radiata; PTR = posterior thalamic radiation; SCR = superior corona radiata.
TABLE 3.
The P Values Showing Correlations Between FA Values of Significant Brain Regions and Ages, NP Tests, Disease and Dialysis Durations, Serum Creatinine and Urea Levels in Hemodialysis ESRD Patients
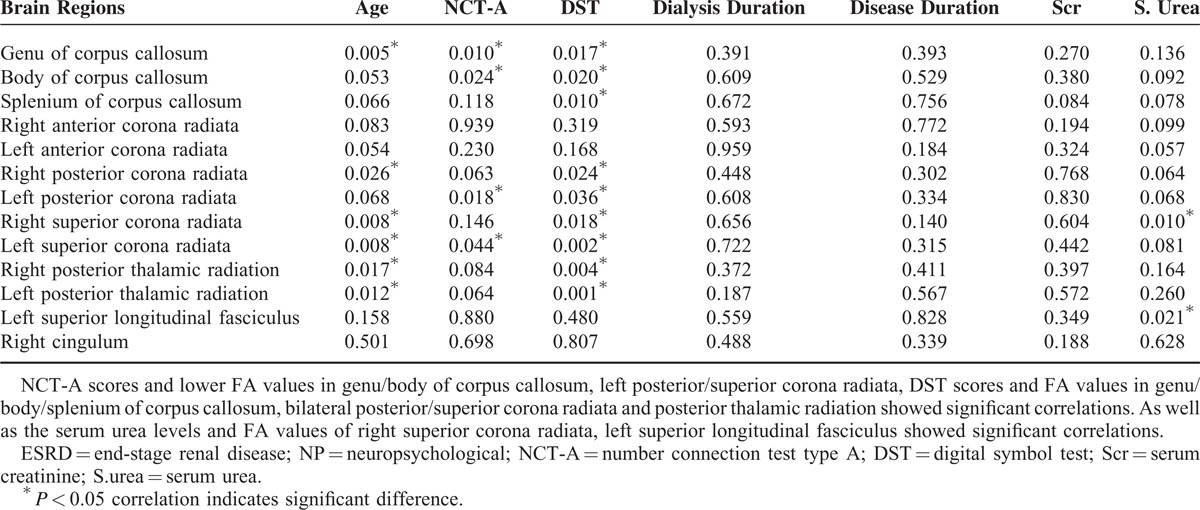
There was a negative correlation between NCT-A scores and FA values in the genu of CC (r = −0.287, P = 0.010), body of CC (r = −0.252, P = 0.024), left PCR (r = −0.264, P = 0.018), and left SCR (r = −0.226, P = 0.044) (Figure 3 and Table 3).
FIGURE 3.
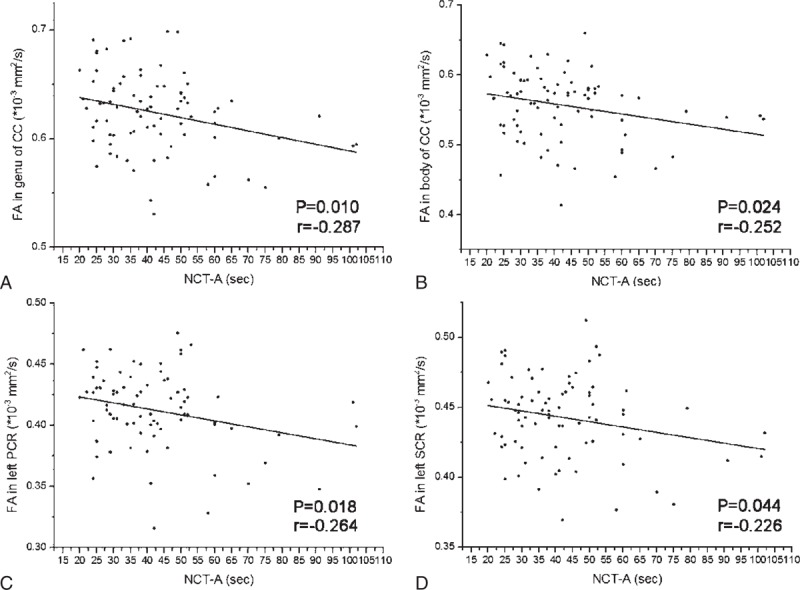
The scatter plots show significant correlation of FA values in significant brain regions with NCT-A scores of hemodialysis ESRD patients. The FA values in genu/body of corpus callosum (A, B), left posterior corona radiata (C), and left superior corona radiata (D) correlated negatively with NCT-A scores. The correlation coefficients and P values obtained with a bivariate linear regression model are included. CC = corpus callosum; ESRD = end-stage renal disease; NCT-A = number connection test type A; PCR = posterior corona radiata; SCR = superior corona radiata.
The DST scores showed positive correlations with FA values in the genu of CC (r = 0.265, P = 0.017), body of CC (r = 0.260, P = 0.020), splenium of CC (r = 0.285, P = 0.10), right PCR (r = 0.253, P = 0.024), left PCR (r = 0.235, P = 0.036), right SCR (r = 0.264, P = 0.018), left SCR (r = 0.336, P = 0.002), right PTR (r = 0.317, P = 0.004), and left PTR (r = 0.365, P = 0.001) (Figure 4 and Table 3).
FIGURE 4.
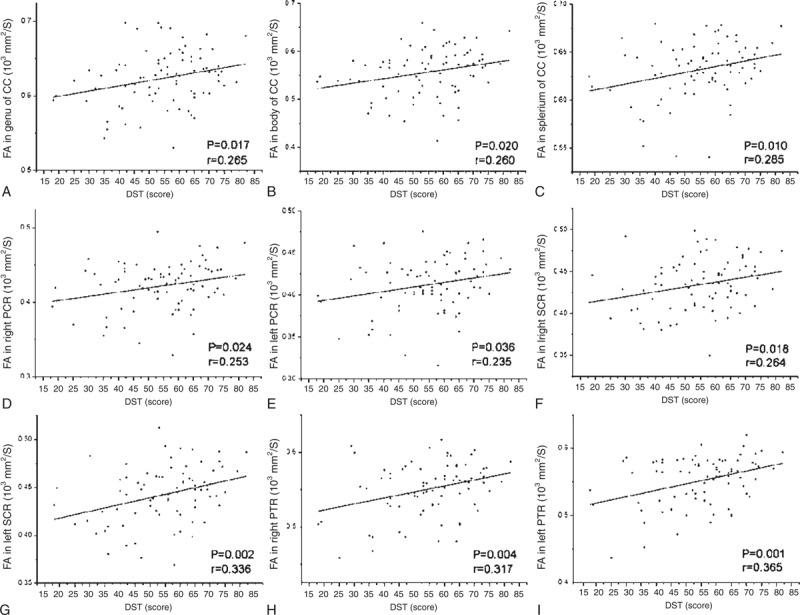
The scatter plots show significant correlation of FA values in significant brain regions with DST scores of hemodialysis ESRD patients. The FA values in genu/body/splenium of corpus callosum (A–C), bilateral posterior corona radiata (D, E), bilateral superior corona radiata (F, G), and bilateral posterior thalamic radiation (H, I) correlated positively with DST scores. The correlation coefficients and P values obtained with a bivariate linear regression model are included. CC = corpus callosum; DST = digital symbol test; ESRD = end-stage renal disease; PCR = posterior corona radiata; PTR = posterior thalamic radiation; SCR = superior corona radiata.
The serum urea levels showed negative correlation with FA values in right SCR (r = −0.287, P = 0.010) and left SLF (r = −0.258, P = 0.021) (Figure 5 and Table 3).
FIGURE 5.
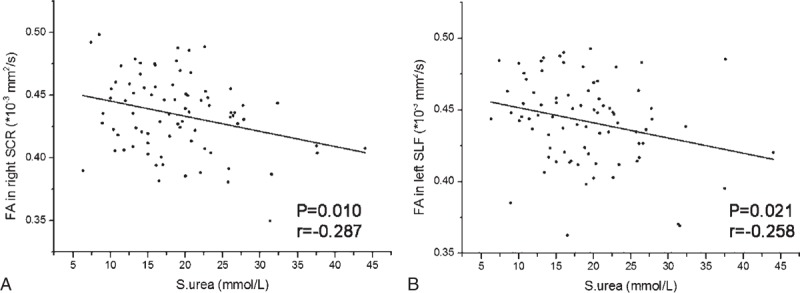
The scatter plots show significant correlation of FA values in significant brain regions with serum urea levels in hemodialysis ESRD patients. The serum urea levels showed negative correlation with the FA values in right superior corona radiata (A) and left superior longitudinal fasciculus (B). The correlation coefficients and P values obtained with a bivariate linear regression model are included. ESRD = end-stage renal disease; SCR = superior corona radiata; SLF = superior longitudinal fasciculus; S.urea = serum urea.
We found no significant correlation between mean FA values and hemodialysis durations, disease durations, or serum creatinine levels of ESRD patients (all P > 0.05) (Table 3).
In multiple linear regression analysis, we found ages negatively correlated with FA values of genu of CC (P = 0.017), right SCR (P = 0.028), left SCR (P = 0.028), and right PTR (P = 0.041); the serum urea levels negatively correlated with FA values of the genu (P = 0.003), body (P = 0.003), and splenium (P < 0.001) of CC, right ACR (P = 0.001), left ACR (P = 0.001), right PCR (P = 0.005), right SCR (P < 0.001), left SCR (P = 0.003), and right PTR (P = 0.011). We found no significant association between FA values and sex, dialysis and disease duration, or serum creatinine levels (all P > 0.05).
DISCUSSION
This TBSS based DTI study found significantly reduced FA and widespread increased MD in nearly all brain WM regions in hemodialysis ESRD patients, and FA in regions with significantly reduced FA values correlated with the patients’ ages, NP tests, and serum urea levels. These findings indicate that brain edema is prevalent in ESRD patients maintained with hemodialysis without overt encephalopathy.
In this study, the FA values were significantly decreased, mainly in the CC and bilateral CR in ESRD patients. A decrease in FA may be attributed to disorganized axons and hypomyelination.32 FA values reflect underlying levels of axonal myelination, which may account for differences in reaction times, processing speed, and intellectual performance across subjects.33 The CC and CR are the important commissural and projection fibers, respectively. The CC is associated with connecting the hemispheres, and any changes in this largest commissural fiber bundle may be associated with NP abnormalities.34 It interconnects bilateral primary visual and visual association areas of the parietal and occipital cortex, and is involved in visuospatial memory.35 CR is a WM structure that continues ventrally as the internal capsule and dorsally as the centrum semiovale.28 It contains both descending and ascending axons that carry nearly all of the neural traffic from and to the cerebral cortex, and associated with motor function in human beings.36 The alterations of CC and CR might attribute to the worse NP tests in patients compared with healthy controls. Our present findings indicate that WM changes in some brain regions related to visuospatial memory and motor function in hemodialysis ESRD patients.
There have several DTI studies in ESRD patients to investigate WM microstructural changes. Hesieh et al20 reported that decreased FA values occurred in patients with ESRD who are undergoing maintenance dialysis in one region-of-interest based DTI study, partially consistent with our findings. Only FA measurements may not be enough to characterize the WM changes, and MD measurement may help to better understand how the diffusion tensor is changing.19 Besides FA reduction, we also found widespread increase in MD values in almost all WM regions, which partially conformed to previous study.21 Increases MD values are described secondary to gliosis37 or neuronal loss.38 Chou et al21 found MD was significantly increased, while FA was significantly decreased in many WM regions in ESRD patients in 1 voxelwise DTI study. As increased MD areas were wider than decreased FA areas in our study, this indicates that ESRD mainly appears as diffusely interstitial brain edema but with focal or moderate microstructural changes.39 Our study showed more widely increased MD regions compared with previous study,21 which might due to different DTI measurements used in the 2 studies. The voxelwise DTI analysis was limited by voxel clusters, while TBSS could provide higher spatial comparability through carefully tuned non-linear registration and projection on to an alignment-invariant tract representation reflecting the WM microstructure changes objectively.21,22 Our finding of diffusely interstitial brain edema in ESRD patients is also supported by some previous studies.40,41 For example, Galons et al40 found that brain edema induced by hemodialysis was due to interstitial edema rather than cytotoxic edema in rats with bilateral nephrectomy by diffusion-weighted MRI. In diffusion-weight MR imaging in 8 ESRD patients with severe azotemia before and after the first hemodialysis, Chen et al41 found that severe azotemia lead to interstitial brain edema, and the edema associated with 1st hemodialysis is interstitial rather than cytotoxic. Zhang et al27 found that ESRD patients showed predominant decreased gray matter volume using voxel-based morphometry method, which is supplementary for WM damage of ESRD patients.27 Whether the brain atrophy and edema could coexist in ESRD patients still needs further study in the same subjects.
This study showed a correlation between FA in WM regions with significantly lower FA values and ages, NP test scores, and serum urea levels in ESRD patients. The FA values in some regions were found to decline with ages, partially being consistent with previous studies.42,43 NCT-A tests for psychomotor speed with the test score being the time the subject performs the test. The worse performance is indicated by a longer time for completion of the test. DST tests for psychomotor speed, attention, and visual memory, with the test score being the total number of correct sequential matching of symbols to numbers in a 90-s interval.27 The patients included in our study showed worse NP tests scores compared with healthy controls, indicating that the hemodialysis ESRD patients have impaired cognitive function. Cognitive dysfunction is prevalent in ESRD patients undergoing dialysis, which is associated with an increased risk of death and the severity of kidney disease.26 These results suggested NCT-A and DST could be used to evaluate the neurocognitive dysfunction, and the FA values with WM regions could detect potential uremic neuropathy, which is associated with cognitive dysfunction in hemodialysis ESRD patients. Due to renal failure, the uremic toxins, such as serum urea and creatinine, were accumulated seriously in vivo in ESRD patients.40,44–46 Our study found that serum urea rather than dialysis duration, disease course, or serum creatinine was slightly associated with FA values of several WM regions, suggesting high serum urea levels can be a risk factor for WM changes. Galons et al40 reported the major role of urea in the pathogenesis of cerebral edema in dialysis disequilibrium syndrome in an experimental study. Zhang et al27 found that the serum urea levels play an important role in the development of minimal nephro-encephalopathy of ESRD patients using voxel-based morphometry method. Lower FA values did not show correlation with hemodialysis durations, which was different with the result of Hsieh et al.20 In our research, the average hemodialysis duration of less than 1 year, while the average duration of hemodialysis of Hsieh research was 6.5 years.20 This may account for the difference between ours and Hsieh.20
Our study has several limitations. First, our study only include ESRD patients undergoing hemodialysis, thus, our results may be difficult to generalize to other ESRD populations, such as the ESRD patients with peritoneal dialysis, longer dialysis durations, or without dialysis treatment. Besides, etiology of renal diseases could also affect brain function, and further researches according to the different etiologies might be necessary. Second, we did not compare the ESRD patients with and without cognition dysfunction because we only included 2 NP tests in this study. A detailed battery of NP tests should be performed to comprehensively evaluate cognitive status in these patients. Third, the diffusion gradient of 20 non-collinear directions and a suboptimal DTI sequence with large slice thickness in this study might affect the accuracy of TBSS results. Fourth, subjects’ occupation might influence the NP tests results, which was not considered in this study.
In conclusion, we found reduced FA and increased MD in WM regions in ESRD patients undergoing hemodialysis, which showed statistically moderate association between FA values, NP tests, and serum urea. These indicate diffusely interstitial brain edema and moderate WM integrity disruption are associated with impairment of cognitive function, and high serum urea levels might be a risk factor for WM integrity disruption in hemodialysis ESRD patients. TBSS based DTI might be a potentially useful approach for detecting brain edema in hemodialysis ESRD patients in need of improving cognitive function.
Footnotes
Abbreviations: ACR = anterior corona radiata, CC = corpus callosum, DST = digital symbol test, DTI = diffusion tensor imaging, ESRD = end-stage renal disease, eGFR = estimated glomerular filtration rate, FA = fractional anisotropy, FWE = family wise error, HC = healthy controls, HD = hemodialysis, MD = mean diffusivity, NP = neuropsychological, NCT-A = number connection test type A, PCR = posterior corona radiata, PTR = posterior thalamic radiation, Scr = serum creatinine, SCR = superior corona radiata, SLF = superior longitudinal fasciculus, TBSS = tract-based spatial statistics, WM = white matter.
This study was supported by the grants from Natural Scientific Foundation of China (No. 30700194, 81171313, 81322020, 81230032) and Program for New Century Excellent Talents in University (No. NCET-12-0260).
The authors declare no conflict of interest.
K-X and W-JQ contributed equally to this work.
REFERENCES
- 1.Foley RN, Collins AJ. End-stage renal disease in the United States: an update from the United States Renal Data System. J Am Soc Nephrol 2007; 18:2644–2648. [DOI] [PubMed] [Google Scholar]
- 2.Brouns R, De Deyn PP. Neurological complications in renal failure: a review. Clin Neurol Neurosurg 2004; 107:1–16. [DOI] [PubMed] [Google Scholar]
- 3.Kim HS, Park JW, Bai DS, et al. Diffusion tensor imaging findings in neurologically asymptomatic patients with end stage renal disease. NeuroRehabilitation 2011; 29:111–116. [DOI] [PubMed] [Google Scholar]
- 4.DiMatteo MR. Variations in patients’ adherence to medical recommendations: a quantitative review of 50 years of research. Med Care 2004; 42:200–209. [DOI] [PubMed] [Google Scholar]
- 5.Agganis BT, Weiner DE, Giang LM, et al. Depression and cognitive function in maintenance hemodialysis patients. Am J Kidney Dis 2010; 56:704–712. [DOI] [PMC free article] [PubMed] [Google Scholar]
- 6.Okpechi IG, Nthite T, Swanepoel CR. Health-related quality of life in patients on hemodialysis and peritoneal dialysis. Saudi J Kidney Dis Transpl 2013; 24:519–526. [DOI] [PubMed] [Google Scholar]
- 7.Murray AM, Tupper DE, Knopman DS, et al. Cognitive impairment in hemodialysis patients is common. Neurology 2006; 67:216–223. [DOI] [PubMed] [Google Scholar]
- 8.Sehgal AR, Grey SF, DeOreo PB, Whitehouse PJ. Prevalence, recognition, and implications of mental impairment among hemodialysis patients. Am J Kidney Dis 1997; 30:41–49. [DOI] [PubMed] [Google Scholar]
- 9.Jung S, Lee YK, Choi SR, et al. Relationship between cognitive impairment and depression in dialysis patients. Yonsei Med J 2013; 54:1447–1453. [DOI] [PMC free article] [PubMed] [Google Scholar]
- 10.Elias MF, Dore GA, Davey A. Kidney disease and cognitive function. Contrib Nephrol 2013; 179:42–57. [DOI] [PMC free article] [PubMed] [Google Scholar]
- 11.Chiu ML, Li CW, Chang JM, et al. Cerebral metabolic changes in neurologically presymptomatic patients undergoing haemodialysis: in vivo proton MR spectroscopic findings. Eur Radiol 2010; 20:1502–1507. [DOI] [PubMed] [Google Scholar]
- 12.Tryc AB, Alwan G, Bokemeyer M, et al. Cerebral metabolic alterations and cognitive dysfunction in chronic kidney disease. Nephrol Dial Transplant 2011; 26:2635–2641. [DOI] [PubMed] [Google Scholar]
- 13.Ni L, Wen J, Zhang LJ, et al. Aberrant default-mode functional connectivity in patients with end-stage renal disease: a resting-state functional MR imaging study. Radiology 2014; 271:543–552. [DOI] [PubMed] [Google Scholar]
- 14.Liang X, Wen J, Ni L, et al. Altered pattern of spontaneous brain activity in the patients with end-stage renal disease: a resting-state functional MRI study with regional homogeneity analysis. PloS ONE 2013; 8:e71507. [DOI] [PMC free article] [PubMed] [Google Scholar]
- 15.Prohovnik I, Post J, Uribarri J, et al. Cerebrovascular effects of hemodialysis in chronic kidney disease. J Cereb Blood Flow Metab 2007; 27:1861–1869. [DOI] [PubMed] [Google Scholar]
- 16.Neil JJ. Diffusion imaging concepts for clinicians. J Magn Reson Imaging 2008; 27:1–7. [DOI] [PubMed] [Google Scholar]
- 17.Assaf Y, Pasternak O. Diffusion tensor imaging (DTI)-based white matter mapping in brain research: a review. J Mol Neurosci 2008; 34:51–61. [DOI] [PubMed] [Google Scholar]
- 18.Nucifora PG, Verma R, Lee SK, Melhem ER. Diffusion-tensor MR imaging and tractography: exploring brain microstructure and connectivity. Radiology 2007; 245:367–384. [DOI] [PubMed] [Google Scholar]
- 19.Alexander AL, Lee JE, Lazar M, Field AS. Diffusion tensor imaging of the brain. Neurotherapeutics 2007; 4:316–329. [DOI] [PMC free article] [PubMed] [Google Scholar]
- 20.Hsieh TJ, Chang JM, Chuang HY, et al. End-stage renal disease: in vivo diffusion-tensor imaging of silent white matter damage. Radiology 2009; 252:518–525. [DOI] [PubMed] [Google Scholar]
- 21.Chou MC, Hsieh TJ, Lin YL, et al. Widespread white matter alterations in patients with end-stage renal disease: a voxelwise diffusion tensor imaging study. AJNR Am J Neuroradiol 2013; 34:1945–1951. [DOI] [PMC free article] [PubMed] [Google Scholar]
- 22.Smith SM, Jenkinson M, Johansen-Berg H, et al. Tract-based spatial statistics: voxelwise analysis of multi-subject diffusion data. Neuroimage 2006; 31:1487–1505. [DOI] [PubMed] [Google Scholar]
- 23.Billeci L, Calderoni S, Tosetti M, et al. White matter connectivity in children with autism spectrum disorders: a tract-based spatial statistics study. BMC Neurol 2012; 12:148. [DOI] [PMC free article] [PubMed] [Google Scholar]
- 24.Antenor-Dorsey JA, Hershey T, Rutlin J, et al. White matter integrity and executive abilities in individuals with phenylketonuria. Mol Genet Metab 2013; 109:125–131. [DOI] [PMC free article] [PubMed] [Google Scholar]
- 25.Qi R, Zhang LJ, Zhong J, et al. Grey and white matter abnormalities in minimal hepatic encephalopathy: a study combining voxel-based morphometry and tract-based spatial statistics. Eur Radiol 2013; 23:3370–3378. [DOI] [PubMed] [Google Scholar]
- 26.Koushik NS, McArthur SF, Baird AD. Adult chronic kidney disease: neurocognition in chronic renal failure. Neuropsychol Rev 2010; 20:33–51. [DOI] [PubMed] [Google Scholar]
- 27.Zhang LJ, Wen J, Ni L, et al. Predominant gray matter volume loss in patients with end-stage renal disease: a voxel-based morphometry study. Metab Brain Dis 2013; 28:647–654. [DOI] [PubMed] [Google Scholar]
- 28.Wakana S, Jiang H, Nagae-Poetscher LM, et al. Fiber Tract–based atlas of human white matter anatomy. Radiology 2004; 230:77–87. [DOI] [PubMed] [Google Scholar]
- 29.Nichols TE, Holmes AP. Nonparametric permutation tests for functional neuroimaging: a primer with examples. Hum Brain Mapp 2002; 15:1–25. [DOI] [PMC free article] [PubMed] [Google Scholar]
- 30.Smith SM, Nichols TE. Threshold-free cluster enhancement: addressing problems of smoothing, threshold dependence and localisation in cluster inference. Neuroimage 2009; 44:83–98. [DOI] [PubMed] [Google Scholar]
- 31.Agosta F, Pievani M, Sala S, et al. White matter damage in Alzheimer disease and its relationship to gray matter atrophy. Radiology 2011; 258:853–863. [DOI] [PubMed] [Google Scholar]
- 32.Gulani V, Webb AG, Duncan ID, Lauterbur PC. Apparent diffusion tensor measurements in myelin-deficient rat spinal cords. Magn Reson Med 2001; 45:191–195. [DOI] [PubMed] [Google Scholar]
- 33.Chiang MC, Barysheva M, Shattuck DW, et al. Genetics of brain fiber architecture and intellectual performance. J Neurosci 2009; 29:2212–2224. [DOI] [PMC free article] [PubMed] [Google Scholar]
- 34.Schulte T, Müller-Oehring EM. Contribution of callosal connections to the interhemispheric integration of visuomotor and cognitive processes. Neuropsychol Rev 2010; 20:174–190. [DOI] [PMC free article] [PubMed] [Google Scholar]
- 35.Begre S, Frommer A, von Kanel R, et al. Relation of white matter anisotropy to visual memory in 17 healthy subjects. Brain Res 2007; 1168:60–66. [DOI] [PubMed] [Google Scholar]
- 36.Sasson E, Doniger GM, Pasternak O, et al. Structural correlates of cognitive domains in normal aging with diffusion tensor imaging. Brain Struct Funct 2012; 217:503–515. [DOI] [PubMed] [Google Scholar]
- 37.Rugg-Gunn FJ, Eriksson SH, Symms MR, et al. Diffusion tensor imaging in refractory epilepsy. Lancet 2002; 359:1748–1751. [DOI] [PubMed] [Google Scholar]
- 38.Basser PJ. Inferring microstructural features and the physiological state of tissues from diffusion-weighted images. NMR Biomed 1995; 8:333–344. [DOI] [PubMed] [Google Scholar]
- 39.Zhang LJ, Zhong J, Lu GM. Multimodality MR imaging findings of low-grade brain edema in hepatic encephalopathy. AJNR Am J Neuroradiol 2013; 34:707–715. [DOI] [PMC free article] [PubMed] [Google Scholar]
- 40.Galons JP, Trouard T, Gmitro AF, Lien YH. Hemodialysis increases apparent diffusion coefficient of brain water in nephrectomized rats measured by isotropic diffusion-weighted magnetic resonance imaging. J Clin Invest 1006; 98:750–755. [DOI] [PMC free article] [PubMed] [Google Scholar]
- 41.Chen CL, Lai PH, Chou KJ, et al. A preliminary report of brain edema in patients with uremia at first hemodialysis: evaluation by diffusion-weighted MR imaging. AJNR Am J Neuroradiol 2007; 28:68–71. [PMC free article] [PubMed] [Google Scholar]
- 42.Grieve SM, Williams LM, Paul RH, et al. Cognitive aging, executive function, and fractional anisotropy: a diffusion tensor MR imaging study. AJNR Am J Neuroradiol 2007; 28:226–235. [PMC free article] [PubMed] [Google Scholar]
- 43.Sullivan EV, Pfefferbaum A. Diffusion tensor imaging and aging. Neurosci Biobehav Rev 2006; 30:749–761. [DOI] [PubMed] [Google Scholar]
- 44.Gotch FA, Sargent JA. A mechanistic analysis of the National Cooperative Dialysis Study (NCDS). Kidney Int 1985; 28:526–534. [DOI] [PubMed] [Google Scholar]
- 45.Owen WF, Jr, Lew NL, Liu Y, et al. The urea reduction ratio and serum albumin concentration as predictors of mortality in patients undergoing hemodialysis. N Engl J Med 1993; 329:1001–1006. [DOI] [PubMed] [Google Scholar]
- 46.De Deyn PP, Vanholder R, Eloot S, Glorieux G. Guanidino compounds as uremic (neuro)toxins. Semin Dial 2009; 22:340–345. [DOI] [PubMed] [Google Scholar]


