

Abstract
The aim of this study is to determine the prognostic role and the timing of metabolic response to chemotherapy, based on 18F-fluorodeoxyglucose positron emission tomography (18F-FDG-PET), in patients with metastatic non-small-cell lung cancer (NSCLC).
The study included 55 patients with metastatic NSCLC that were analyzed in terms of prognostic factors and survival. 18F-FDG-PET/CT findings were evaluated in patients separated into 3 groups, before and after 1st, 2nd, 3rd cycle of the first line chemotherapy. Metabolic response was assessed according to PET Response Criteria in Solid Tumors (PERCIST 1.0).
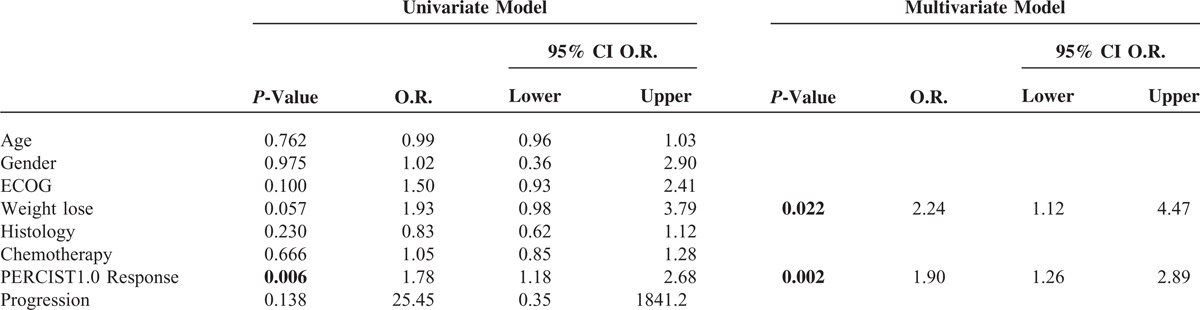
Among the 55 patients, 34 (62%) died, and 21 (38%) remained alive during a mean follow-up of 13.5 months. Median overall survival (OS) was 11.69 months (range 2–26.80 months) and median progression-free survival (PFS) was 6.27 months (range 1.37–20.43 months). Univariate analysis showed that the only favorable prognostic factor for OS in all the patients was the achievement of metabolic response. Metabolic response according to PERCIST, and weight lose ≤ 5% were also independent favorable prognostic factors predictive of survival in all patients based on multivariet analysis (metabolic response: P = 0.002, OR; 1.90, 95% CI 1.26–2.89, and weight lose ≤ 5%: P = 0.022, OR; 2.24, 95% CI 1.12–4.47). Median OS in all patients with partial response (PR)-according to the PERCIST 1.0- was significantly longer than in those with progressive disease (PD) (16.36 months vs 8.14 months, P = 0.008). Median OS in the patients with PR was significantly longer than in those with PD based on PET/CT performed after 2nd and 3rd cycles of chemotherapy (18.35 months vs 7.54 months, P = 0.012 and 18.04 months vs 7.43 months, P < 0.001, respectively), whereas, median OS did not differ significantly between patients with PR and those with PD based on PET/CT performed after the 1st cycle of chemotherapy (8.01 months vs 5.08 months, P = 0.290).
Metabolic response according to PERCIST and weight loss are independent factors predictive of OS. PET/CT performed after second cycle of chemotherapy may be the earliest predictor of treatment response in patients with advanced stage NSCLC.
INTRODUCTION
Lung cancer is the most common cause of cancer-related mortality worldwide, and approximately 80% of primary lung cancers are classified as non-small cell lung cancer (NSCLC).1 Timely detection and surgery are virtually the only hope of cure in patients with lung cancer. Unfortunetly, 2/3 of NSCLC patients present with locally advanced or advanced disease for which curative surgery is not indicated, and long-term survival is rare in patients with these types of cancer.2 Nonetheless, advancements in modern imaging modalities have made it possible to diagnose and treat lung cancer earlier than in the past.3
Conventional imaging techniques that provide structural and morphologic data can accurately delineate lesions, but are limited in their ability to assess of response to oncologic treatment; as such, data obtained via metabolic imaging are fundamentally different from those obtained via anatomic imaging. A major theoretic advantage of 18F-fluorodeoxyglucose positron emission tomography (18F-FDG-PET) over structural imaging techniques is that cellular metabolism changes more rapidly than tumor size. PET/CT with FDG is very useful in monitoring response to chemotherapy and radiotherapy. Many studies reported that diagnostic accuracy of PET with 18F-FDG is much higher than of that conventional imaging method. In addition, data obtained via PET shows that patient management would be change more than 30% patients.4 Although the role of PET in the assessment of early therapeutic response is widely recognized, the preferred methodology and timing remains unclear.
Early prediction of tumor response to treatment is of particular interest in patients with advanced NSCLC. The majority of NSCLC patients presents with unresectable disease (stage IIIB, IV) and undergo palliative therapy with platinum-based chemotherapy regimens,5 and in 30% of patients, first-line chemotherapy is unsuccessful6; therefore, a significant number of the patients undergo multiple-week-toxic therapy without any benefit. Early prediction of tumor response would allow physicians to provide patients with non-responsive tumors with alternative forms of treatment with greater time efficiency.
In recent years, PET/CT has become an established standart imaging modality for staging NSCLC. 18F-FDG-PET/CT imaging is reported to be significantly more sensitive and specific than conventional methods for detecting lymph node and distant metastases. In addition, numerous studies have shown that PET/CT is instrumental in evaluating response to treatment either as a prognostic factor or as a predictive factor,4,7–11 whereas, there are only a few studies on the use of PET/CT in advanced stage NSCLC, in which PET/CT was performed after 1 to 3 cycles of the first line of chemotherapy and various metabolic response criteria were used.12–16 Additionally, there is no consensus concerning the timing of 18F-FDG/PET/CT evaluation and metabolic response criteria for predicting survival; therefore, the most effective timing PET/CT evaluation and the metabolic response criteria to predict survival must be clarified. Response evaluation criteria in solid tumors (RECIST 1.1) is standart method for anatomical response, whereas, PET response criteria in solid tumors (PERCIST 1.0) is thought to be more reliable method for assesing metabolic response based on the RECIST 1.1.17,18 As such, the aim of this present study was to determine if metabolic response to first-line chemotherapy assessed via 18F-FDG-PET/CT (according to PERCIST) could predict outcome in patients with advanced stage NSCLC. Moreover, the study aimed to determine the most effective timing of PET/CT for assessing metabolic response based on survival analysis following the first 3 cycles of chemotherapy.
MATERIALS AND METHODS
The study included oncology patients that were diagnosed with advanced stage NSCLC between 2011 and 2013. Inclusion criteria were histologically or cytologically proven NSCLC, tumor stage IV, Eastern Cooperative Group Scale (ECOG PS) performance status of 0 to 2, age ≥18 years, and having undergone PET/CT for staging and response evaluation during follow-up. Patients that could not be given chemotherapy were excluded. The study protocol was approved by Balikesir State Hospital Ethics Committee.
PET Imaging
FDG-PET imaging was performed using 300 to 600 MBq of 18F-FDG administrated intravenously following 6-hour of fast to ensure that the patients would have serum glucose level of 70 to 150 mg/dL−1. Patients waited 1 hour 18F-FDG to circulate through out the body, and then were imaged using GE Discovery STE 16 integrated PET/CT scanner. The image processed by advantage workstation. PET/CT scanning was performed from vertex to upper thigh. Each patient underwent a baseline 18F-FDG-PET before initiation of chemotherapy. In-terim 18F-FDG-PET was performed in 3 groups of patients within 15 to 20 days after last cycle of chemotherapy.
To quantitatively asses tumor uptake of 18F-FDG, regions of interest (ROIs) were placed over all primary tumors and metastatic lesions. Maximum SUL value (standard uptake value normalized to lean body mass) was recorded for each lesion.
Evaluation of Response and Follow-Up
All patients underwent 18F-FDG-PET/CT for disease staging and assessment of treatment response. Tumor metabolic response was interpreted according PERCIST criteria based on RECIST. Patients without tumor progression underwent for further therapy of the same chemotherapy regimen. Patients with progressive diseases (PD) underwent second-line chemotherapy with or without symptomatic radiotherapy. Survival analysis was performed according to patients characteristics and whether or not there was metabolic response. Patients were divided into 3 groups according to the timing of 18F-FDG-PET/CT for assessment of metabolic response. The patients were also evaluated interms of survival according to the timing of PET/CT evaluation (after the 1st, 2nd, 3rd cycle of chemotherapy).
For the evaluation metabolic response via PET/CT, the same target lesions used for morphological response were used. Metabolic tumor response for target lesions were defined as follows17:
Complete metabolic response (CR): Complete resolution of 18F-FDG uptake.
Partial metabolic response (PR): ≥30% reduction in the sum of SULmax in target lesions and no new lesions.
Progressive metabolic disease (PD): >30% increase in the sum of SULmax of the lesion(s).
Stable metabolic disease (SD): Any response other than CR, PR and PD.
Statistical Analysis
All statistical analyses were performed using SPSS v. 17 for Windows. Univariate and multivariate analyses were performed for evaluate the affect of prognostic factors on overall survival (OS). The Kaplan Meier method was used to estimate OS and progression-free survival (PFS).19 OS was calculated from the diagnosis (biopsy date) to time of death or last follow-up. PFS was calculated as the time from diagnosis to disease progression or death from any cause. Univariate and multivariate analyses were performed to evaluate the effect of prognostic factors on OS. Univariate comparisons between subgroups were made using log-rank test. Multivariate analysis was performed using the Cox regression model.20 The level of statistical significance was set at P < 0.005.21
RESULTS
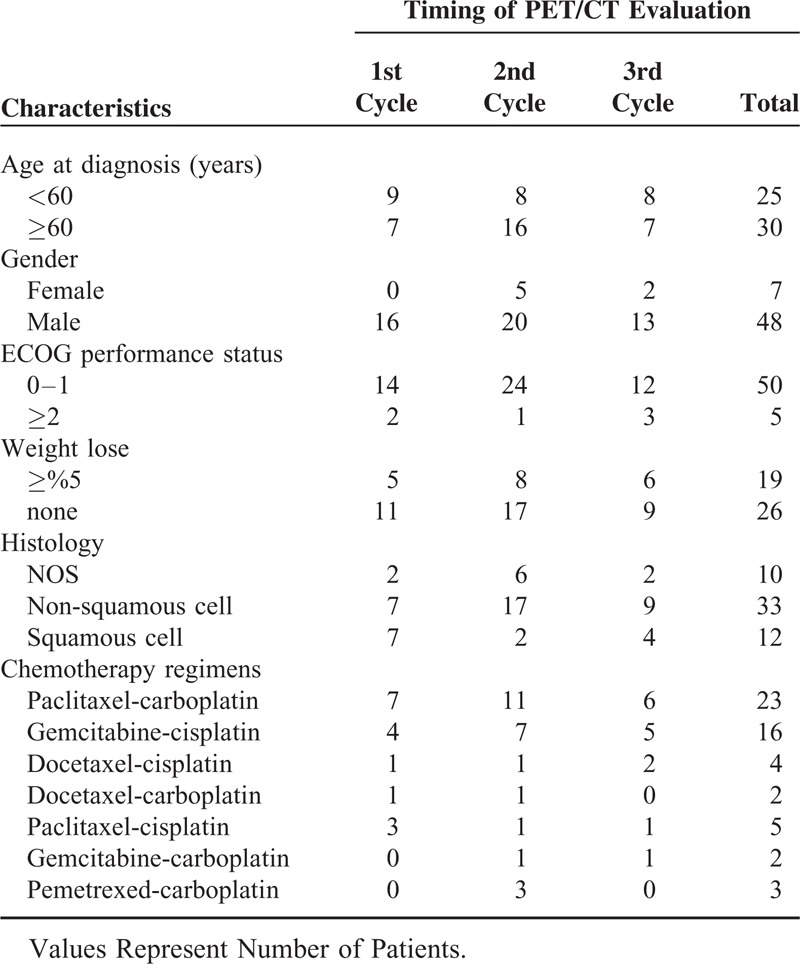
In all 167 patients with NSCLC were referred to our clinic between January 2011 and January 2013. Among those patients, 55 with staged IV disease that received first-line metastatic chemotherapy regimen and followed via PET/CT were included in the study. From 167 patients, 25 patients lose follow-up, due to failure of performing control PET/CT, 20 patients lose follow-up, and because of they could have not received chemotherapy due to poor PS and patients’ choice. The other patients did not meet criteria because of disease stage. All patients provided informed consent for their data to be stored in the hospital database and used for research. Patient demographic characteristics of are given in Table 1. Median age of the patients was 60 (range: 29–78 years). All the patients received platinum-based combination chemotherapy. PET/CT was performed to evaluate treatment response after 1st cycle (n = 16), 2nd cycle (n = 24), and 3rd cycle of chemotherapy.
TABLE 1.
Patient Characteristics
At the 13.5-month follow-up, 21 (38%) patients were still alive and 34 (62%) had died due to disease progression (n = 28), infection (n = 4), treatment toxicity (n = 1) and unknown cause (n = 1). Median OS was 11.69 months (range: 2–26.80 months) and median PFS was 6.27 months (range: 1.37–20.43 months) (Figure 1). The patients’ characteristics were similar the 3 groups (Table 1).
FIGURE 1.
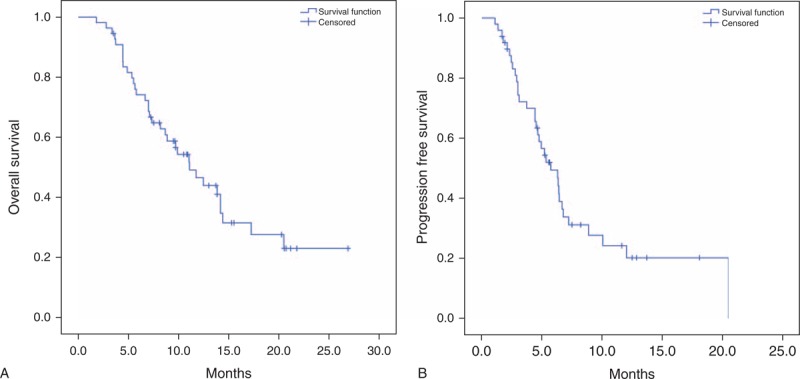
(A) Kaplan–Meier curves for OS in all patients. (B) Kaplan–Meier curves for PFS in all patients.
Univariate analysis showed that in all patients, the only favorable prognostic factor for OS was achieving metabolic response. Metabolic response according to PERCIST 1.0, and weight lose ≤ 5% were also independent favorable prognostic factors for survival based on multivariete analyses in all patients (P = 0.002, OR: 1.90, 95% CI 1.26–2.89, and P = 0.022, OR: 2.24, 95% CI 1.12–4.47; respevtively) (Table 2).
TABLE 2.
Univariet and Multivariet Analysis
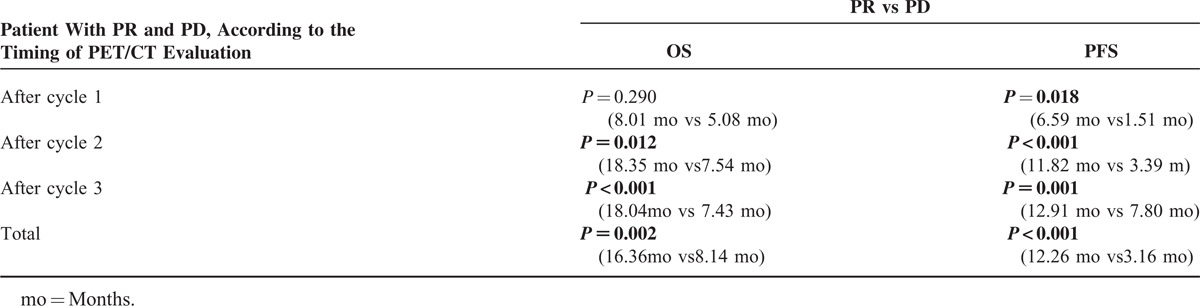
Median OS in all the patients with PR based on PERCIST 1.0 was significantly longer than in those with PD (16.36 months vs 8.14 months, P = 0.008) (Figure 2). Median OS in the patients with PR was significantly longer than in those with PD that underwent PET/CT evaluation after 2nd and 3rd cycles of chemotherapy (18.35 months vs 7.54 months, P = 0.012, and, 18.04 months vs 7.43 months, P < 0.001, respectively), whereas, it was longer (not-significantly) in the patients that underwent PET/CT evaluation after 1st cycle of chemotherapy (8.01 months vs 5.08 months, P = 0.290) (Table 3). None of the patients had CR. The highest number of PR and PD rates were observed in the patients that underwent PET/CT evaluation after 2nd cycles of chemotherapy (50% [n = 12] and, 50% [n = 8], respectively).
FIGURE 2.
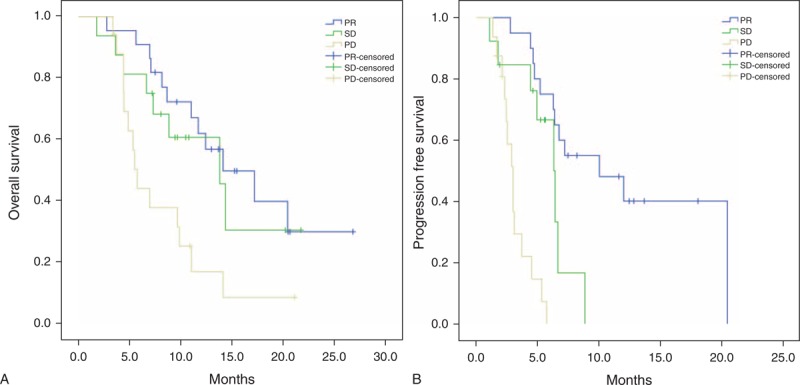
(A) Kaplan–Meier curves for OS, according to response assessment. (B) Kaplan–Meier curves for PFS, according to response assessment.
TABLE 3.
Mean OS and PFS
DISCUSSION
Early and precise response assessment of treatment response is mandatory because it makes it possible to avoid unnecessary toxicity and additional cost of administering ineffective treatment, and increases the possibility that patients can receive other potentially more effective treatments before further deterioration of performance status.
Treatment response evaluation is an evolving issue in Oncology. PET/CT is quantitative method of assessing tumor metabolic activity before and after treatment. PET/CT can differentiate between viable tumor, and necrosis or fibrosis. Several studies have shown that tumor response can be detected earlier via PET/CT, based on a decrease in uptake of 18F-FDG, as compared to change in tumor size.4,11–13 PERCIST 1.0 criteria for response assessment of solid tumors via PET/CT were published in 2009.17
The literature includes limited number of studies on the prognostic relevance of response evaluation to chemotherapy using 18F-FDG-PET/CT in patients with advanced stage NSCLC (Table 4). The optimal timing of PET/CT for response evaluation in patients with advanced NSCLC is unknown.22 Findings concerning the reproducibility of PET/CT for the assessment of response evaluations in cases of advanced-stage NSCLC are in consistent. A search of the literature showed that there are 5 studies on early metabolic response and the prognostic value of early metabolic response to first line chemotherapy in advanced-stage NSCLC12–16; all the studies included patients with stage IIIB and stage IV NSCLC (Table 4) and the criteria for metabolic response differed in each study. It was reported that early metabolic response to first line chemotherapy could predict survival.13,14,16
TABLE 4.
Published Studies on Assessment of Metabolic Response in Patients With Advanced-Stage NSCLC
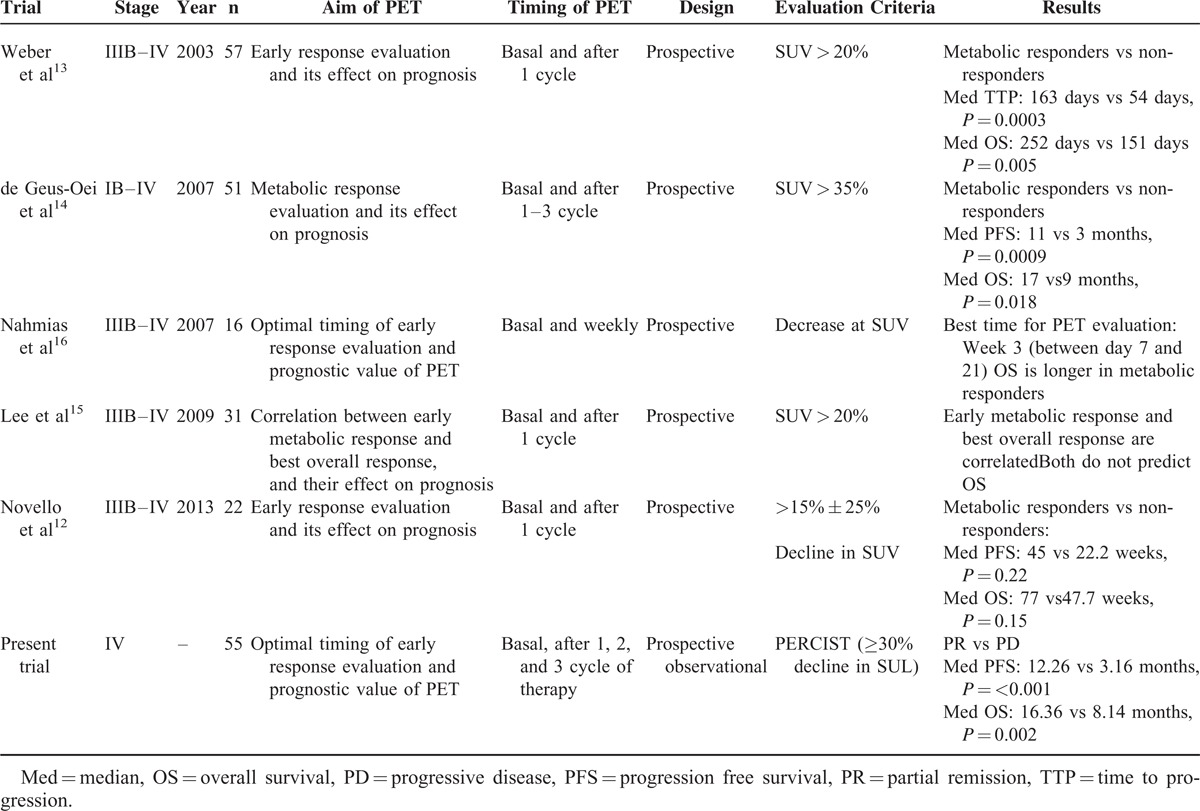
Weber et al13 reported that metabolic response was closely correlated with final outcome of 1 cycle cisplatin-based chemotherapy in 57 patients with stage III and IV NSCLC (median OS 252 d vs 151 d, P = 0.005). They also reported that there was 20% decrease in tumor SUVmax of tumor after 1 cycle of the treatment, which was associated with response at the end of the treatment. De Geus-Oei et al14 performed interim PET in patients after the 1st, 2nd, and 3rd cycle of chemotherapy, as in the present study. They reported PFS (median, 11 months vs 3 months, P = 0.0009) and OS (median, 17 months vs 9 months, P = 0.018) were significantly longer in the patients with metabolic response than in non-responders that were evaluated after 2nd and 3rd cycle of chemotherapy. Their findings indicate that metabolic response based on PET is a robust parameter for predicting survival. In contrast to present study, de Geus-Oei et al14 evaluated advanced stage and early stage NSCLC (ie, heterogenic groups). Lee et al15 compared anatomic response and metabolic response after 1 cycle chemotherapy in 31 patients with stage IIIB-IV NSCLC. They reported that assessment of metabolic response was weakly correlated with clinical benefit, but that assessment of metabolic response could predict PD earlier than anatomic response, faciliting more timely intervention. Moreover, they devised their own metabolic response criteria based on EORTC.
Nahmias et al16 observed that assessment of metabolic response via weekly PET/CT could predict survival in 16 patients with advance-stage NSCLC that were treated with weekly docetaxel–carboplatin combination chemotherapy. In all, they performed 7 PET/CT scans before and after initiating chemotherapy. They reported that a 0.5 decreased in SUV between 1st and 3rd week of chemotherapy could predict the survival; however, neither PET/CT timing nor chemotherapy regimen was suitable for clinical practice. This is a lack of consensus concerning when 18-F/FDG-PET should be performed to predict survival.
In some studies, OS and PFS in patients with metabolic response were not significantly longer, but there was a tendency for better prognosis.12,15 These findings should be interpreted carefully due to the limited number of patients and lower threshold for partial metabolic response when compared to PERCIST 1.0 criteria.
The optimal timing of PET/CT foe assessing response in patients with advanced NSCLC is not clear. Weber et al13 performed interim PET earlier than in the present study (after cycle 1 vs cycle 2–3). In addition, the response criteria they used (a >20% decrease in SUV) was less of a decrease than used in the present study (based on the PERCIST 1.0). Nonetheless, early metabolic response was strongly correlated with survival. These findings call into question that what is considered early assessment of response. It was reported that 60% to 70% of cell death occurs after the first cycle of chemotherapy in responsive tumors.23 Although same percentage of cells is killed according to first order kinetics with each additional cycle, most cancer cell death occurs during first few cycles, which means that response evaluation after 1st or 2nd cycle of chemotherapy may be accurate. Nahmias et al16 used a unique protocol with weekly monitoring of metabolic response via PET/CT for 7 weeks. Change in metabolic response was most prominent in third week of chemotherapy. The researchers suggest that best time to assess response in patients with advanced NSCLC-in order to identify patients in whom therapy is of limited benefit-is after the completion of first cycle (when the metabolic response is most prominent).
Among all the studies discussed, only Weber et al showed that assessment of metabolic response after first cycle chemotherapy at the end of the treatment. We think that findings reported by Nahmia et al are not applicable on daily clinical practice. Both DeGeus et al and the present findings show that early assessment of metabolic response (according to PERCIST 1.0) after second cycle of chemotherapy is more reliable in patients with advanced NSCLC. The present findings also show that achieving metabolic response (according to PERCIST) was an independent predictive factor for metabolic response evaluation to first-line chemotherapy. Furthermore, present study's patients with PR had longer OS.
CONCLUSION
The present findings show that metabolic response to first-line therapy (according to PERCIST) was predictive of OS and PFS in patients with advanced-stage NSCLC. Assessment of metabolic response after second cycle of chemotherapy was more reliable than that after first cycle of chemotherapy for predicting survival in cases of advanced-stage NSCLC.
Acknowledgment
The researchers thank Mr. Turkay Toklu and Mr. Ertan Koc for performing statistical analysis.
Footnotes
Abbreviations: CR = complete metabolic response, ECOG PS = Eastern Cooperative Group Scale performance status, 18F-FDG-PET = 18F-fluorodeoxyglucose positron emission tomography, NSCLC = non-small-cell lung cancer, OS = overall survival, PR = partial metabolic response, PERCIST = PET response criteria in solid tumors, PFS = progression-free survival, PD = progressive metabolic disease, RECIST = response evaluation criteria in solid tumors, SD = stable metabolic disease.
The authors declare they have no conflicts of interest- financial or otherwise- related to the materials presented herein.
REFERENCES
- 1.Jemal A, Bray F, Center MM. Global cancer statistics. CA Cancer J Clin 2011; 61:69–90. [DOI] [PubMed] [Google Scholar]
- 2.Martin J, Ginsberg RJ, Venkatraman ES, et al. Long-term results of combined-modality therapy in resectable non-small-cell lung cancer. J Clin Oncol 2002; 20:1989–1995. [DOI] [PubMed] [Google Scholar]
- 3.Hicks RJ. Role of 18F-FDG PET in assessment of response in non-small cell lung cancer. J Nucl Med 2009; 50:31–42. [DOI] [PubMed] [Google Scholar]
- 4.Mac Manus MP, Hicks RJ, Matthews JP, et al. Positron emission tomography is superior to computed tomography scanning for response-assessment after radical radiotherapy or chemoradiotherapy in patients with non-small-cell lung cancer. J Clin Oncol 2003; 21:1285–1292. [DOI] [PubMed] [Google Scholar]
- 5.Breathnach OS, Freidlin B, Conley B, et al. Twenty-two years of phase III trials for patients with advanced non-small-cell lung cancer: sobering results. J Clin Oncol 2001; 19:1734–1742. [DOI] [PubMed] [Google Scholar]
- 6.Sekine I, Tamura T, Kunitoh H, et al. Progressive disease rate as a surrogate endpoint of phase II trials for non-small-cell lung cancer. Ann Oncol 1999; 10:731–733. [DOI] [PubMed] [Google Scholar]
- 7.Ohtsuka T, Nomori H, Watanabe K, et al. Prognostic significance of [(18)F]fluorodeoxyglucose uptake on positron emission tomography in patients with pathologic stage I lung adenocarcinoma. Cancer 2006; 107:2468–2473. [DOI] [PubMed] [Google Scholar]
- 8.Keidar Z, Haim N, Guralnik L, et al. PET/CT using 18F-FDG in suspected lung cancer recurrence: diagnostic value and impact on patient management. J Nucl Med 2004; 45:1640–1646. [PubMed] [Google Scholar]
- 9.Decoster L, Schallier D, Everaert H, et al. Complete metabolic tumour response, assessed by 18-fluorodeoxyglucose positron emission tomography (18FDG-PET), after induction chemotherapy predicts a favourable outcome in patients with locally advanced non-small cell lung cancer (NSCLC). Lung Cancer 2008; 62:55–61. [DOI] [PubMed] [Google Scholar]
- 10.Eschmann SM, Friedel G, Paulsen F, et al. 18F-FDG PET for assessment of therapy response and preoperative re-evaluation after neoadjuvant radio-chemotherapy in stage III non-small cell lung cancer. Eur J Nucl Med Mol Imaging 2007; 34:463–471. [DOI] [PubMed] [Google Scholar]
- 11.Hoekstra CJ, Stroobants SG, Smit EF, et al. Prognostic relevance of response evaluation using [18F]-2-fluoro-2-deoxy-D-glucose positron emission tomography in patients with locally advanced non-small-cell lung cancer. J Clin Oncol 2005; 23:8362–8370. [DOI] [PubMed] [Google Scholar]
- 12.Novello S, Vavala T, Levra MG, et al. Early response to chemotherapy in patients with non-small-cell lung cancer assessed by [18F]-fluoro-deoxy-D-glucose positron emission tomography and computed tomography. Clin Lung Cancer 2013; 14.:230–237. [DOI] [PubMed] [Google Scholar]
- 13.Weber WA, Petersen V, Schmidt B, et al. Positron emission tomography in non-small-cell lung cancer: prediction of response to chemotherapy by quantitative assessment of glucose use. J Clin Oncol 2003; 21:2651–2657. [DOI] [PubMed] [Google Scholar]
- 14.de Geus-Oei LF, van der Heijden HF, Visser EP, et al. Chemotherapy response evaluation with 18F-FDG PET in patients with non-small cell lung cancer. J Nucl Med 2007; 48:1592–1598. [DOI] [PubMed] [Google Scholar]
- 15.Lee DH, Kim SK, Lee HY, et al. Early prediction of response to first-line therapy using integrated 18F-FDG PET/CT for patients with advanced/metastatic non-small cell lung cancer. J Thorac Oncol 2009; 4:816–821. [DOI] [PubMed] [Google Scholar]
- 16.Nahmias C, Hanna WT, Wahl LM, et al. Time course of early response to chemotherapy in non-small cell lung cancer patients with 18F-FDG PET/CT. J Nucl Med 2007; 48:7544–7551. [DOI] [PubMed] [Google Scholar]
- 17.Wahl RL, Jacene H, Kasamon Y, Lodge MA. From RECIST to PERCIST: evolving Considerations for PET response criteria in solid tumors. J Nucl Med 2009; 50:122–150. [DOI] [PMC free article] [PubMed] [Google Scholar]
- 18.Hoang JK, Hoagland LF, Coleman RE, et al. Prognostic value of fluorine-18 fluorodeoxyglucose positron emission tomography imaging in patients with advanced-stage non-small-cell lung carcinoma. J Clin Oncol 2008; 26:1459–1464. [DOI] [PubMed] [Google Scholar]
- 19.Kaplan EL, Meier P. Nonparametric estimation from incomplete observations. J Am Stat Assoc 1958; 53:457–481. [Google Scholar]
- 20.Peto R, Peto J. Asymptotically efficient rank invariant test procedures. J R Stat Soc Ser A 1972; 135:185–207. [Google Scholar]
- 21.Cox DR. Regression models and life tables. J R Stat Soc Ser B 1972; 34:187–220. [Google Scholar]
- 22.Weber WA, Figlin R. Monitoring cancer treatment with PET/CT: does it make a difference? J Nucl Med 2007; 48:36–44. [PubMed] [Google Scholar]
- 23.Avril N, Sassen S, Schmalfeldt B, et al. Prediction of response to neoadjuvant chemotherapy by sequentialF-18-fluorodeoxyglucose positron emission tomography in patients with advanced-stage ovarian cancer. J ClinOncol 2005; 20:7445–7453. [DOI] [PubMed] [Google Scholar]