Abstract
Purpose
To answer the question whether the TSI (tissue strain imaging) sonoelastography technique can contribute to the diagnosis of chronic renal allograft damage.
Material and methods
A prospective study of 112 patients between June 2010 and April 2011 was conducted to compare elastography data with biopsy results and laboratory parameters in order to determine whether any correlations exist. Elastography parameters were acquired with a high-end ultrasound system and analyzed using the semiquantitative strain ratio. For comparison, patients were divided into three groups based on biopsy findings (Banff classification): group A: biopsy not necessary; group B: Banff grade I; group C: Banff grades II and III. Correlations were assessed by means of correlation (Pearson) and regression analysis. Differences between ordinal groups were tested for statistical significance by the Mann-Whitney U test.
Results
Mean patient age was 54.2 ± 15.01 years. Fifty-nine percent of the patients were male. The calculated TSI strain ratio of groups A and C differed significantly (p = 0.024). Groups B and C (p = 0.056) and groups A and B (p = 0.88) showed no significant difference. The TSI strain ratio did not correlate with glomerular filtration rate (r = 0.105) or creatinine (r = 0.092).
Conclusion
The TSI sonoelastography technique can contribute to the differentiation of different stages of renal graft damage (according to Banff classification). However, significant results were not observed for all investigated features. The TSI technique should be further evaluated in future studies including larger numbers of patients.
Keywords: elastography, kidney, allograft, ultrasound, tissue strain imaging
Abstract
Cel
Celem niniejszej pracy było sprawdzenie, czy sonoelastografia TSI (tissue strain imaging – obrazowanie odkształcenia tkanek) może pomóc w rozpoznaniu przewlekłego uszkodzenia nerki przeszczepionej.
Materiał i metody
Badanie prospektywne, przeprowadzone od czerwca 2010 do kwietnia 2011 roku, objęło 112 pacjentów. Porównano dane uzyskane w badaniu elastograficznym z wynikami biopsji oraz z parametrami laboratoryjnymi w celu zbadania ewentualnych zależności między nimi. Dane elastograficzne zostały uzyskane przy użyciu wysokiej klasy sprzętu ultrasonograficznego, a ich analizę przeprowadzono, wykorzystując półilościowy wskaźnik odkształcenia (semiquantitative strain ratio). W celach porównawczych pacjenci zostali podzieleni na trzy grupy na podstawie wyniku biopsji (według klasyfikacji Banff): grupa A: biopsja nie jest konieczna, grupa B: stopień I w klasyfikacji Banff oraz grupa C: stopnie II i III według klasyfikacji Banff. Korelacje oceniono za pomocą analizy korelacji (Pearsona) i regresji. Z kolei do oceny istotności statystycznej różnic między badanymi grupami posłużył test U Manna-Whitneya.
Wyniki
Średnia wieku pacjentów wynosiła 54,2 ± 15,01 roku. Mężczyźni stanowili 59% badanych. Wykazano istotną różnicę między wskaźnikami odkształcenia TSI dla grup A i C (p = 0,024). Nie wykazano natomiast istotnych różnic między grupami B i C (p = 0,056) oraz A i B (p = 0,88). Nie wykazano również korelacji pomiędzy wskaźnikiem odkształcenia TSI a współczynnikiem przesączania kłębuszkowego (r = 0,105) i kreatyniną (r = 0,092).
Wnioski
Sonoelastografia TSI może pomóc w różnicowaniu poszczególnych stadiów uszkodzenia przeszczepu (na podstawie klasyfikacji Banff). Jednak nie dla wszystkich badanych cech otrzymane wyniki były istotne statystycznie. Technika TSI powinna być przedmiotem dalszych badań obejmujących większą liczbę pacjentów.
Introduction
In recent years, there has been an increasing scientific interest in sonoelastography as a noninvasive diagnostic tool for detecting tissue abnormalities. Measurement of elastic properties in different body regions can provide information on pathologies ranging from inflammatory processes to malignant tumors(1). Different technical approaches of sonoelastography have been pursued and shown promising results.
Examples include the diagnosis and characterization of lesions in the breast or prostate(1–6) and the diagnostic evaluation of liver pathologies(7). Recently, a controversy has arisen as to whether sonoelastography is also suitable for identifying graft failure in kidney transplant recipients(8–13).
So far, only sonographic techniques that are based on shear wave technology have been used to assess elastography data of the kidney including the sonographic technique of transient elastography (TE) and the technique of acoustic radiation force impulse (ARFI). Both techniques have been mainly used for assessing liver fibrosis.
Currently, a variety of diagnostic tools are in use to identify renal graft dysfunction following transplantation. Ultrasound with contrast medium has been found useful for evaluating graft function in transplant recipients(14). The most widely used routine diagnostic techniques are laboratory tests and (Doppler) ultrasound(15). The latter can reveal morphologic abnormalities and provides information on graft perfusion (resistance index, RI). In patients with progressive graft deterioration in serial examinations, biopsy continues to be the gold standard for confirming or ruling out suspected graft failure. A biopsy is invasive and carries some risk. It would therefore be very helpful to have a valid noninvasive diagnostic alternative for assessing renal transplant function. Sonoelastography might be a promising candidate.
The aim of the present study was to evaluate the potential of tissue strain imaging (TSI) – an offline sonoelastography technique – for detecting chronic renal allograft damage. We compared renal elastography findings with laboratory parameters and biopsy results in renal transplant recipients and tested for correlations.
Material and methods
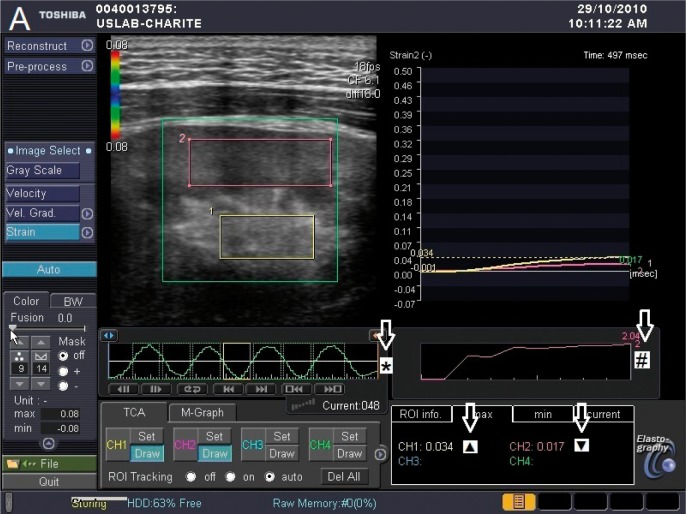
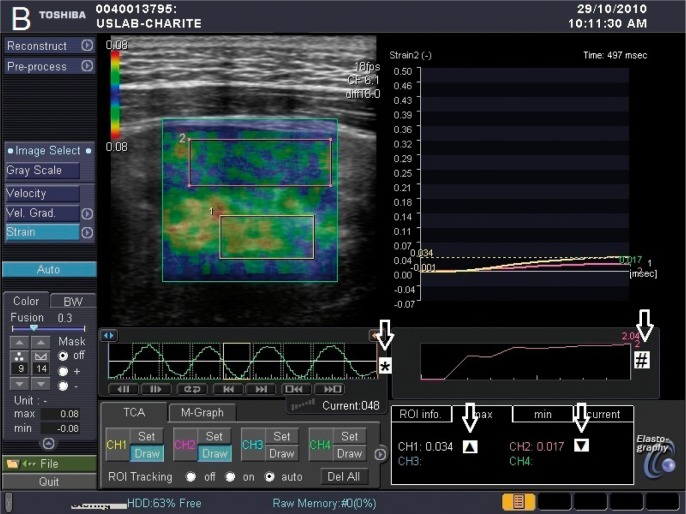
Between June 2010 and April 2011, a total of 122 renal transplant recipients followed up by the interdisciplinary aftercare service (radiology/nephrology) of Charité – Universitätsmedizin Berlin were included in the study. Transplantations took place between 1991 and 2010. Hence, the follow-up included examinations of one-yearold to 19-year-old transplants. The patients who were included had to consent to ultrasound elastography and storage of data. Adequate TSI elastography was accomplished in 112 cases, meaning that the colored overlay display was complete within the region of interest (ROI) and the elastogram reflected the whole selected region within the parenchyma and calyces respectively (see fig. 1). Two patients did not match these prerequisites due to obesity (BMI > 35 kg/m2) and TSI elastography was not possible in these cases. In four patients, the system's integrated display of transducer pressure revealed that the pressure applied was not constant; these cases were excluded from analysis. In another four cases, patient files in the nephrology database were incomplete. As stated, a total of 112 cases could finally be included in the analysis.
Fig. 1 A.
Display without colored overlay of elastography properties
TSI elastogram: ROI in renal pelvic-calyceal system (1) and renal parenchyma (2).
* Sinusoidal compression gradient. The yellow rectangle marks the moment of elastography measurement (during decompression).
# Displays consistent pressure application during compression time.
▲ Dimensionless elastography value in renal pelvic-calyceal system.
▼ Dimensionless elastography value in renal parenchyma.
Fig. 1 B.
Display with colored overlay of elastography properties
TSI elastogram: ROI in renal pelvic-calyceal system (1) and renal parenchyma (2).
* Sinusoidal compression gradient. The yellow rectangle marks the moment of elastography measurement (during decompression).
# Displays consistent pressure application during compression time.
▲ Dimensionless elastography value in renal pelvic-calyceal system.
▼ Dimensionless elastography value in renal parenchyma.
Ultrasound examination
TSI was performed using a high-end ultrasound system (Aplio XG SSA-790A, Toshiba, Otawara, Japan) with an 8 MHz PLT 805 AT linear transducer. B-mode image quality was optimized using integrated options for improving axial and lateral resolution and reducing noise (tissue harmonic imaging and standardized preset options). All examinations were performed by the same investigator (JK).
First, the transplant kidney was identified in the longitudinal B-mode view, which was followed by ten cycles of controlled compression and release. The sonographic raw data acquired during these cycles were stored on the system's hard disc for offline processing. The TSI technique does not allow real-time assessment of tissue elasticities. The examiner places regions of interest (ROI) in the target area, for which the system then generates an elastogram with color-coded elasticity information that is superimposed on the B-mode image. The ROIs are two large rectangles covering a representative parenchymal region (approx. 4 cm2 of size) and a second representative area of the calyceal system (approx. 2 cm2 of size). The size of all evaluated ROIs was similar and varied within a range of max. ± 10% (in each the parenchymal and the calyceal ROI). This analysis included only those cases in which the pressure display confirmed that uniform transducer pressure had been applied and the compressionrelease cycles resulted in a sinus-shaped curve (see fig. 1). Elasticity information was recorded during the release phases in order to standardize the point of time where elastography data was collected and to be able to better compare interindividual results. At the time of TSI, the examiner was unaware of biopsy findings and laboratory parameters. For a detailed description of the TSI technique, the reader is referred to an article that appeared in “Academic Radiology” in 2007(6).
Data analysis
When interpreting an elastogram, one must be aware that the colors display relative elasticities of the target tissues rather than absolute values. This means that, in each examination, the whole spectrum of colors from red to blue may be present in the target anatomy(16). For comparison of findings in different patients, ratios were calculated of calyceal elasticity to parenchymal elasticity. This so-called strain ratio is a measure of the difference in elasticity between these two tissues of the kidney and allows interindividual comparison of the relationship of calyceal elasticity to parenchymal elasticity:
The strain ratio is the reference measure of sonographically determined tissue elasticity and is used for comparison with biopsy findings and laboratory parameters(17).
Histology
In 19 cases, biopsy findings were available for comparison. Biopsies were obtained with a high speed Bard MAGNUM biopsy system (Bard, Tempe, AZ, USA) with a 14 g × 16 cm biopsy needle.
Renal allograft fibrosis was graded using the Banff classification (see tab. 1)(18) of renal transplant pathology and was used for assigning the patients to one of three groups (group A: biopsy not necessary, n = 94; group B: Banff grade I, n = 16; group C: Banff grades II and III, n = 3) (see tab. 3). Patients in group A had an uneventful clinical and ultrasound-morphological course with stable allograft function, and no biopsy was required. The probability of fibrosis in this group is low.
Tab. 1.
Banff classification(18)
| Banff classification | |
|---|---|
| Group I | Mild interstitial fibrosis and tubular atrophy (< 25% of cortical area), no evidence of any specific etiology (may include nonspecific vascular and glomerular sclerosis) |
| Group II | Moderate interstitial fibrosis and tubular atrophy (26–50% of cortical area), may include nonspecific vascular and glomerular sclerosis (as above) |
| Group III | Severe interstitial fibrosis and tubular atrophy/loss (> 50% of cortical area), may include nonspecific vascular and glomerular sclerosis (as above) |
Tab. 3.
Groups according to Banff classification and TSI elastography results
| Group | Banff classification | n | Mean TSI strain ratio ± SD | TSI calyceal values ± SD | TSI parenchymal values ± SD |
|---|---|---|---|---|---|
| A | Patients without biopsy | 94 | 2,34 ± 1,29 | 0,054 ± 0,028 | 0,023 ± 0,013 |
| B | Patients Banff I | 16 | 2,14 ± 0,78 | 0,045 ± 0,026 | 0,021 ± 0,008 |
| C | Patients Banff II and III | 3 | 1,14 ± 0,37 | 0,032 ± 0,014 | 0,029 ± 0,027 |
Statistical analysis
The data were analyzed using SPSS Statistics, version 19 (SPSS Inc., Chicago, IL). Associations between elastography parameters and biopsy results or functional laboratory parameters were evaluated using Pearson correlation and regression analysis. Descriptive statistical data are given as means and standard deviations and represented as box-and-whisker plots. The box contains the first and third quartiles (interquartile range, IQR). The line in the box indicates the median. The whiskers correspond to the 1.5-fold IQR. Values outside this range are marked. Differences in ordinal data were tested for significance using the Mann-Whitney U test. Multivariate analysis was performed using a linear model and taking covariates into account. Statistical significance was assumed at p values < 0.05.
Results
Elastography data from a total of 112 patients were included in the analysis. The patients had a mean age of 54.2 ± 15.01 years. Fifty-seven percent were male; 72.3% of the recipients had received kidneys from postmortem donors. The patient data are summarized in tab. 2.
Tab. 2.
Overview of patient population
| Minimum | Maximum | Mean ± SD | |
|---|---|---|---|
| Patient age (years) | 19 | 79 | 54,23 ± 15,01 |
| Patient sex | 59% male | ||
| Donor type (deceased or living) | 72.3% deceased donors | ||
| Transplant age (years) | 9 | 77 | 50,17 ± 15,75 |
| Time between transplantation and ultrasound examination (days) | 72 | 7077 | 1510 ± 1690 |
| Cold ischemia time (min) | 30 | 1560 | 590 ± 363 |
| Mixed ischemia time (min) | 25 | 110 | 53,5 ± 15,8 |
| GFR (ml/min) | 4,98 | 138 | 45,26 ± 20,42 |
| Creatinine (mg/dl) | 0,64 | 9,13 | 1,90 ± 1,16 |
| Transplant size (cm) | 9 | 14 | 11,32 ± 1,25 |
| Resistance Index (RI) | 0,50 | 1,00 | 0,73 ± 0,09 |
| TSI strain ratio | 0,71 | 8,77 | 2,25 ± 1,22 |
Mean TSI strain ratios by Banff group are presented in tab. 3.
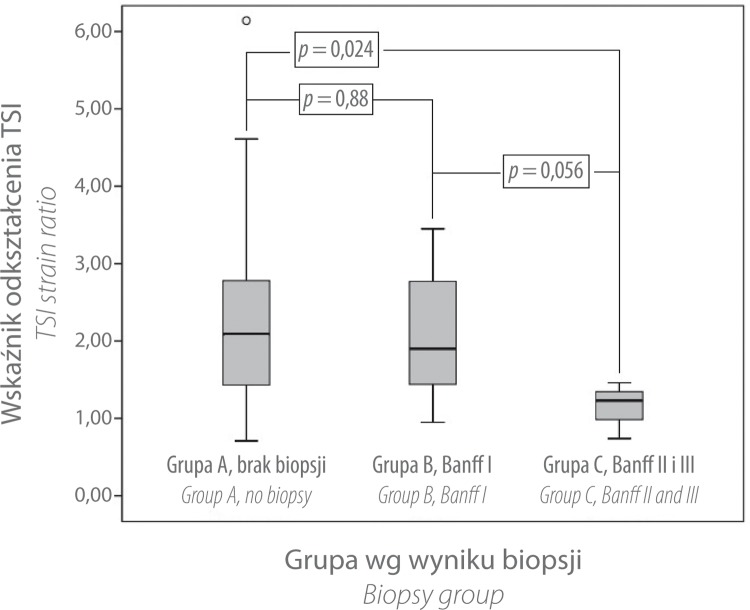
There was a significant difference in TSI strain ratios between groups A and C (p = 0.024). The difference remained significant after multivariate correction for the following factors: interval between transplant operation and time of ultrasound examination, pole distance, cold ischemia time, mixed ischemia time, mode of kidney donation, age of donor, and resistance index (RI). The differences between groups B and C (p = 0.056) and groups A and B (p = 0.88) were not significant (see fig. 2).
Fig. 2.
Box-whisker-plot of TSI strain ratio regarding the different biopsy groups. There is a significant difference between groups A and C (p = 0.024). No significant difference was shown between groups B and C (p = 0.056) and groups A and B (p = 0.88)
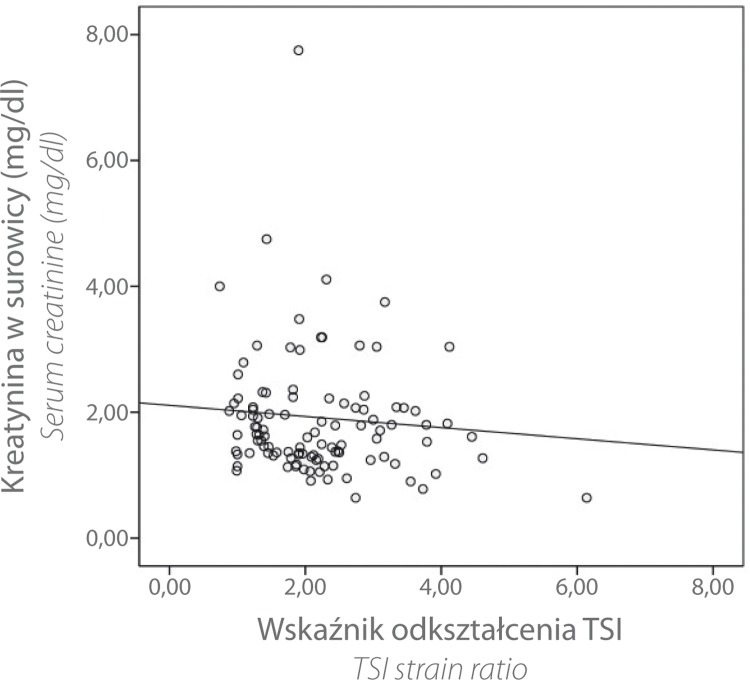
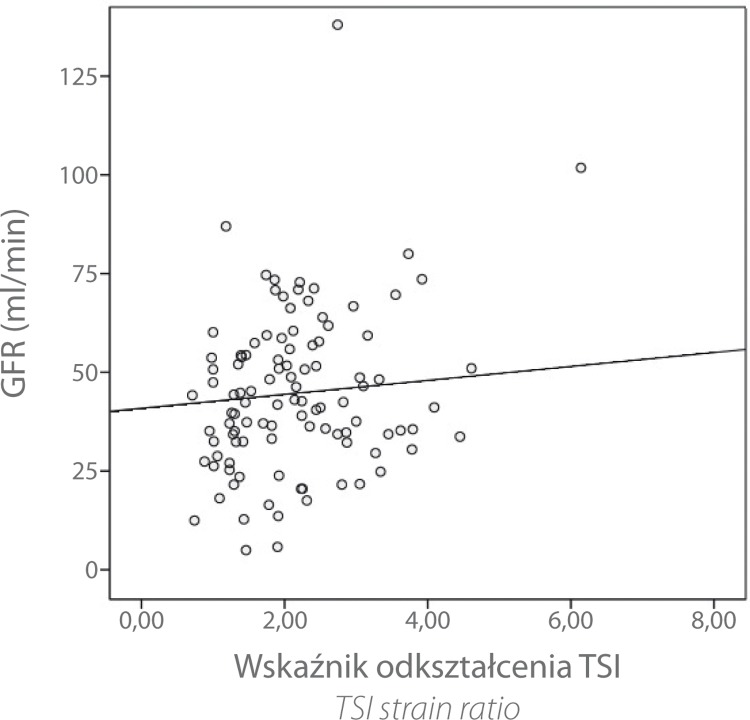
There was no significant correlation between the TSI strain ratio and serum creatinine (r = 0.092 with p = 0.167) or between the TSI strain ratio and glomerular filtration rate (GFR) (r = 0.105 with p = 0.136). Descriptively, however, the point diagram indicated a trend: an increasing TSI strain ratio appeared to be associated with a decrease in creatinine levels and increase in GFR (see figs. 3 and 4).
Fig. 3.
Scatter chart TSI strain ratio vs. serum creatinine
Fig. 4.
Scatter chart TSI strain ratio vs. glomerular filtration rate (GFR)
Discussion
To our knowledge, this is the first study that examines renal allografts using TSI elastography. Several recent studies have shown the benefit of sonoelastography in other organs, particularly for the detection of cancer of the breast(5, 6, 19) and of the prostate(2, 3). Promising results with sonoelastography have also been obtained in grading liver fibrosis in patients with chronic hepatitis(20–22). Whether sonoelastography is also useful for evaluating the degree of fibrosis in the assessment of renal graft function is still a controversial issue.
In a study of 20 biopsied patients conducted in 2009, Arndt et al.(8) showed a significant correlation between the degree of fibrosis of kidney grafts and sonographic elastography values. The authors also found significant differences in elastography values between different groups differentiated on the basis of GFR. They employed the sonographic technique of transient elastography (TE), which relies on shear waves and is different from the TSI technique used in our study. So far, TE has been mainly used for assessing liver fibrosis. Another difference between the two techniques is the choice of target region investigated. The technique of TE precludes the choice of a specific ROI by the examiner. The sampling box – meaning the area covered by the examination – is a predefined rectangle measuring approx. 10 × 25 mm; however, its exact position can only be roughly estimated.
Similar results were reported by Stock et al. for the acoustic radiation force impulse (ARFI) technique – another technique based on shear waves – in 2010 and 2011. In these studies of 18(9) and 8(10) patients, the authors found significant differences in elastography values determined by ARFI between different groups of transplant recipients classified according to biopsy findings.
Syversveen et al.(11) did not confirm these results. They found no significant differences in ARFI elastography results between different Banff groups.
A recent study in a rat model(12) found no clear correlation between the degree of renal parenchymal fibrosis and sonographic elasticity values.
We found marked differences only for some of the patient groups distinguished on the basis of biopsy findings. In general, the mean TSI strain ratio decreases as the degree of fibrosis increases (higher Banff groups).
It follows from this observation and the definition of strain ratio that, with increasing severity of fibrosis, either parenchymal elasticity increases or calyceal elasticity decreases. This observation might appear surprising as we would expect to observe a decrease in renal parenchymal stiffness as the severity of fibrosis increases. Actually, however, parenchymal elasticity was found to be relatively stable or even tended to increase slightly. Instead, we found a more marked mean decrease in calyceal elasticity with higher Banff groups. This explains the decreasing strain ratios, which is nearly one in biopsy group C (Banff II and III). Hence, with increasing fibrosis (on the basis of histology), there is an approximation of calyceal and parenchymal elasticity measured by sonoelastography. However, it remains open whether this finding reflects a true decrease in calyceal tissue. It is also conceivable that hardening of the parenchyma with increasing fibrosis may impair the sonoelastic evaluation of the underlying calyceal tissue. It is possible that shrinkage of the fibrotic parenchyma impairs pressure coupling to the calyceal system, resulting in underestimation of calyceal elasticity.
Banff classification not only shows the grade of fibrosis, but also takes inflammatory changes of the tissue into account. Corollary, a diffuse tissue hardening might be the result of an inflammatory process that can't be distinguished from fibrosis of other pathological reasons using sonoelastography.
Overall, the decreasing strain ratio suggests that a higher Banff group is associated with a change in the sonographic elasticity of the entire kidney graft. At present, it remains open whether the observed change is due to an inherent artifact of sonoelastography.
The differences in the pairwise group comparisons are not always statistically significant. This is due to the small numbers of cases, especially in group C (Banff II and III). A significant correlation with clinical parameters – serum creatinine and estimated GFR – cannot be established; however, there is a trend toward lower TSI strain ratios with higher serum creatinine levels and lower GFR.
Limitations
Acceptable biopsy results were available for only 19 of the 112 renal graft recipients included in the analysis of sonoelastography. This limits our results with regard to a possible correlation between biopsy results and sonoelastography data.
Sonographic elastography is not yet a standardized diagnostic procedure. Nevertheless, an attempt was made to perform the elastography examination in a reproducible manner, but deviations from the intended procedure cannot be fully excluded. One factor is that pressure with the transducer is applied manually and hence the amount of pressure is examiner-dependent. While this allows easy clinical handling of the technique, it precludes the application of controlled pressures as it would be possible in an experimental setting.
Conclusions
All results considered, our findings suggest that offline analysis of tissue elasticity measured by TSI elastography in kidney grafts can contribute to the grading of fibrosis compared with biopsy results. However, the small number of patients for whom biopsy results were available does not allow definitive correlation of sonoelasticity for all stages of fibrosis verified by biopsy. The results are promising and larger studies should be conducted to further explore the potential of this easy to handle and noninvasive technique in the clinical setting.
Conflict of interest
Authors do not report any financial or personal links with other persons or organizations, which might affect negatively the content of this publication and/or claim authorship rights to this publication.
References
- 1.Thomas A, Kümmel S, Fritzsche F, Warm M, Ebert B, Hamm B, et al. Real-time sonoelastography performed in addition to B-mode ultrasound and mammography: improved differentiation of breast lesions? Acad Radiol. 2006;13:1496–1504. doi: 10.1016/j.acra.2006.08.012. [DOI] [PubMed] [Google Scholar]
- 2.Dudea SM, Giurgiu CR, Dumitriu D, Chiorean A, Ciurea A, Botar-Jid C, et al. Value of ultrasound elastography in the diagnosis and management of prostate carcinoma. Med Ultrason. 2011;13:45–53. [PubMed] [Google Scholar]
- 3.Brock M, von Bodman C, Palisaar RJ, Löppenberg B, Sommerer F, Deix T, et al. The impact of real-time elastography guiding a systematic prostate biopsy to improve cancer detection rate: a prospective study of 353 patients. J Urol. 2012;187:2039–2043. doi: 10.1016/j.juro.2012.01.063. [DOI] [PubMed] [Google Scholar]
- 4.Adamietz BR, Kahmann L, Fasching PA, Schulz-Wendtland R, Uder M, Beckmann MW, et al. Differentiation between phyllodes tumor and fibroadenoma using real-time elastography. Ultraschall Med. 2011;(32 Suppl 2):E75–E79. doi: 10.1055/s-0031-1282024. [DOI] [PubMed] [Google Scholar]
- 5.Barr RG, Destounis S, Lackey LB, 2nd, Svensson WE, Balleyguier C, Smith C. Evaluation of breast lesions using sonographic elasticity imaging: a multicenter trial. J Ultrasound Med. 2012;31:281–287. doi: 10.7863/jum.2012.31.2.281. [DOI] [PubMed] [Google Scholar]
- 6.Thomas A, Warm M, Hoopmann M, Diekmann F, Fischer T. Tissue Doppler and strain imaging for evaluating tissue elasticity of breast lesions. Acad Radiol. 2007;14:522–529. doi: 10.1016/j.acra.2006.12.016. [DOI] [PubMed] [Google Scholar]
- 7.Castera L, Forns X, Alberti A. Non-invasive evaluation of liver fibrosis using transient elastography. J Hepatol. 2008;48:835–847. doi: 10.1016/j.jhep.2008.02.008. [DOI] [PubMed] [Google Scholar]
- 8.Arndt R, Schmidt S, Loddenkemper C, Grünbaum M, Zidek W, van der Giet M, et al. Noninvasive evaluation of renal allograft fibrosis by transient elastography – a pilot study. Transpl Int. 2010;23:871–877. doi: 10.1111/j.1432-2277.2010.01057.x. [DOI] [PubMed] [Google Scholar]
- 9.Stock KF, Klein BS, Vo Cong MT, Sarkar O, Römisch M, Regenbogen C, et al. ARFI-based tissue elasticity quantification in comparison to histology for the diagnosis of renal transplant fibrosis. Clin Hemorheol Microcirc. 2010;46:139–148. doi: 10.3233/CH-2010-1340. [DOI] [PubMed] [Google Scholar]
- 10.Stock KF, Klein BS, Cong MTV, Regenbogen C, Kemmner S, Büttner M, et al. ARFI-based tissue elasticity quantification and kidney graft dysfunction: first clinical experiences. Clin Hemorheol Microcirc. 2011;49:527–535. doi: 10.3233/CH-2011-1503. [DOI] [PubMed] [Google Scholar]
- 11.Syversveen T, Brabrand K, Midtvedt K, Strøm EH, Hartmann A, Jakobsen JA, et al. Assessment of renal allograft fibrosis by acoustic radiation force impulse quantification – a pilot study. Transpl Int. 2011;24:100–105. doi: 10.1111/j.1432-2277.2010.01165.x. [DOI] [PubMed] [Google Scholar]
- 12.Derieppe M, Delmas Y, Gennisson JL, Deminière C, Placier S, Tanter M, et al. Detection of intrarenal microstructural changes with supersonic shear wave elastography in rats. Eur Radiol. 2012;22:243–250. doi: 10.1007/s00330-011-2229-9. [DOI] [PubMed] [Google Scholar]
- 13.Grenier N, Poulain S, Lepreux S, Gennisson JL, Dallaudière B, Lebras Y, et al. Quantitative elastography of renal transplants using supersonic shear imaging: a pilot study. Eur Radiol. 2012;22:2138–2146. doi: 10.1007/s00330-012-2471-9. [DOI] [PubMed] [Google Scholar]
- 14.Fischer T, Filimonow S, Rudolph J, Morgera S, Budde K, Slowinski T, et al. Arrival time parametric imaging: a new ultrasound technique for quantifying perfusion of kidney grafts. Ultraschall Med. 2008;29:418–423. doi: 10.1055/s-2006-927269. [DOI] [PubMed] [Google Scholar]
- 15.Josephson MA. Monitoring and managing graft health in the kidney transplant recipient. Clin J Am Soc Nephrol. 2011;6:1774–1780. doi: 10.2215/CJN.01230211. [DOI] [PubMed] [Google Scholar]
- 16.Janssen J. (E)US-Elastografie: Heutiger Stand und Perspektiven. Z Gastroenterol. 2008;46:572–579. doi: 10.1055/s-2008-1027379. [DOI] [PubMed] [Google Scholar]
- 17.Fischer T, Peisker U, Fiedor S, Slowinski T, Wedemeyer P, Diekmann F, et al. Significant differentiation of focal breast lesions: raw data-based calculation of strain ratio. Ultraschall Med. 2012;33:372–379. doi: 10.1055/s-0031-1273222. [DOI] [PubMed] [Google Scholar]
- 18.Sis B, Mengel M, Haas M, Colvin RB, Halloran PF, Racusen LC, et al. Banff '09 meeting report: antibody mediated graft deterioration and implementation of Banff working groups. Am J Transplant. 2010;10:464–471. doi: 10.1111/j.1600-6143.2009.02987.x. [DOI] [PubMed] [Google Scholar]
- 19.Garra BS. Elastography: current status, future prospects, and making it work for you. Ultrasound Q. 2011;27:177–186. doi: 10.1097/RUQ.0b013e31822a2138. [DOI] [PubMed] [Google Scholar]
- 20.Wang J, Guo L, Shi X, Pan W, Bai Y, Ai H. Real-time elastography with a novel quantitative technology for assessment of liver fibrosis in chronic hepatitis B. Eur J Radiol. 2012;81:e31–e36. doi: 10.1016/j.ejrad.2010.12.013. [DOI] [PubMed] [Google Scholar]
- 21.Arena U, Vizzutti F, Abraldes JG, Corti G, Stasi C, Moscarella S, et al. Reliability of transient elastography for the diagnosis of advanced fibrosis in chronic hepatitis C. Gut. 2008;57:1288–1293. doi: 10.1136/gut.2008.149708. [DOI] [PubMed] [Google Scholar]
- 22.Friedrich-Rust M, Ong MF, Herrmann E, Dries V, Samaras P, Zeuzem S, et al. Real-time elastography for noninvasive assessment of liver fibrosis in chronic viral hepatitis. AJR Am J Roentgenol. 2007;188:758–764. doi: 10.2214/AJR.06.0322. [DOI] [PubMed] [Google Scholar]


