

Significance
Besides van der Waals and electrostatic interactions, surfaces in water experience solvation forces arising from the interfacial water structure that become dominant at small surface separations. Using a combination of atomistic simulations and theoretical arguments, we construct a universal adhesion state diagram for two neutral surfaces with different water affinities. We find an intermediate regime of affinity combinations where the surfaces adhere to each other without an intervening water film. This dry adhesion also occurs for a surface with high water affinity if the other surface has a very low water affinity. These results not only explain how surfaces interact in water but also are relevant for designing synthetic surfaces that efficiently bind to particles with given surface properties.
Keywords: solvation, adhesion, cavitation, contact angle, MD simulations
Abstract
Using all-atom molecular dynamics (MD) simulations at constant water chemical potential in combination with basic theoretical arguments, we study hydration-induced interactions between two overall charge-neutral yet polar planar surfaces with different wetting properties. Whether the water film between the two surfaces becomes unstable below a threshold separation and cavitation gives rise to long-range attraction, depends on the sum of the two individual surface contact angles. Consequently, cavitation-induced attraction also occurs for a mildly hydrophilic surface interacting with a very hydrophobic surface. If both surfaces are very hydrophilic, hydration repulsion dominates at small separations and direct attractive force contribution can—if strong enough—give rise to wet adhesion in this case. In between the regimes of cavitation-induced attraction and hydration repulsion we find a narrow range of contact angle combinations where the surfaces adhere at contact in the absence of cavitation. This dry adhesion regime is driven by direct surface–surface interactions. We derive simple laws for the cavitation transition as well as for the transition between hydration repulsion and dry adhesion, which favorably compare with simulation results in a generic adhesion state diagram as a function of the two surface contact angles.
According to the classical Derjaguin–Landau–Verwey–Overbeek (DLVO) theory, the interaction between hydrated surfaces is given by the sum of van der Waals (vdW) and screened electrostatic interactions (1). Although this approach works well in many situations, subnanometer resolved force measurements between individual surfaces demonstrated that additional water-mediated interactions are dominant at small separations and depend crucially on the polarity or wetting properties of the surfaces (2–4). Understanding these solvation-induced interactions is still a central issue in all fields concerned with forces between surfaces, colloids, and macromolecular aggregates in water.
As is well known, the water film between two hydrophobic surfaces, characterized by water contact angles , becomes free-energetically unstable below a critical distance and in equilibrium cavitation leads to vapor bubble-induced long-ranged attraction (5–7). Conversely, polar and overall neutral surfaces, characterized by small or vanishing contact angles, exhibit pronounced short-ranged repulsive forces, which decay exponentially with a characteristic length in the subnanometer range (8–11). These so-called hydration forces arise from the complex interplay of surface group configurational degrees of freedom, desorption of hydration water from polar surface groups, and ordering of the intersurface water film (4). The understanding of hydration forces has recently been advanced by computer simulations that include explicit water molecules (12–14).
In the absence of direct surface–surface interactions, the transition between cavitation-induced attraction and hydration repulsion should coincide with the contact angle characterizing the border between hydrophilic and hydrophobic surface properties; i.e., . In contrast, experiments probing the interactions between similar neutral surfaces with well-defined contact angles demonstrated that even hydrophilic surfaces exhibit short-range attractions not accountable by vdW forces down to typical adhesive contact angles of – (15–18). Comparable results were recently obtained in simulations, where the adhesion behavior was shown to depend crucially on the surface adhesion energy (19). A transition between dry adhesion and hydration repulsion was seen for typical surface contact angle values in the range of –, depending on the mechanical stiffness and the hydrogen-bonding capability of the surfaces (19), the values of being quite similar to those in experiments (15–18).
The above-mentioned references all deal with situations where the two interacting surfaces are identical in chemical surface structure and thus have the same contact angles. Although of conceptual importance, this symmetric scenario constitutes an exception rather than a rule. Most practical situations involve two dissimilar surfaces, for example nanoparticles interacting with cell membranes (20) or weak protein–protein interactions (21). In fact, a number of experimental model studies addressed the interactions between dissimilar surfaces and the particularly interesting case of hydrophobic–hydrophilic surfaces (2, 3, 22–26). The results are rather multifaceted and cannot be easily cast in a unified picture, yet, in one study an empirical sum rule for the interaction strength between two dissimilar surfaces in terms of the two surface contact angles was established (22).
To address these experimental systems, we investigate hydration-induced interactions by a combination of large-scale molecular dynamics (MD) simulations and theoretical arguments. We study the interaction between two atomistically resolved self-assembled monolayers (SAMs) with different wetting properties in the presence of explicit water. Our primary goal is to unravel the underlying principles of hydration-induced interactions in the complete parameter space encompassing all combinations from completely unpolar (hydrophobic) to extremely polar (hydrophilic) surfaces. In our simulation model, the surfaces contain polar groups and thus allow for intersurface and water–surface hydrogen bonding, yet they are overall charge neutral to avoid additional complications due to double-layer interactions. We also derive laws for the cavitation transition and for the dry adhesion transition as a function of the two surface contact angles. As our main result, we present an adhesion diagram in terms of the contact angles of the two surfaces in which we favorably compare the theoretical predictions for the cavitation and dry adhesion transitions with our explicit simulation results.
The cavitation transition signals the instability of the water layer below a critical surface separation. By a simple, yet exact derivation, we show that it depends on the sum of the two contact angles. It follows that cavitation can occur also on a hydrophilic surface if the other confining surface is sufficiently hydrophobic, which is a surprising result with a number of practical consequences. The cavitation transition is universal in the sense that it does not depend on any other system property besides the two surface contact angles. It is important to keep in mind that the cavitation kinetics are characterized by a high nucleation barrier; consequently the water layer might experimentally remain metastable for extended times even for surface separations much smaller than the predicted cavitation threshold (27, 28). Once cavitation has occurred, the two surfaces are pushed together by the ambient pressure, by direct surface–surface interactions, and for curved surfaces by attractive force components that arise from bubble deformation energetics, which have been amply discussed before (29). We note that we use a slightly modified terminology that is adjusted to the present general discussion involving two different surfaces: We do not refer to the attraction induced by cavitation as hydrophobic attraction, as is commonly done in the literature, reflecting the fact that this type of attraction also occurs between a pair of hydrophobic and hydrophilic surfaces if the sum of the contact angles is larger than .
The dry adhesion transition denotes the threshold between the situation where hydration repulsion prevents direct surface–surface contact and the situation where direct surface–surface interactions induce dry adhesion. This transition occurs at contact angles smaller than the cavitation transition, i.e., in a region of surface parameters where the water film between the surfaces is stable at large separations. In other words, we predict a regime of dry adhesion for intermediate surface contact angles, which is not caused or accompanied by cavitation. The extent of the dry adhesion regime depends on the magnitude of direct interactions between the surfaces and thus cannot be predicted based on single surface properties (i.e., the contact angles) alone. Using a perturbative expansion scheme, we derive an asymptotic expression for the transition between dry adhesion and hydration repulsion in terms of the nonpolar and polar surface–surface interaction strengths, which agrees very well with the explicit simulation results for not too asymmetric surfaces.
Our atomistic model for the interacting surfaces consists of two layers, each of 100 anchored alkane chains with terminal hydroxyl (−OH) head groups separated by a water layer and placed in a periodic box; see Fig. 1A for a simulation snapshot. The surface polarity is controlled by scaling the hydroxyl partial charges by parameters and in the range [0, 1], respectively. The values correspond to the completely polar and to the completely unpolar cases. We span the complete parameter space by explicitly simulating a total of 66 different polarity combinations, from which a global adhesion diagram is then constructed by interpolation. The chains are arranged on a hexagonal lattice with an area per chain of nm2, stabilized by weak harmonic restraining potentials. As a result, the surfaces are rather soft, meaning that water-layering effects are weak and the water density profiles exhibit only small structural oscillations, as shown in Fig. 1B. As it becomes crucial for our analysis, using previously established simulation technologies, the water chemical potential is kept fixed at the bulk value with a precision of (14) and surface contact angles are obtained with a precision of (19). This allows us to obtain the normal interaction surface pressure in the experimentally relevant ensemble of a fixed and prescribed chemical potential. For further simulation details see SI Text.
Fig. 1.

(A) Snapshot of the periodic simulation system. Two parallel surfaces consisting of hydroxyl-terminated alkane chains with different polarity parameters and interact across a water layer at fixed chemical potential. (B) Density profiles of water and head-group oxygens for the asymmetric scenario and .
Water Adsorption on a Single Surface
We first focus on a single surface. In practice, we simulate two surfaces at a large enough surface–surface distance of nm so that they do not interfere. This is an important preliminary step, because we will later find stable water wetting films in the asymmetric case of a hydrophilic surface interacting with a hydrophobic surface (30, 31). The wetting coefficient measures the surface affinity for water and is defined as
| [1] |
where , , and γ correspond to the surface–vapor, surface–water, and water–vapor interfacial free energies. It is related to the surface contact angle θ via Young’s equation and in our simulations determined via a modified thermodynamic integration method (19), as explained in detail in SI Text. Fig. 2 shows (black solid circles) at fixed excess water chemical potential kJ/mol, corresponding to bulk water at K and pressure bar (32). The wetting coefficient grows with the polarity parameter α. In the completely unpolar case, for , we find , corresponding to a contact angle of . The threshold between hydrophobic, , and hydrophilic, , surface behavior is crossed for . At we observe a wetting transition; i.e., for the surface is partially wet and characterized by a nonzero finite contact angle, whereas for the surface is completely wetted by a macroscopic water film and (equivalent to ). We also show the vacuum wetting coefficient in the absence of water adsorption, (Fig. 2, red open circles), which is determined from the surface–vacuum interfacial energy and is strictly larger than the true wetting coefficient . The reduction of the wetting coefficient from to is caused by the formation of a water adsorption film. The film areal number density in Fig. 2, Inset (blue squares) grows toward the wetting transition at (31, 33). Interestingly, the water film reaches a mean thickness of about 0.1 nm (converted from an areal density of nm−2 assuming bulk water density in the film), corresponding roughly to a single layer of water molecules, only very close to the wetting transition at a contact angle of roughly (see SI Text for snapshots of water films). Although water adsorption is thus weak as judged by the adsorbed amount, it sensitively modifies the equilibrium contact angle and therefore has to be properly taken into account. This follows from the pronounced difference between the vacuum wetting coefficient (Fig. 2, red line) and the equilibrium wetting coefficient (Fig. 2, black line), which accounts for the wetting film formation.
Fig. 2.

Single surface results. Wetting coefficient is shown as a function of the surface polarity parameter α (black solid circles); the corresponding contact angle θ is shown on the right axis. The wetting transition, defined by , occurs at . Red open circles denote the vacuum wetting coefficient obtained in the absence of a water film at the surface–vapor interface. Inset shows the areal water density of the adsorbed water film, . Lines are guides to the eye.
Interactions Between Two Surfaces: Simulation Results
Using the thermodynamic extrapolation method (19), we determine the normal interaction pressure between two surfaces in the presence of water at a fixed chemical potential corresponding to bulk water. Using this method, as we change the distance between the plates, the number of water molecules is always adjusted to satisfy the hydration equilibrium. By integrating the pressure–distance curves, we obtain the hydrated free energy as a function of distance D. We define D as the mean distance between the head-group oxygen atoms on the two opposing surfaces. In Fig. 3 we show in the hydrated state (blue lines) for three exemplary polarity combinations that illustrate the regimes of (Fig. 3A) hydration repulsion, (Fig. 3B) dry adhesion without cavitation, and (Fig. 3C) cavitation-induced attraction (corresponding pressure curves are presented in SI Text). In all three examples the first surface is completely unpolar () and characterized by a contact angle , corresponding to a very hydrophobic surface. Note that we define , so all free energies are expressed with respect to the reference state corresponding to hydrated surfaces at large separations of about nm.
Fig. 3.
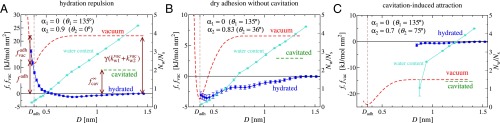
Simulation results for the surface free energy in the hydrated state, (dark blue lines), and in the vacuum state, (red dashed lines), for three surface polarity combinations that illustrate the scenarios of (A) hydration repulsion, (B) dry adhesion without cavitation, and (C) cavitation-induced attraction. The number of water molecules per surface group is shown in turquoise (right scale). The green horizontal dashed lines denote the cavitation free energy at infinite separation , which includes the effects of formation of water-wetting films on the surfaces.
In Fig. 3A the second surface is characterized by a rather high polarity factor of , right at the wetting transition, corresponding to a contact angle of (compare Fig. 2). The hydrated free energy exhibits a very weak attractive minimum at a separation around nm; for smaller separations we observe strong hydration repulsion. The green horizontal dashed line in Fig. 3A indicates the free energy of the cavitated state at separations where the surfaces do not interact with each other (i.e., nm), , which includes the effect of the formation of a thin water film on the polar surface. One sees that lies above the curve, reflecting that for this surface polarity combination, the hydrated state is stable against cavitation. This is a quite surprising result as it shows that even a very hydrophobic surface with a contact angle of is fully hydrated if the second surface is very polar. Below we demonstrate that this simulation finding is in full accordance with our theoretical analysis of the cavitation transition between asymmetric surfaces. For comparison, we also compute the free energy for two surfaces interacting in the absence of water, i.e., when the water slab is replaced by vacuum (Fig. 3A, red dashed line). This curve even lies above the cavitated state free energy (Fig. 3A, green horizontal line), showing that water film formation on the polar surface lowers the free energy significantly. At very small separations, when the water content (shown by the turquoise line in Fig. 3A) tends to zero, the and curves continuously merge. In SI Text we demonstrate that the free energy minimum of the hydrated state at nm, which corresponds to wet adhesion, is caused by a combination of vdW and more complex water-mediated interactions between the surfaces. Because of the strong hydration repulsion at smaller separation, we term this scenario the hydration repulsion regime.
At a slightly smaller polarity of the second surface, , leading to a contact angle of , while still , we see in Fig. 3B that for surface separations larger than 1 nm and are still above the hydrated free energy , meaning that the hydrated state is stable against cavitation at large D. However, the water layer becomes unstable with respect to dry adhesion at surface contact. In other words, for this contact angle combination the absolute free energy minimum is furnished by the vacuum state at the adhesive separation . The surfaces adhere stably to each other in the absence of water because of direct surface–surface interactions. This occurs without a cavitation instability at large separations; we name this scenario the dry adhesion regime.
At even smaller polarity of the second surface in Fig. 3C, corresponding to a contact angle of , the cavitated state (green dashed line) is preferred over the hydrated state (blue line) already at large surface separations. In equilibrium, the surfaces are therefore predicted to experience long-range cavitation-induced attraction. Note that in our simulations the hydrated state stays metastable down to small surface separations of about nm. For smaller separations we cannot generate stable water films because of pronounced density fluctuations leading to spontaneous cavitation effects [similar to experimental findings (28)].
In the following, we derive theoretical laws for the transitions between the regimes of cavitation-induced attraction, dry adhesion without cavitation, and hydration repulsion and thereby place the exemplary simulation results shown in Fig. 3 in a global state diagram.
Cavitation Transition Between Dissimilar Surfaces.
The free energy of the cavitated state with respect to the hydrated state is and consists of the interface free energy differences and the work needed to expel the water slab into the reservoir at bulk pressure . The pressure contribution can for the nanometer-scale separations D considered in this paper be neglected (corrections due to finite pressure and finite surface areas are discussed in SI Text). Using the definitions of the wetting coefficients and , the cavitation condition can be rewritten as or, equivalently (SI Text),
| [2] |
In the symmetric case of equal contact angles we recover the standard cavitation threshold of . For the general asymmetric case the cavitation law in Eq. 2 predicts that cavitation can occur even on a hydrophilic surface if the other surface is sufficiently hydrophobic. On the other hand, cavitation on a very hydrophobic surface is prevented if the other surface is sufficiently hydrophilic, in full accord with our simulation results shown in Fig. 3A. Note that Eq. 2 has previously been discussed in connection with experimental results (24).
Dry Adhesion Transition Between Dissimilar Surfaces
We now derive the asymptotic law describing the transition between the hydration repulsion and the dry adhesion regimes. In the former regime the adhesive free energy at contact is positive and therefore the equilibrium state involves a finite water slab thickness, as shown in Fig. 3A. In the dry adhesion regime, shown in Fig. 3B, the adhesive energy is negative whereas the water layer is stable against cavitation at larger separations. We define the dry adhesion transition by the condition . This definition neglects the presence of a wet adhesion state at finite water slab thickness, which leads only to negligible effects in our final adhesion phase diagram, but allows the derivation of a closed-form prediction for the adhesion transition. As graphically demonstrated in Fig. 3A by the vertical brown arrows, the adhesion free energy can be conveniently split into the vacuum free energy at large separations and the vacuum adhesion work,
| [3] |
We furthermore decompose the vacuum adhesion work as into the Lennard-Jones (LJ) component and the polar component . The term represents the vdW interactions in the system and is in the simulations generated by LJ interactions between the SAM atoms. The term is due to surface partial charges and reflects hydrogen bonding between surface groups; it arises only when both surfaces are polar. As shown in Fig. 4 for the symmetric case, , the vacuum adhesion energy scales perfectly linearly with the vacuum wetting coefficient ; we can thus write
| [4] |
Here, kJ⋅mol−1⋅nm−2, kJ⋅mol−1⋅nm−2, and are determined by a linear fit and the condition that for vanishing polarity parameter . In fact, the vacuum adhesion work between two identical surfaces is via this empirical relation shown to be linearly proportional to the surface water binding ability: As quantified by the coefficient c, the stronger a surface binds water, expressed via the vacuum wetting coefficient , the stronger it binds to a second surface of the same kind. For an asymmetric pair of surfaces, we expect a geometric combination rule for the polar contribution according to
| [5] |
because the dipolar interaction between two surfaces in vacuum is proportional to the product of the partial charges on the two surfaces. This combination rule was earlier established based on experimental data (22) and is validated in SI Text, using our simulation results. Combining Eqs. 3–5, we obtain the following conditional equation for the adhesion transition, determined by ,
| [6] |
For small wetting coefficients and we can expand the square root and finally obtain for the adhesion transition (see SI Text for details)
| [7] |
Here, the adhesive contact angle depends on the previously determined surface interaction parameters as
| [8] |
As would be expected, the larger the LJ and the polar interaction energies and are, the smaller the is, whereas a particularly decisive role is played by the coefficient c. In general, the vacuum adhesion work is positive; according to Eq. 4 this means that finite work is required to separate two surfaces characterized by or . In that case, we see from Eq. 8 that or , because . By comparison with Eq. 2 we thus conclude that the regime of dry adhesion without cavitation exists within a finite range of surface contact angles. For the model system studied in our case we find , but it transpires from our analysis that can be much smaller and that the hydration repulsion regime can completely disappear.
Fig. 4.

Adhesion free energy in vacuum as a function of the vacuum wetting coefficient for the symmetric scenario, .
Global Adhesion State Diagram
We present the resulting adhesion diagram in Fig. 5A in terms of the surface polarity parameters and and in Fig. 5B in terms of the contact angles and . The diagram is based on explicit simulations of 66 different surface polarity combinations and separates into three regimes, corresponding to hydration repulsion (for large polarity parameters or small contact angles), cavitation-induced attraction (for small polarity parameters or large contact angles), and within a thin strip between the latter two regimes dry adhesion without cavitation.
Fig. 5.

Adhesion diagram for two surfaces represented in terms of (A) the two surface polarity parameters and and (B) the two surface contact angles and , featuring the regimes of hydration repulsion (white), dry adhesion without cavitation (blue), and cavitation-induced attraction (orange). The asymptotic law for the adhesion transition, Eq. 7 (blue dashed line), agrees well with the simulation results (blue solid line) for not too asymmetric surfaces. The cavitation transition that separates the dry adhesion and the cavitation-induced attraction regimes is exactly described by the cavitation law, Eq. 2 (red solid line). The diamonds indicate the three scenarios considered in Fig. 3.
Experimentally most relevant is the diagram in terms of the two contact angles in Fig. 5B. Owing to the fact that both cavitation and adhesion transitions depend on the sum (Eqs. 2 and 7), the adhesion diagram has a simple but crucial topological structure: For any path going from the hydration repulsion regime to the cavitation regime, one crosses the dry adhesion regime without cavitation. The width of this intermediate regime depends on the adhesive contact angle , which in the present simulation model using hydroxyl surface groups is given by . It has been shown to vary between and for different surface structures in our previous work concerned with symmetric surfaces (19). Clearly, the smaller the is, the larger the dry adhesion regime. Whereas the blue solid line in Fig. 5B shows the dry adhesion transition directly determined from the simulations, the asymptotic law (Eq. 7) is shown by a blue dashed line and indeed seen to be valid except for very asymmetric surface combinations. The cavitation law, described by Eq. 2, is shown by a red line in Fig. 5B and does not rely on any approximation; consequently, our simulation data are in full agreement. Probably the most surprising feature of the adhesion state diagram in Fig. 5B is that the dry adhesion regime extends into the off-diagonal corners, corresponding to asymmetric hydrophilic–hydrophobic surface combinations. We see that an extended range of contact angle combinations exists, where a hydrophilic surface with adheres to a second surface in a dry state, in particular if that second surface is sufficiently hydrophobic. Conversely, a hydrophobic surface with can be prevented from exhibiting cavitation and even from adhering to a second surface in a dry fashion if the second surface is sufficiently hydrophilic. Our adhesion diagram thus presents definite rules for controlling surface adhesion properties in terms of the surface contact angles (in other words, in terms of the interfacial free energies).
Discussion
Using an atomistic model for the interaction between two hydroxylated surfaces with different polarities in the presence of explicit water, in conjunction with simulation methods that allow us to account for the constant water chemical potential and to determine accurate surface contact angles, we establish a general adhesion diagram with three regimes: hydration repulsion for very polar surfaces; cavitation for unpolar surfaces; and, in between, dry adhesion without cavitation. Our derived laws for the cavitation transition and the dry adhesion transition both depend on the sum of the contact angles of the two surfaces, in good agreement with explicit simulation results for not too asymmetric surfaces. This means that the regime of dry adhesion without cavitation in the adhesion state diagram spanned by the two surface contact angles forms a strip between the hydration repulsion and cavitation regimes, in good agreement with a host of experimental findings for different systems (2, 3, 22–26). Our theoretical analysis shows that this dry adhesion regime necessarily exists and that it becomes more pronounced the stronger the direct surface–surface interactions are. One important conclusion is that for a wide range of polar surfaces it should therefore be possible to design a counter surface that will bind to that surface in a very tight dry-adhesion complex if the surface contact angles fall into the dry adhesion regime defined by the laws given in Eqs. 2 and 7.
Note that our simulations in the hydration repulsion regime yield a wet adhesion state at a finite water slab thickness. Clearly, explicit water simulations are not well suited to study details of this wet adhesion state, because the vdW surface forces are rather small and in simulations difficult to estimate reliably. As an additional complication, finite LJ cutoffs are used in MD simulation force fields and give rise to cutoff artifacts at large surface separations (see SI Text for more details). Obviously, simulations will have to be combined with continuum modeling to make progress in understanding wet adhesion properties (34).
The adhesion contact angle for our explicit simulation model, based on hydroxyl surface groups whose partial charges are continuously varied, is given by , leading to a rather narrow strip of dry adhesion in the diagram in Fig. 5B. One particularly important question is to understand how to control the adhesion angle , which is via Eq. 8 linked to the sum of the nonpolar (LJ) and polar surface–surface interactions. In SI Text we demonstrate that the adhesion transition is on the microscopic level determined by the balance of surface–surface and surface–water hydrogen bonds. This suggests that cleverly designed surfaces with donor–acceptor hydrogen-bonding pairs presumably decrease considerably. A further question to be tackled in the future is how the presence of surface charges modifies the solvation interaction and in particular the short-range adhesion behavior.
Supplementary Material
Acknowledgments
We acknowledge funding from the Deutsche Forschungsgemeinschaft via Grant SFB 765.
Footnotes
The authors declare no conflict of interest.
This article is a PNAS Direct Submission. S.G. is a guest editor invited by the Editorial Board.
This article contains supporting information online at www.pnas.org/lookup/suppl/doi:10.1073/pnas.1504919112/-/DCSupplemental.
References
- 1.Israelachvili J. Intermolecular and Surface Forces. Academic; London: 1992. [Google Scholar]
- 2.Christenson HK, Claesson PM. Direct measurements of the force between hydrophobic surfaces in water. Adv Coll Int Sci. 2001;91(3):391–436. [Google Scholar]
- 3.Meyer EE, Rosenberg KJ, Israelachvili J. Recent progress in understanding hydrophobic interactions. Proc Natl Acad Sci USA. 2006;103(43):15739–15746. doi: 10.1073/pnas.0606422103. [DOI] [PMC free article] [PubMed] [Google Scholar]
- 4.Parsegian VA, Zemb T. Hydration forces: Observations, explanations, expectations, questions. Curr Opin Colloid Interface Sci. 2011;16:618–624. [Google Scholar]
- 5.Christenson HK, Claesson PM. Cavitation and the interaction between macroscopic hydrophobic surfaces. Science. 1988;239(4838):390–392. doi: 10.1126/science.239.4838.390. [DOI] [PubMed] [Google Scholar]
- 6.Lum K, Chandler D, Weeks JD. Hydrophobicity at small and large length scales. J Phys Chem B. 1999;103(22):4570–4577. [Google Scholar]
- 7.Huang X, Margulis CJ, Berne BJ. Dewetting-induced collapse of hydrophobic particles. Proc Natl Acad Sci USA. 2003;100(21):11953–11958. doi: 10.1073/pnas.1934837100. [DOI] [PMC free article] [PubMed] [Google Scholar]
- 8.Parsegian VA, Fuller N, Rand RP. Measured work of deformation and repulsion of lecithin bilayers. Proc Natl Acad Sci USA. 1979;76(6):2750–2754. doi: 10.1073/pnas.76.6.2750. [DOI] [PMC free article] [PubMed] [Google Scholar]
- 9.Rand R, Parsegian VA. Hydration forces between phospholipid bilayers. Biochim Biophys Acta. 1989;988(3):351–376. [Google Scholar]
- 10.Israelachvili JN, Pashley RM. Molecular layering of water at surfaces and origin of repulsive hydration forces. Nature. 1983;306:249–250. [Google Scholar]
- 11.Marra J, Israelachvili J. Direct measurements of forces between phosphatidylcholine and phosphatidylethanolamine bilayers in aqueous electrolyte solutions. Biochemistry. 1985;24(17):4608–4618. doi: 10.1021/bi00338a020. [DOI] [PubMed] [Google Scholar]
- 12.Pertsin A, Platonov D, Grunze M. Origin of short-range repulsion between hydrated phospholipid bilayers: A computer simulation study. Langmuir. 2007;23(3):1388–1393. doi: 10.1021/la0622929. [DOI] [PubMed] [Google Scholar]
- 13.Eun C, Berkowitz ML. Origin of the hydration force: Water-mediated interaction between two hydrophilic plates. J Phys Chem B. 2009;113(40):13222–13228. doi: 10.1021/jp901747s. [DOI] [PubMed] [Google Scholar]
- 14.Schneck E, Sedlmeier F, Netz RR. Hydration repulsion between biomembranes results from an interplay of dehydration and depolarization. Proc Natl Acad Sci USA. 2012;109(36):14405–14409. doi: 10.1073/pnas.1205811109. [DOI] [PMC free article] [PubMed] [Google Scholar]
- 15.Berg JM, Eriksson LGT, Claesson PM, Borve KGN. Three-component Langmuir-Blodgett films with a controllable degree of polarity. Langmuir. 1994;10(4):1225–1234. [Google Scholar]
- 16.Yoon RH, Ravishankar S. Long-range hydrophobic forces between mica surfaces in dodecylammonium chloride solutions in the presence of dodecanol. J Coll Int Sci. 1996;179(2):391–402. [Google Scholar]
- 17.Ishida N, Kinoshita N, Miyahara M, Higashitani K. Effects of hydrophobizing methods of surfaces on the interaction in aqueous solutions. J Colloid Interface Sci. 1999;216(2):387–393. doi: 10.1006/jcis.1999.6329. [DOI] [PubMed] [Google Scholar]
- 18.Considine RF, Drummond CJ. Long-range force of attraction between solvophobic surfaces in water and organic liquids containing dissolved air. Langmuir. 2000;16(2):631–635. [Google Scholar]
- 19.Kanduč M, Schneck E, Netz RR. Attraction between hydrated hydrophilic surfaces. Chem Phys Lett. 2014;610:375–380. [Google Scholar]
- 20.Nel AE, et al. Understanding biophysicochemical interactions at the nano-bio interface. Nat Mater. 2009;8(7):543–557. doi: 10.1038/nmat2442. [DOI] [PubMed] [Google Scholar]
- 21.Jones S, Thornton JM. Principles of protein-protein interactions. Proc Natl Acad Sci USA. 1996;93(1):13–20. doi: 10.1073/pnas.93.1.13. [DOI] [PMC free article] [PubMed] [Google Scholar]
- 22.Yoon RH, Flinn DH, Rabinovich YI. Hydrophobic interactions between dissimilar surfaces. J Colloid Interface Sci. 1997;185(2):363–370. doi: 10.1006/jcis.1996.4583. [DOI] [PubMed] [Google Scholar]
- 23.Freitas AM, Sharma MM. Detachment of particles from surfaces: An {AFM} study. J Colloid Interface Sci. 2001;233(1):73–82. doi: 10.1006/jcis.2000.7218. [DOI] [PubMed] [Google Scholar]
- 24.Lee JH, Meredith JC. Non-DLVO silica interaction forces in NMP-water mixtures. II. An asymmetric system. Langmuir. 2011;27(16):10000–10006. doi: 10.1021/la202176u. [DOI] [PubMed] [Google Scholar]
- 25.Faghihnejad A, Zeng H. Interaction mechanism between hydrophobic and hydrophilic surfaces: Using polystyrene and mica as a model system. Langmuir. 2013;29(40):12443–12451. doi: 10.1021/la402244h. [DOI] [PubMed] [Google Scholar]
- 26.Troncoso P, et al. Nanoscale adhesive forces between silica surfaces in aqueous solutions. J Colloid Interface Sci. 2014;424(0):56–61. doi: 10.1016/j.jcis.2014.03.020. [DOI] [PubMed] [Google Scholar]
- 27.Leung K, Luzar A, Bratko D. Dynamics of capillary drying in water. Phys Rev Lett. 2003;90(6):065502. doi: 10.1103/PhysRevLett.90.065502. [DOI] [PubMed] [Google Scholar]
- 28.Mastropietro DJ, Ducker WA. Forces between hydrophobic solids in concentrated aqueous salt solution. Phys Rev Lett. 2012;108(10):106101. doi: 10.1103/PhysRevLett.108.106101. [DOI] [PubMed] [Google Scholar]
- 29.Attard P. Nanobubbles and the hydrophobic attraction. Adv Colloid Interface Sci. 2003;104(13):75–91. doi: 10.1016/s0001-8686(03)00037-x. [DOI] [PubMed] [Google Scholar]
- 30.Pertsin A, Grunze M. Computer simulation of adhesion between hydrophilic and hydrophobic self-assembled monolayers in water. J Chem Phys. 2012;137(5):054701. doi: 10.1063/1.4739745. [DOI] [PubMed] [Google Scholar]
- 31.Grzelak EM, Errington JR. Computation of interfacial properties via grand canonical transition matrix Monte Carlo simulation. J Chem Phys. 2008;128(1):014710. doi: 10.1063/1.2812285. [DOI] [PubMed] [Google Scholar]
- 32.Sedlmeier F, Netz RR. Solvation thermodynamics and heat capacity of polar and charged solutes in water. J Chem Phys. 2013;138(11):115101. doi: 10.1063/1.4794153. [DOI] [PubMed] [Google Scholar]
- 33.Bonn D, Eggers J, Indekeu J, Meunier J, Rolley E. Wetting and spreading. Rev Mod Phys. 2009;81:739–805. [Google Scholar]
- 34.French RH, et al. Long range interactions in nanoscale science. Rev Mod Phys. 2010;82:1887–1944. [Google Scholar]
Associated Data
This section collects any data citations, data availability statements, or supplementary materials included in this article.