Significance
Raman spectroscopy is an important tool in understanding chemical components of various materials. However, the excessive weight and energy consumption of a conventional CCD-based spectrometer forbids its applications in space-based instruments, including unmanned aircraft vehicles (UAVs) and Mars/Moon rovers. In this article, we present a lightweight and energy-efficient hyperspectral Raman measurement system. This technique allows UAVs and space vehicles to carry Raman spectrometers without consuming excessive energy.
Keywords: Raman spectroscopy, lightweight spectrometer, time-correlated single-photon counting, remote sensing, environmental sensing
Abstract
Raman spectroscopy is an important tool in understanding chemical components of various materials. However, the excessive weight and energy consumption of a conventional CCD-based Raman spectrometer forbids its applications under extreme conditions, including unmanned aircraft vehicles (UAVs) and Mars/Moon rovers. In this article, we present a highly sensitive, shot-noise–limited, and ruggedized Raman signal acquisition using a time-correlated photon-counting system. Compared with conventional Raman spectrometers, over 95% weight, 65% energy consumption, and 70% cost could be removed through this design. This technique allows space- and UAV-based Raman spectrometers to robustly perform hyperspectral Raman acquisitions without excessive energy consumption.
Raman spectroscopy is a valuable tool for probing chemical composition. It is widely applied in chemical analysis of molecular species and structures of chemical bonds (1, 2), and is therefore widely extended to the fields of biomedical imaging (e.g., refs. 3–5), material science (e.g., ref. 6), and remote sensing (e.g., ref. 7). Comparing with other molecular-specific imaging techniques, Raman spectroscopy provides a label-free contrast mechanism, which is intrinsically induced by the molecules contained in the sample. Relying on internal properties of molecules, investigators can avoid complicated sample preparation processes and molecular-specific labeling, etc. In many imaging/sensing applications, Raman spectroscopy often provides superior molecular specificity, imaging speed, and spectral resolution, and is usually considered as an emerging imaging technique (8, 9). However, despite decades of intensive study, Raman spectroscopy is still not widely applicable in space-based detection systems including unmanned aircraft vehicles (UAVs) and Mars/Moon rovers. This is mainly due to two hurdles: the unacceptable heavy weight of conventional spectrometers, and the excessive energy consumption by the entire system, especially the CCD camera.
In typical laboratory-based Raman spectroscope setups, a beam of light is focused onto the sample. The scattered photons are then collected by a condenser lens and sent into a spectrometer. A diffractive grating is usually used to induce a spatial dispersion of the Raman peaks into different wavelengths. A CCD camera is used as the detector. In this sense, a correspondence between the CCD pixel and Raman shift can be established, and the Raman peaks are recognized and recorded.
However, when extending this approach to field circumstances (e.g., space-based vehicles or UAVs), several key limitations emerge. First, due to the tiny angular dispersion provided by diffractive gratings, a long optical propagation length is required to create sufficient spatial dispersion. This is usually not allowed in space-based vehicles. Moreover, this long propagation length, together with any possible moving parts contained in the grating-based spectrometers, is unable to tolerate excessive vibrations during the launching/landing process of a space-based vehicle. Furthermore, the excessive energy consumption for the CCD cameras, especially for the cooling process, is usually not affordable by UAVs or space-based vehicles/rovers. Finally, the weight of the spectrometer is also a problem (10–12).
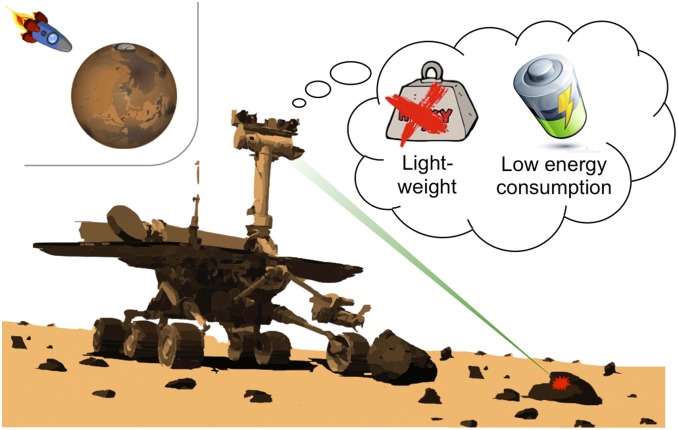
To overcome these difficulties, investigators invented and used several different approaches. For example, to remove the diffraction grating, Lewis et al. (13) and several other investigators (14, 15) adopted acoustooptic tunable filters (AOTFs). In this solution, an acoustic-optical (AO) device was applied as a tunable-wavelength filter/switch. By tuning the rf driving frequency, the diffraction window of the AO devices could be controlled according to the phase-matching condition (16, 17). Because AOTF only allows one wavelength to transmit at a time, single-point detectors, including photomultiplier tubes (PMTs) and avalanche photodiodes (APDs), could replace the CCD detectors. In this way, the total weight and energy consumption of the system could be substantially reduced. However, the angular dispersion provided by AOTFs is usually very tiny. To acquire a sufficient spatial dispersion, its output still needs a relatively long propagation length in free space. When working under environments with excessive vibrations, the mechanical stability of this solution may be problematic. The all-fiber optical spectrometers reported by Redding et al. (18) are another viable solution to remove the diffractive grating. In this approach, a multimode fiber was used to produce wavelength-dependent sparkle patterns. By recognizing the output pattern of the multimode fiber, the wavelength can be acquired. Additionally, surface-enhanced Raman scattering is also a possible solution in fabricating lightweight Raman spectroscopes (e.g., refs. 19, 20). The enhanced Raman signal strength enables noncooled CCD camera/photodiode detectors to be implemented as signal receivers. However, this solution may not be suitable for remote-sensing applications, as it requires investigators to directly manipulate the sample and decorate it with nanoparticles. Besides the aforementioned approaches, random Raman lasing is an emerging technique which may be suitable for remote chemical identification (7), as it would guarantee the signal brightness and detection efficiency (see Fig. 1).
Fig. 1.
Weight and energy consumption are two major factors limiting broad applications of sensitive spectroscopic techniques for UAVs and Mars/Moon rovers.
In this article, we report yet another approach for building lightweight Raman spectroscopes. We address the two main hurdles––a relatively heavy spectrometer and an excessive energy consumption––by reinventing the way that the Raman signal can be collected and analyzed. Short light pulses propagate in dispersive mediums in a fashion that is equivalent to how a light beam diffracts (21–24). In this study, we direct the collected Raman signal into a dispersive single-mode optical fiber. In this way, the Raman peaks at different wavelengths can be separated in the time domain (25). By using a time-gated APD or a PMT in combination with time-correlated detection, we are able to achieve highly sensitive signal detection. We note that similar approaches have been introduced elsewhere in the field of telecommunication (e.g., refs. 23, 26–28). For example, coherent time-stretch transformation has been applied in capturing high-speed rf signals in real time. By slowing down the analog electrical signals before digitization, coherent time-stretch transformation is capable of extending the bandwidth and resolution of analog to digital converters (27–29). This concept has also been implemented in fabricating temporal lenses and prisms in the field of all-optical signal processing (23). These temporal optical components substantially extended the applicability of integrated optical waveguide components (26).
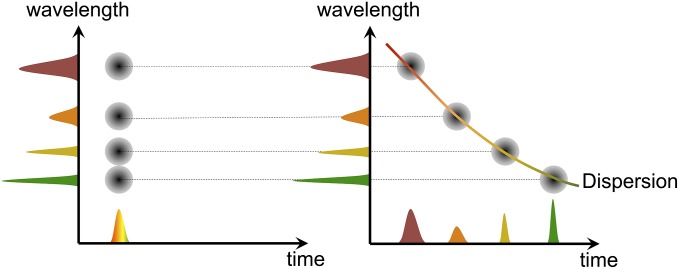
Fig. 2 illustrates the concept of time–frequency duality used in this study. Fig. 2 (Left) shows the wavelength–time distribution of the Raman signal before sending it into the dispersive medium, whereas Fig. 2 (Right) portrays the same relationship after propagating through a sufficiently long distance in the dispersive medium. In the case described on the left, the Raman peaks can be separated in the frequency domain, but are mixed in the time domain. After propagating in a sufficiently long dispersive medium, the peaks with different frequencies are temporally separated. The red line on the right illustrates a typical dispersion law.
Fig. 2.
Physics of time–frequency duality. (Left) Time–frequency distribution of the signal excited by a short laser pulse; projection on the y axis provides Raman spectrum. (Right) Distribution of the same signal after transmitting through the dispersive medium.
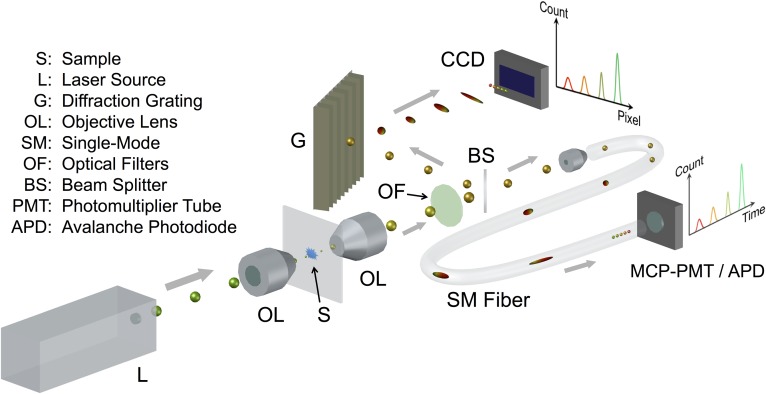
Fig. 3 schematically illustrates the experimental setup in this study. To practically implement the time-gated Raman detection, we used a time-correlated single-photon-counting (TCSPC) system (Becker & Hickl, model SPC-150) with a multichannel plate photomultiplier tube (MCP-PMT, Hamamatsu Corp., model R3809U-50) with a transit time spread (TTS) of 25 ps. An APD (Becker & Hickl, model APM-400, TTS = 40 ps) was also implemented in some experiments during this study. To create sufficient chromatic dispersion and avoid modal dispersion, we selected a 400-m-long single-mode fiber (Fibercore Inc., model SM600, ∼6 g in weight). The pump laser was focused on the sample by an objective lens (Edmund Inc., N.A. = 0.4). The transmitted radiation was collected by an identical objective lens and directed into the single-mode fiber by another focusing lens. To avoid any possible fiber-induced Raman/fluorescence background resulting by the excitation laser, we blocked the 532-nm pulses using two 532-nm notch filters (OD = 4, Edmund Inc.) and one long-pass filter (OD ≥ 6, cut-on wavelength: 537.3 nm, Edmund Inc.). The fluorescence backgrounds originated by Raman pulses, due to their long lifetime and low strength, will not affect our measurements. The output signal of the fiber was collimated and sent into both the MCP-PMT/APD and a conventional spectrometer (InSpectrum 300, Acton Inc.), respectively. In addition, a small portion of the pump laser was sent to trigger the TCSPC card. An appropriate delay line was applied in the detection. The detection lasted for 60 ns after the excitation pulse (532 nm). Thus, the nominal temporal interval for each channel (4,096 channels in total) was ∼15 ps, which defined the temporal resolution for this setup.
Fig. 3.
Basic experimental setup. Here a 532-nm picosecond laser, which was generated from a home-built 100-kHz Nd:YVO4 laser, was directed and focused to the sample. The transmitted light was collected and directed to a 400-m-long single-mode fiber (Fibercore Inc., model SM600). The output signal of the single-mode fiber was sent to the MCP-PMT or the APD. The time-resolved signal is measured by the TCSPC card.
Results
Chromatic Dispersion Is the Physical Origin Separating Photons in Different Wavelengths.
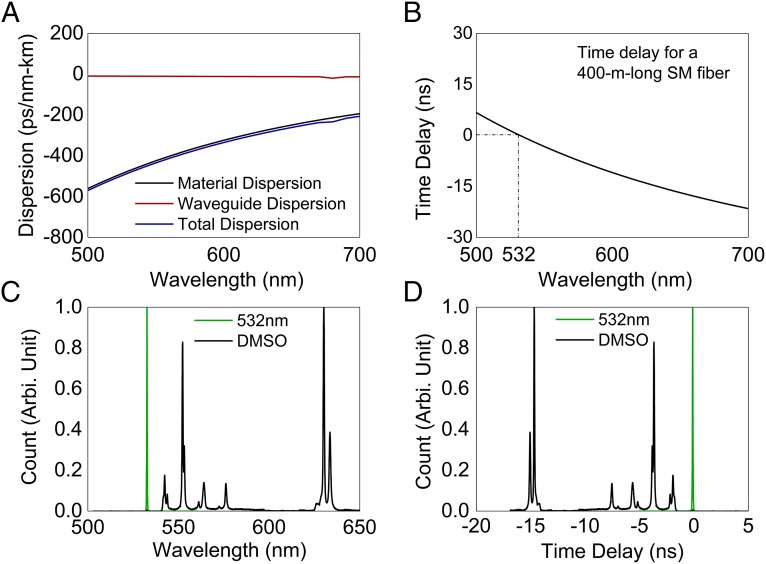
Fig. 4 shows the dispersion properties of the single-mode fiber used in our experimental setup. As is well known, dispersion is the phenomenon in which the phase or group velocity of a wave depends on its frequency (25). For single-mode fibers, only material and waveguide dispersions are significant. In our setup, the fiber core consists of a complex glass system containing GeO2 and SiO2. The total dispersion (including the material dispersion and waveguide dispersion) of the fiber was calibrated and provided by the manufacturer (Fibercore Inc.). For example, at 600- and 700-nm incident wavelengths, the total dispersions (DT) are −334.93 ps/(nm-km) and −206.52 ps/(nm-km), respectively. The complete total dispersion data are shown in Fig. 4A. Following the definition of the dispersion, the temporal separation between pulses could be written as
| [1] |
Here, L is the length of the single-mode fiber in units of km; λ0 and λ1 are the center wavelengths for the two pulses (λ0 < λ1) in units of nm.
Fig. 4.
Dispersion property of the SM600 single-mode fiber. (A) The material, waveguide, and total dispersions for SM600 fiber. (B) The relative temporal delay for pulses in different colors. Calculations followed Eq. 1. Here 532 nm was selected as a reference. (C) The Raman spectrum of DMSO. Here the excitation wavelength (532 nm) is labeled as a reference. (D) The simulated result for the Raman spectrum in time domain. The time delay property follows the data shown in B.
Fig. 4B shows the relative temporal delay as a function of wavelength. Here the fiber length is assumed to be 400 m, and the reference wavelength (λ0) is set as 532 nm. The negative value indicates the corresponding wavelength would arrive before the reference. The monotonic function enables a correspondence between temporal delay and the pulse wavelength. For example, for 532-nm excitation, emissions around 632 nm usually correspond to important Raman shifts around 3,000 cm−1. In our setup, the temporal separation between 532 and 632 nm is more than 13 ns, which is sufficient to be resolved by a commercial PMT or APD. Therefore, the 400-m-long single-mode fiber provides sufficient dispersion for typical Raman spectral lines.
Dispersive Materials Can Be Used in Spectroscopic Analysis.
Fig. 4C shows the Raman spectrum for pure dimethyl sulfoxide (DMSO) at room temperature under a 532-nm excitation. The excitation line was included in the figure as a reference. The data were collected by a conventional spectrometer (Acton Inc., InSpectrum 300, 1-s integration time, 50-μm entrance slit width). Fig. 4D shows a simulated result for our experimental setup. The time delay pattern follows the data in Fig. 4B, and the Raman spectrum is the same as in Fig. 4C. To show the effect of the pulse duration, the delayed data were convoluted with a 15-ps Gaussian function. The spectral resolution was not significantly lowered. Following this simulation, the ∼3,000-cm−1 Raman peaks (∼630 nm) arrive ∼15 ns earlier than the 532-nm pulse. This temporal separation is sufficient to be resolved by a time-correlated detector.
Raman Spectroscopy Can Be Resolved by a Time-Correlated Photon-Counting System.
Unlike the conventional Raman detection, in our current setup the Raman signal is significantly attenuated by the single-mode fiber. For SM600 (Fibercore Inc.), the attenuation could reach 10 dB/km in the wavelength range 500–700 nm. Theoretically, for a 400-m-long single-mode fiber, the output light intensity is ∼2.51 times lower than the input light (insertion loss was not considered). The single-molecule cross-section for a typical Raman line is estimated as ∼10−29 cm2. For a 1-W excitation power, there are ∼2.7 × 10¹³ photons contained in each pulse. Considering the attenuation of the single-mode fiber, the output Raman signal would be ∼300 photons per pulse. Here we assume the repetition rate of the laser is 100 kHz, the focusing spot is ∼2.5 µm2, and the number density of the sample is ∼8.5 × 1027 m−3. The theoretical signal strength is sufficient to be captured by a time-gated detector (i.e., MCP-PMT or APD). In this perfect case, the appropriate signal attenuation should be required to avoid pile-up errors.
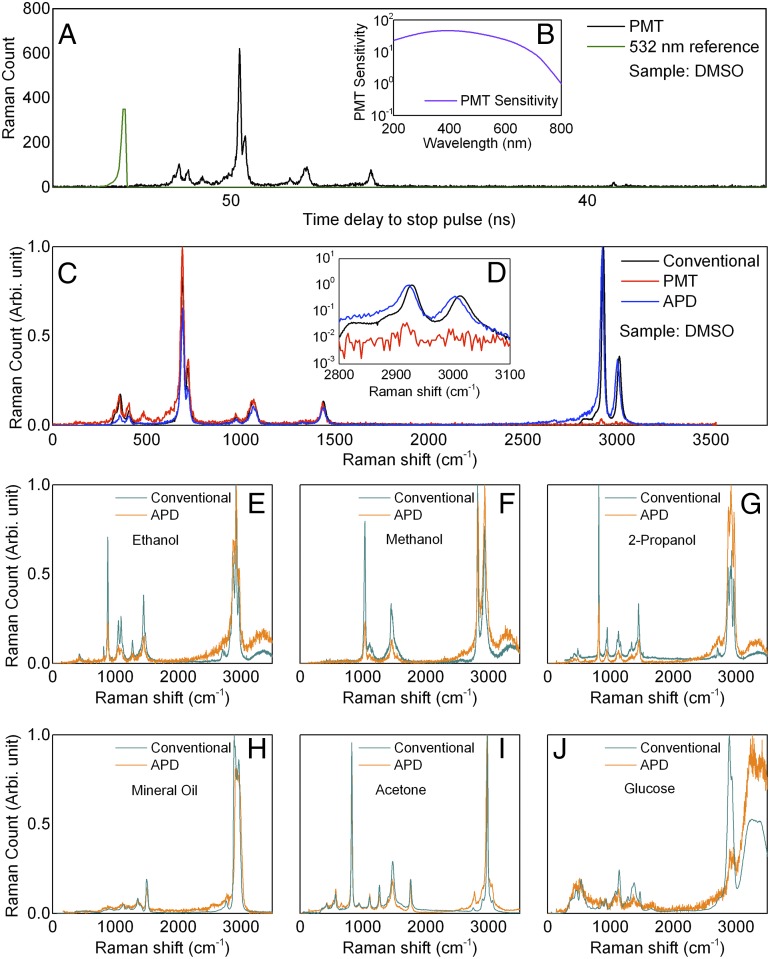
We used an MCP-PMT as the detector in the first experiments. Representative Raman spectra are presented in Fig. 5. Fig. 5A shows the raw data collected by the MCP-PMT. The residue signal of the 532-nm excitation is also included as a reference. The exposure time was 3,000 s. The maximum reading was ∼700 photons per channel (4,096 channels in total). Compared with the theoretical prediction, the collected signal was lowered by 8 orders of magnitude. Due to this substantial signal loss, pile-up error was not considered. Despite the longer exposure time, the overall energy consumption of our system will still be lower than the CCD-based system, as the CCD chip requires continuous cooling. The experimental data have been correlated by the MCP-PMT sensitivity function shown in Fig. 5B acquired from its factory specification. However, the Raman peaks at ∼35 ns (3,000 cm−1) are still not obvious in the experimental result.
Fig. 5.
Experimental data collected in this study. (A) The original data for DMSO collected by MCP-PMT. The 532-nm excitation pulse is also included as a reference. (B) The sensitivity of the MCP-PMT. (C) Comparison between the Raman spectra acquired by conventional spectrometer, MCP-PMT, and APD, respectively. The sample was DMSO. The sensitivity curve shown in (B) was applied. (D) The Raman spectra zoomed-in to 2,800–3,100 cm−1 in wavenumber. (E–G) Comparisons between the Raman spectra acquired by pure ethanol, pure methanol, and pure 2-propanol, respectively. (H–J) Additional comparisons between the Raman spectra acquired from pure mineral oil, pure acetone, and glucose solution, respectively; the spectra in E–J were calibrated by the ethanol data shown in E. The concentration of the glucose solution was ∼1 M during the time-gated measurements. When making conventional Raman spectroscopy measurements, we used saturated glucose solution.
Following the dispersion function, the DMSO’s Raman spectra collected by the time-correlated and conventional spectroscopes are shown in Fig. 5C. The integration time for the conventional spectroscope was 1 s. Its maximum reading was ∼5,000 counts per pixel (at ∼2,910 cm−1). The similarity between these two datasets is noted. However, the origin of the peak located at ∼500 cm−1 is unknown. An APD was also used in the experiment, and a representative DMSO Raman signal is included in Fig. 5C as well. The corresponding integration time was reduced to 360 s. The photon counting for the ∼3,000-cm−1 Raman peak was ∼2,500. That is, about 7 photons per channel were detected in 1 s, indicating that the APD detection was ∼10 times more efficient than MCP-PMT. For the APD result, the Raman peaks in the ∼3,000-cm−1 region did not perfectly match the conventional spectrometer’s result (Fig. 5D). This may be due to our inaccurate knowledge concerning the fiber’s dispersion function. Comparing with the MCP-PMT, the APD provides better signal strength in the 630-nm region (∼3,000 cm−1). Meanwhile, the signal acquisition time was significantly reduced.
Next, we performed some additional tests using the APD. The data shown in Fig. 5 E–J were performed under the same experimental condition (i.e., excitation power and fiber length). Here the integration time was extended to 1,800 s for better signal-to-noise ratio (SNR). Great similarities between the APD’s and conventional spectrometer’s results can be observed. However, the Raman signal was lowered at the 500–1,500-cm−1 region (530–580 nm). This may due to the sensitivity curve of the APD. Additional corrections and signal processing procedures will be required in future studies.
Compared with the conventional spectrometers, time-domain Raman detection provides an elegant and reliable method for detecting Raman spectra. The overall weight for this signal collection system can be a fraction of a traditional Raman spectroscope without substantially sacrificing the performance. In this experiment, the total weight of the detection system, including the TCSPC module, MCP-PMT/APD module, and the optical fiber, was less than 500 g. Compared with conventional Raman spectrometers (e.g., InSpectrum 300, Acton Inc.), over 95% weight was removed. Additionally, by eliminating the cooling needs of the detector, the energy consumption of the spectroscope was substantially reduced (<1,200 mW in our current system). The total cost of the system, including the laser source, the detector, and the associated electronics, could be less than US$10,000, or about 70% cheaper than a typical conventional Raman spectrometer with single-photon sensitivity. Unlike conventional spectrometers, which require light to travel in free space over a long distance, the chromatic dispersion in our design is originated by a compact fiber-based setup that can be securely attached to the detector and the rest of the instrument. This feature enables the system to become resistant to instantaneous mechanical shocks. Meanwhile, the spectral resolution performance in our system was not substantially lowered (∼3.5 cm−1 for the MCP-PMT, and ∼8 cm−1 for the APD). The spectral resolution can be further improved by using a faster detector and/or a higher dispersive optical fiber. A precisely calibrated system function plus a deconvolution operation would also enhance the spectral resolution numerically.
However, there are two major limiting factors for our system: the temporal resolution, and the sensitivity. Both the PMT and APD with a shorter TTS (i.e., temporal resolution) are commercially available and are expected to provide further simplification and better performance of the system. The sensitivity of the system is another limiting factor. In our experiments, the response curve for the PMT (as shown in Fig. 5B) falls down when the wavelength becomes longer than 600 nm, making detections insensitive. On the other hand, both silicon (Si) PMT and APD provide better sensitivity for wavelengths longer than 600 nm. In future studies, these detectors should be used when necessary.
The intensity of the Raman peaks was substantially reduced in this experiment. Although the signal collection efficiency is comparable with a conventional Raman spectrometer, the signal strength in our implemented system realization was about 100 times lower. This is the result of a poor transmission through the single-mode fiber. Coherent single-mode fiber bundles, to the contrary, provide better transmission while keeping the temporal resolution. Therefore, a considerable signal collection efficiency can be approached in future applications. The excitation laser power can be lowered accordingly.
Materials and Methods
For all of our experiments, we used a home-built picosecond Nd:YVO4 laser (21). The intracavity telescope optics ensures a long beam path for each of the laser pulses. The laser provides a repetition rate as low as 100 kHz–2 MHz, depending on the configuration setting. The energy contained in each pulse is more than 500 nJ. All of the energy in the fundamental wavelength (1,064.20 nm) is sent to generate the second-harmonic radiation (532.10 nm). Due to the low repetition rate, the temporal separation between two pulses could be ∼10 μs, which is much longer than the lifetime of a typical autofluorescence emission (1–10 ns). In this way, the accumulation effects can be avoided. The pulse duration is typically set at ∼7 ps, which avoids broadening typical Raman lines.
As a proof of principle, we used relatively simple samples, including pure methanol, ethanol, and dimethyl sulfoxide (DMSO), etc. The samples were filled into quartz cuvettes (Starna Cells, 23-Q-2, 2-mm path length), respectively. The thin cuvette enables us to insert them in between the two objectives.
In summary, we introduced an elegant method for detecting Raman signals, which completely removes the necessity of using a spectrometer. The detection system, being based on a single PMT/APD and electronics, can be potentially very inexpensive, portable, and applicable to a wide variety of optical measurements even under low illumination conditions. High sensitivity, detection flexibility, and mechanical stability can be ensured as well.
Calculation of the Spectral Resolution of the System
Similar to the slit width in a conventional spectrometer, the laser pulse duration is a limiting factor for the spectral resolution. For example, the laser pulse duration of ΔtL = 7 ps as in our setup, the linewidth, according to the uncertainty principle, would be Δλ ≥ 67.4 pm. Given that the total dispersion of the fiber is DT (λ = 532 nm) = −478.46 ps/(nm-km), after transmitted through a 400-m-long single-mode fiber, any perfect delta-function–shaped pulse will be broadened to a pulse with temporal width ΔtD = 13 ps. Assuming that both the laser pulse and the dispersion follow Gaussian shape, the output pulse would be the convolution of these two, resulting in the total pulse duration of
| [S1] |
Here c is the speed of light. Thus, independent of the input laser pulse duration, the output pulse duration is fundamentally limited by the laser wavelength λ, the fiber length L, and the corresponding dispersion property of the fiber. In our experiment, the minimal possible value for Δt was ∼15 ps.
In conventional spectrometers, the spectral resolution is theoretically limited by the pixel size of the CCD detector, and the entrance slit width. Similarly, in the time domain, the spectral resolution is fundamentally limited by the temporal resolution of the detector, as well as the output pulse duration shown in Eq. S1. The spectrum range corresponding to the Δt in Eq. S1 can be written as
| [S2] |
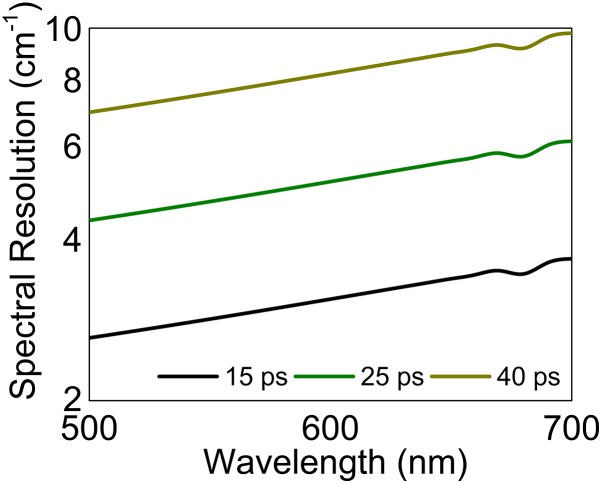
Here ω is the wave number in units of cm−1, ω = 107/λ. ΔT is a temporal resolution of the detector in units of ps. Using Eq. S1, we can derive the inequality, which implies the spectral resolution per pixel. In most cases, ΔT is greater than or equal to Δt. Fig. S1 shows the spectral resolution as a function of wavelength. Here we assume the detector’s TTS is 15, 25, and 40 ps, respectively. The calculated spectral resolution ranges from 3∼9 cm−1, depending on the TTS. In our setup, the TTS was 25 ps for the MCP-PMT detector and 40 ps for the APD. As a comparison, the conventional spectrometer used in this experiment, InSpectrum 300 (Acton Inc.), provides a 3-cm−1 spectral resolution with its 1,200-line grating.
Fig. S1.
Spectral resolution for detectors with different TTS.
Acknowledgments
We gratefully acknowledge support from the National Science Foundation Grants PHY-1241032 (INSPIRE CREATIV), CBET-1250363, DBI-1455671, DBI-1532188, and ECCS Award 1509268. We also acknowledge the support of NIH (R21-EB011703, R01-HL11136, and R01-CA138653) and the Robert A. Welch Foundation, Award A-1261.
Footnotes
The authors declare no conflict of interest.
This article contains supporting information online at www.pnas.org/lookup/suppl/doi:10.1073/pnas.1516249112/-/DCSupplemental.
References
- 1.Raman C, Krishnan K. The optical analogue of the Compton effect. Nature. 1928;121(3053):711. [Google Scholar]
- 2.Barrow GM. Introduction to Molecular Spectroscopy. McGraw-Hill; New York: 1962. [Google Scholar]
- 3.Chung C-Y, Potma EO. Biomolecular imaging with coherent nonlinear vibrational microscopy. Annu Rev Phys Chem. 2013;64:77–99. doi: 10.1146/annurev-physchem-040412-110103. [DOI] [PMC free article] [PubMed] [Google Scholar]
- 4.Camp CH, Jr, et al. High-speed coherent Raman fingerprint imaging of biological tissues. Nat Photonics. 2014;8(8):627–634. doi: 10.1038/nphoton.2014.145. [DOI] [PMC free article] [PubMed] [Google Scholar]
- 5.Meng Z, Petrov GI, Yakovlev VV. Microscopic coherent Raman imaging using low-cost continuous wave lasers. Laser Phys Lett. 2013;10(6):065701. [Google Scholar]
- 6.Saito R, Hofmann M, Dresselhaus G, Jorio A, Dresselhaus MS. Raman spectroscopy of graphene and carbon nanotubes. Adv Phys. 2011;60(3):413–550. [Google Scholar]
- 7.Hokr BH, et al. Single-shot stand-off chemical identification of powders using random Raman lasing. Proc Natl Acad Sci USA. 2014;111(34):12320–12324. doi: 10.1073/pnas.1412535111. [DOI] [PMC free article] [PubMed] [Google Scholar]
- 8.Wong Kee Song L-M, Marcon NE. Fluorescence and Raman spectroscopy. Gastrointest Endosc Clin N Am. 2003;13(2):279–296. doi: 10.1016/s1052-5157(03)00013-8. [DOI] [PubMed] [Google Scholar]
- 9.Patolsky F, Zheng G, Lieber CM. Fabrication of silicon nanowire devices for ultrasensitive, label-free, real-time detection of biological and chemical species. Nat Protoc. 2006;1(4):1711–1724. doi: 10.1038/nprot.2006.227. [DOI] [PubMed] [Google Scholar]
- 10.Gardiner T, et al. A lightweight near-infrared spectrometer for the detection of trace atmospheric species. Rev Sci Instrum. 2010;81(8):083102. doi: 10.1063/1.3455827. [DOI] [PubMed] [Google Scholar]
- 11.Burkart A, Cogliati S, Schickling A, Rascher U. 2014. A novel UAV-based ultra-light weight spectrometer for field spectroscopy. IEEE Sensors Journal 14(1):62–67.
- 12.Saari H, et al. Novel Hyperspectral Imager for Lightweight UAVs. SPIE Defense, Security, and Sensing. International Society for Optics and Photonics; Orlando, FL: 2010. p. 766805. [Google Scholar]
- 13.Lewis EN, Treado PJ, Levin IW. A miniaturized, no-moving-parts Raman spectrometer. Appl Spectrosc. 1993;47(5):539–543. [Google Scholar]
- 14.Gupta N, Fell NF., Jr A compact collinear AOTF Raman spectrometer. Talanta. 1997;45(2):279–284. doi: 10.1016/s0039-9140(97)00145-8. [DOI] [PubMed] [Google Scholar]
- 15.Cullum BM, et al. Development of a compact, handheld Raman instrument with no moving parts for use in field analysis. Rev Sci Instrum. 2000;71(4):1602–1607. [Google Scholar]
- 16.Harris SE, Wallace RW. Acousto-optic tunable filter. Josa. 1969;59(6):744–747. [Google Scholar]
- 17.Chang IC. Noncollinear acousto‐optic filter with large angular aperture. Appl Phys Lett. 1974;25(7):370–372. [Google Scholar]
- 18.Redding B, Popoff SM, Cao H. All-fiber spectrometer based on speckle pattern reconstruction. Opt Express. 2013;21(5):6584–6600. doi: 10.1364/OE.21.006584. [DOI] [PubMed] [Google Scholar]
- 19.Robinson AM, Harroun SG, Bergman J, Brosseau CL. Portable electrochemical surface-enhanced Raman spectroscopy system for routine spectroelectrochemical analysis. Anal Chem. 2012;84(3):1760–1764. doi: 10.1021/ac2030078. [DOI] [PubMed] [Google Scholar]
- 20.Xu X, et al. Near‐field enhanced plasmonic‐magnetic bifunctional nanotubes for single cell bioanalysis. Adv Funct Mater. 2013;23(35):4332–4338. [Google Scholar]
- 21.Petrov G, Yakovlev V, Minkovski N. Broadband nonlinear optical conversion of a high-energy diode-pumped picosecond laser. Opt Commun. 2004;229(1):441–445. [Google Scholar]
- 22.Solli D, Chou J, Jalali B. Amplified wavelength–time transformation for real-time spectroscopy. Nat Photonics. 2007;2(1):48–51. [Google Scholar]
- 23.Foster MA, et al. Silicon-chip-based ultrafast optical oscilloscope. Nature. 2008;456(7218):81–84. doi: 10.1038/nature07430. [DOI] [PubMed] [Google Scholar]
- 24.Hult J, Watt RS, Kaminski CF. High bandwidth absorption spectroscopy with a dispersed supercontinuum source. Opt Express. 2007;15(18):11385–11395. doi: 10.1364/oe.15.011385. [DOI] [PubMed] [Google Scholar]
- 25.Born M, Wolf E. 1980. Principles of Optics (Pergamon, Oxford), p 188.
- 26.Foster MA, Salem R, Gaeta AL. Ultrahigh-speed optical processing using space-time duality. Opt Photonics News. 2011;22(5):29–35. [Google Scholar]
- 27.Asghari MH, Jalali B. Stereopsis-inspired time-stretched amplified real-time spectrometer (STARS) Photonics J, IEEE. 2012;4(5):1693–1701. [Google Scholar]
- 28.Buckley BW, Madni AM, Jalali B. Coherent time-stretch transformation for real-time capture of wideband signals. Opt Express. 2013;21(18):21618–21627. doi: 10.1364/OE.21.021618. [DOI] [PubMed] [Google Scholar]
- 29.Bhushan AS, Coppinger F, Jalali B. Time-stretched analogue-to-digital conversion. Electron Lett. 1998;34(11):1081–1083. [Google Scholar]


