Significance
Plasma consists of DNA released from multiple tissues within the body. Using genome-wide bisulfite sequencing of plasma DNA, we obtained a bird’s eye view of the identities and contributions of these tissues to the circulating DNA pool. The tissue contributors and their relative proportions are identified by a bioinformatics deconvolution process that draws reference from DNA methylation signatures representative of each tissue type. We validated this approach in pregnant women, cancer patients, and transplant recipients. This method also allows one to identify the tissue of origin of genomic aberrations observed in plasma DNA. This approach has numerous research and diagnostic applications in prenatal testing, oncology, transplantation monitoring, and other fields.
Keywords: noninvasive prenatal testing, circulating tumor DNA, liquid biopsy, transplantation monitoring, epigenetics
Abstract
Plasma consists of DNA released from multiple tissues within the body. Using genome-wide bisulfite sequencing of plasma DNA and deconvolution of the sequencing data with reference to methylation profiles of different tissues, we developed a general approach for studying the major tissue contributors to the circulating DNA pool. We tested this method in pregnant women, patients with hepatocellular carcinoma, and subjects following bone marrow and liver transplantation. In most subjects, white blood cells were the predominant contributors to the circulating DNA pool. The placental contributions in the plasma of pregnant women correlated with the proportional contributions as revealed by fetal-specific genetic markers. The graft-derived contributions to the plasma in the transplant recipients correlated with those determined using donor-specific genetic markers. Patients with hepatocellular carcinoma showed elevated plasma DNA contributions from the liver, which correlated with measurements made using tumor-associated copy number aberrations. In hepatocellular carcinoma patients and in pregnant women exhibiting copy number aberrations in plasma, comparison of methylation deconvolution results using genomic regions with different copy number status pinpointed the tissue type responsible for the aberrations. In a pregnant woman diagnosed as having follicular lymphoma during pregnancy, methylation deconvolution indicated a grossly elevated contribution from B cells into the plasma DNA pool and localized B cells as the origin of the copy number aberrations observed in plasma. This method may serve as a powerful tool for assessing a wide range of physiological and pathological conditions based on the identification of perturbed proportional contributions of different tissues into plasma.
There is much recent interest in the diagnostic applications of cell-free DNA in plasma. Cell-free fetal DNA has been found in the plasma of pregnant women (1). Its detection has made noninvasive prenatal testing, most notably for chromosomal aneuploidies, a clinical reality (2–7). Tumor-derived DNA has been found in the plasma of cancer patients (8–12), offering the possibility of performing “liquid biopsy” for cancer assessment and monitoring. Following organ transplantation, donor-derived DNA from the transplanted organs has been detected in the plasma of the recipients (13) and has been used for monitoring graft rejection (14).
Plasma DNA is generally regarded as consisting of a mixture of DNA released from cells from different tissues of the body. Through the analysis of genetic differences between the minor and major background circulating DNA species, researchers have shown that a number of bodily organs made contributions to the plasma DNA pool. For example, studies on pregnant cases in which the fetus and placenta exhibit different karyotypes have demonstrated that the placenta is the origin of the cell-free fetal DNA detectable in the maternal circulation (15, 16). The detection of tumor-associated genetic alterations has allowed the detection of tumor DNA originating from cancer at different body organs in plasma (17). The detection of donor-derived genetic signatures in the plasma of patients following bone marrow (18) and solid organ transplantation (e.g., liver transplantation) (13, 19) has provided a glimpse of the contribution by these various organs into the circulating DNA pool.
On the other hand, different DNA methylation signatures can be found in different tissues (20, 21) and even between different cell types within a particular tissue (22). Therefore, the use of such signatures is a potential method for tracing the tissue of origin of plasma DNA. Indeed, researchers have detected organ-specific DNA methylation signatures in plasma, e.g., placental methylation signatures in maternal plasma (23–26) and tumor-associated methylation changes in the plasma of cancer patients (27, 28). These studies have generally focused on signatures of one tissue or organ at a time.
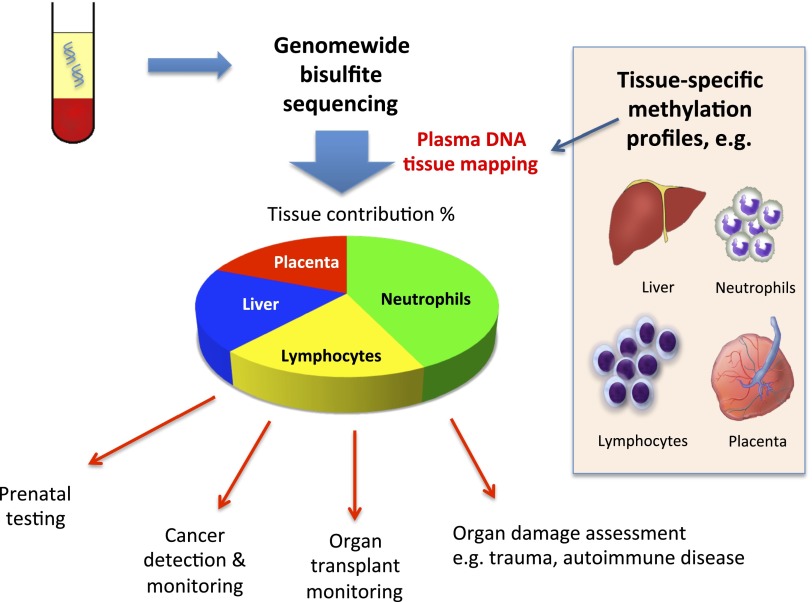
We reason that it would be of great biological and potential diagnostic interest if an approach can be developed that simultaneously determines the relative contributions of DNA from multiple tissue types to the plasma DNA pool. Such an approach would provide a “bird’s eye view” of the plasma DNA contributions by different tissues. We based this approach on the performance of genome-wide bisulfite sequencing of plasma DNA (24, 28) (Fig. 1). Then, we used the recent availability of high-resolution methylation profiles of multiple tissue types (21, 24, 29) to deconvolute the plasma bisulfite sequencing data into the percentage contributions by different tissues into plasma. Through this approach, we obtained a “tissue map” of plasma DNA. We applied this approach to study plasma samples obtained from pregnant women, cancer patients, patients following transplantation, and healthy controls. Finally, we demonstrated that this method could be used to trace the tissue of origin of copy number aberrations observed in plasma and demonstrated its potential clinical utility.
Fig. 1.
Schematic illustration of the principle of plasma DNA tissue mapping by genome-wide methylation sequencing and its applications.
Results
Identification of Methylation Markers for Plasma DNA Tissue Mapping.
We studied the methylation profiles of 14 tissues (Dataset S1) (21, 24, 29) to select markers for plasma DNA tissue mapping (see Materials and Methods for details). Two types of markers were identified. A type I marker refers to a genomic locus that shows a methylation level in one of the tissues that is significantly different from those in the other issues. A type II marker refers to a genomic locus that shows a high variability in methylation densities across the panel of tissues. We identified 1,013 type I markers and 4,807 type II markers (Dataset S1). These 5,820 markers were then used in the deconvolution process for plasma DNA tissue mapping.
Methylation Deconvolution of Mixtures of DNA from Different Tissues.
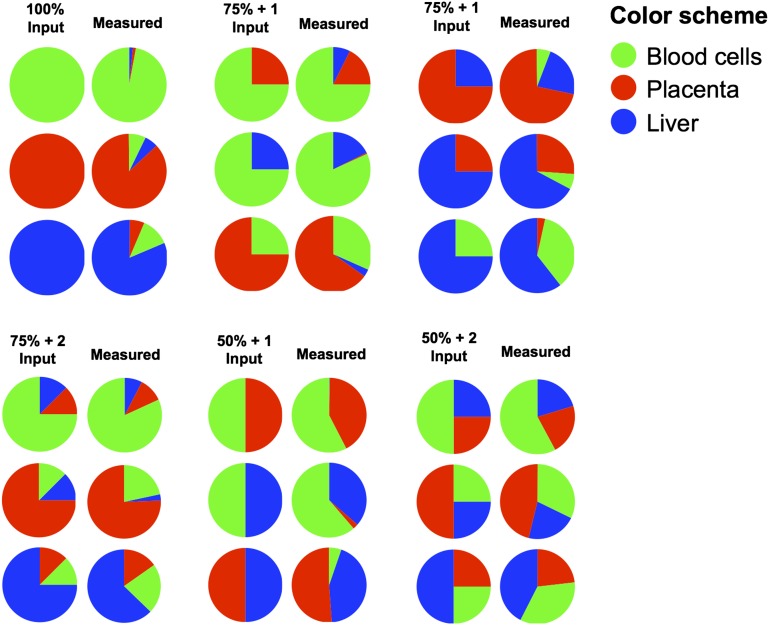
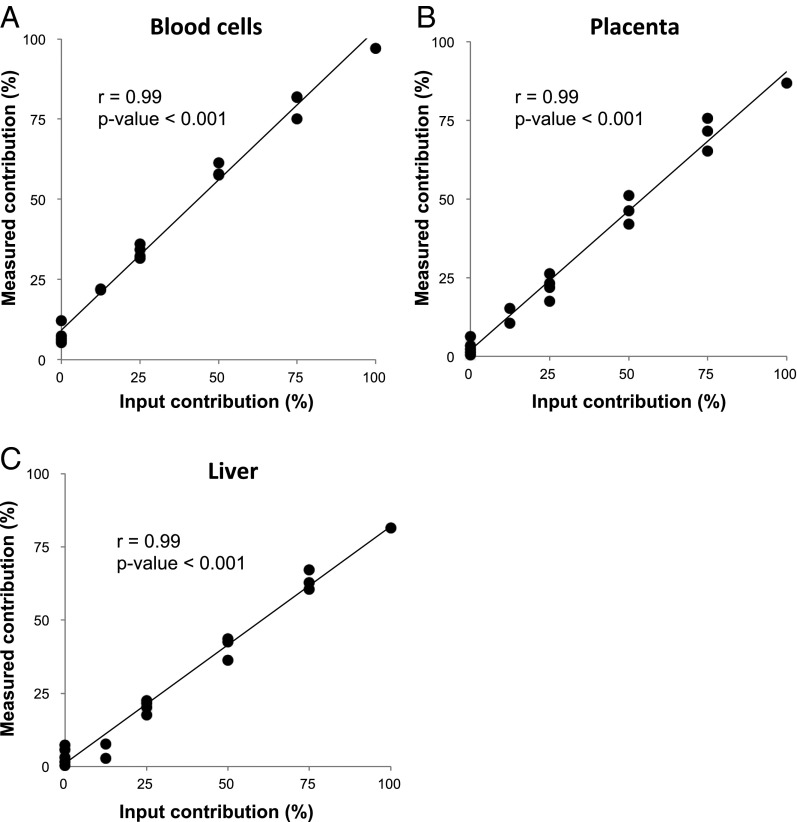
Blood cells (18), the liver (13, 19), and the placenta during pregnancy (15, 16) are known to be major contributors of circulating nucleic acids. We therefore tested the deconvolution algorithm by using DNA mixtures of varying percentage contributions (denoted as input DNA in Fig. 2) of buffy coat DNA, placenta DNA, and liver DNA. The buffy coat DNA was obtained from a 40-y-old healthy nonpregnant woman. The placenta DNA was obtained following the delivery of a healthy female baby at 38 wk of gestation. The liver DNA was obtained from the nonneoplastic liver tissues adjacent to a hepatocellular carcinoma (HCC) at resection from a 57-y-old female subject. As can be seen in Figs. 2 and 3, the percentage contributions measured by the sequencing and deconvolution analysis correlated well with those of the input DNA mixtures.
Fig. 2.
Pie charts depicting the results of the tissue DNA mixing experiment. Mixtures of DNA comprising varying input percentages of DNA extracted from the placenta, liver, and blood cells were prepared. The mixtures included 100% input from one of the three tissues (100% input), 75% input of one tissue plus 25% input of one other tissue (75% + 1 input), 75% input of one tissue plus 12.5% each of the other two tissues (75% + 2 input), 50% input from each of two tissues (50% + 1 input), and 50% input of one tissue plus 25% each of the other two tissues (50% + 2 input). Methylation deconvolution was performed for these mixture samples and the measured tissue percentages are shown on the right of each input condition.
Fig. 3.
Correlations between the measured and input tissue percentages for the tissue DNA mixture experiment. A–C correspond to data points obtained for each of the three tested tissue types, namely, blood cells, placenta, and liver, respectively.
Plasma DNA Methylation Deconvolution in Plasma of Pregnant Women.
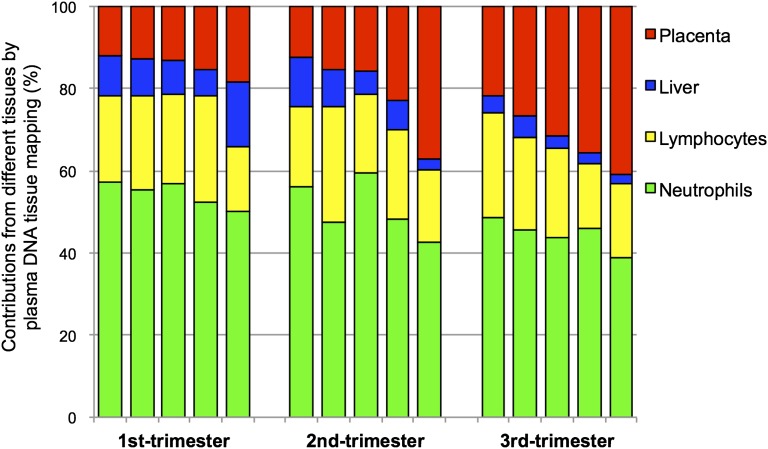
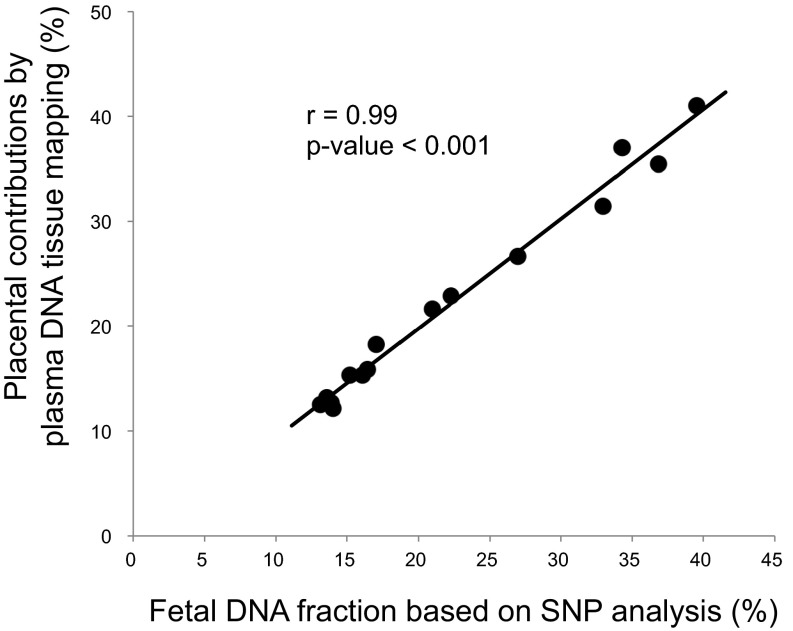
We performed genome-wide bisulfite sequencing of plasma DNA obtained from 15 pregnant women, 5 from each of the first, second, and third trimesters. Methylation deconvolution was performed, and the percentage contributions from different tissues were deduced (Fig. 4 and Table S1). These results show that the white blood cells (i.e., neutrophils and lymphocytes) are the largest contributors to the plasma DNA pool, consistent with those previously obtained following bone marrow transplantation (18). The placenta contributed 12.1–41.0% of the plasma DNA (Fig. 4 and Table S1). We also measured the placental contributions using paternally inherited fetal SNP alleles that were not possessed by the pregnant women as previously described (30). The SNP-based results would allow the independent validation of the methylation deconvolution results. Fig. 5 shows that the placental contributions determined by methylation deconvolution has a strong correlation with the fetal DNA fractions measured using SNPs (r = 0.99, P < 0.001, Pearson correlation). For the plasma of nonpregnant healthy controls, the deduced placental contributions were much lower (median: 2.2%; interquartile range: 1.5–2.9%; Table S2).
Fig. 4.
Percentage contributions of different tissues to plasma DNA for 15 pregnant women. Each bar corresponds to the results of one sample. The different colors represent the contributions of different tissues into plasma.
Table S1.
Plasma DNA tissue mapping analysis among pregnant women
| Case no. | Percentage contributions of plasma DNA (%) | SNP-based fetal DNA fraction (%) | Gestational age (wk) | ||||
| Liver | T cells | B cells | Neutrophils | Placenta | |||
| 1 | 9.7 | 10.8 | 10.2 | 57.2 | 12.1 | 14.0 | 12 6/7 |
| 2 | 9.0 | 12.9 | 10.1 | 55.3 | 12.7 | 13.9 | 13 |
| 3 | 8.1 | 10.1 | 11.7 | 57.0 | 13.2 | 13.6 | 13 1/7 |
| 4 | 6.6 | 16.6 | 9.0 | 52.5 | 15.3 | 16.1 | 13 |
| 5 | 15.8 | 11.1 | 4.6 | 50.3 | 18.2 | 17.1 | 12 6/7 |
| 6 | 11.8 | 11.5 | 8.2 | 56.1 | 12.5 | 13.1 | 21 3/7 |
| 7 | 8.9 | 11.3 | 16.9 | 47.6 | 15.3 | 15.2 | 20 6/7 |
| 8 | 5.7 | 10.7 | 8.2 | 59.6 | 15.9 | 16.4 | 22 2/7 |
| 9 | 6.9 | 10.5 | 11.4 | 48.3 | 22.9 | 22.3 | 22 1/7 |
| 10 | 2.7 | 9.2 | 8.6 | 42.5 | 37.0 | 34.3 | 21 1/7 |
| 11 | 4.2 | 15.2 | 10.4 | 48.5 | 21.6 | 21.0 | 38 1/7 |
| 12 | 5.2 | 10.0 | 12.5 | 45.6 | 26.7 | 27.0 | 38 3/7 |
| 13 | 3.2 | 14.4 | 7.2 | 43.7 | 31.5 | 33.0 | 38 1/7 |
| 14 | 2.7 | 10.9 | 5.1 | 45.9 | 35.5 | 36.8 | 38 2/7 |
| 15 | 2.3 | 10.6 | 7.1 | 39.0 | 41.0 | 39.5 | 38 3/7 |
Fig. 5.
Correlation between the placental contributions deduced by plasma DNA tissue mapping analysis and the fetal DNA fractions based on the analysis of fetal-specific SNP alleles.
Table S2.
Plasma DNA tissue mapping analysis among the nonpregnant healthy control subjects
| Case no. | Percentage contributions of plasma DNA (%) | ||||
| Liver | T cells | B cells | Neutrophils | Placenta | |
| 1 | 12.1 | 12.2 | 10.0 | 64.9 | 0.9 |
| 2 | 10.4 | 10.2 | 9.6 | 67.3 | 2.4 |
| 3 | 10.6 | 13.7 | 7.7 | 65.7 | 2.3 |
| 4 | 10.7 | 13.2 | 9.4 | 65.1 | 1.6 |
| 5 | 10.7 | 12.0 | 9.2 | 64.6 | 3.5 |
| 6 | 10.4 | 15.2 | 11.0 | 60.4 | 3.0 |
| 7 | 11.2 | 9.9 | 12.9 | 63.3 | 2.7 |
| 8 | 10.0 | 10.6 | 9.1 | 68.0 | 2.3 |
| 9 | 13.6 | 16.1 | 8.2 | 60.2 | 1.9 |
| 10 | 7.9 | 15.5 | 12.6 | 60.8 | 3.1 |
| 11 | 7.2 | 17.3 | 7.9 | 66.6 | 1.1 |
| 12 | 10.3 | 15.9 | 9.7 | 61.6 | 2.5 |
| 13 | 11.5 | 11.5 | 11.7 | 61.5 | 3.8 |
| 14 | 23.8 | 10.5 | 9.3 | 54.6 | 1.8 |
| 15 | 12.6 | 14.4 | 7.9 | 62.0 | 3.2 |
| 16 | 9.2 | 21.5 | 8.8 | 58.1 | 2.4 |
| 17 | 6.2 | 14.8 | 11.2 | 64.8 | 3.0 |
| 18 | 12.0 | 16.8 | 9.8 | 59.1 | 2.3 |
| 19 | 12.8 | 11.5 | 10.6 | 61.9 | 3.2 |
| 20 | 8.0 | 9.8 | 9.3 | 68.8 | 4.1 |
| 21 | 9.2 | 10.9 | 6.8 | 70.2 | 2.8 |
| 22 | 24.8 | 9.4 | 10.0 | 54.7 | 1.1 |
| 23 | 9.8 | 13.7 | 10.0 | 65.4 | 1.2 |
| 24 | 9.7 | 12.0 | 9.1 | 67.2 | 2.0 |
| 25 | 8.1 | 15.9 | 10.4 | 64.0 | 1.6 |
| 26 | 13.4 | 13.1 | 9.8 | 61.9 | 1.7 |
| 27 | 13.0 | 11.7 | 9.4 | 65.0 | 1.0 |
| 28 | 12.1 | 14.7 | 9.6 | 62.3 | 1.3 |
| 29 | 10.2 | 16.3 | 6.7 | 66.0 | 0.8 |
| 30 | 12.7 | 11.2 | 9.2 | 64.8 | 2.1 |
| 31 | 19.4 | 11.8 | 7.6 | 59.5 | 1.7 |
| 32 | 14.6 | 11.2 | 7.2 | 65.7 | 1.3 |
| Median | 10.7 | 12.6 | 9.4 | 64.3 | 2.2 |
| Lower quartile | 9.8 | 11.2 | 8.7 | 61.3 | 1.5 |
| Upper quartile | 12.7 | 15.3 | 10.0 | 65.7 | 2.9 |
Plasma DNA Methylation Deconvolution in Posttransplantation Recipients.
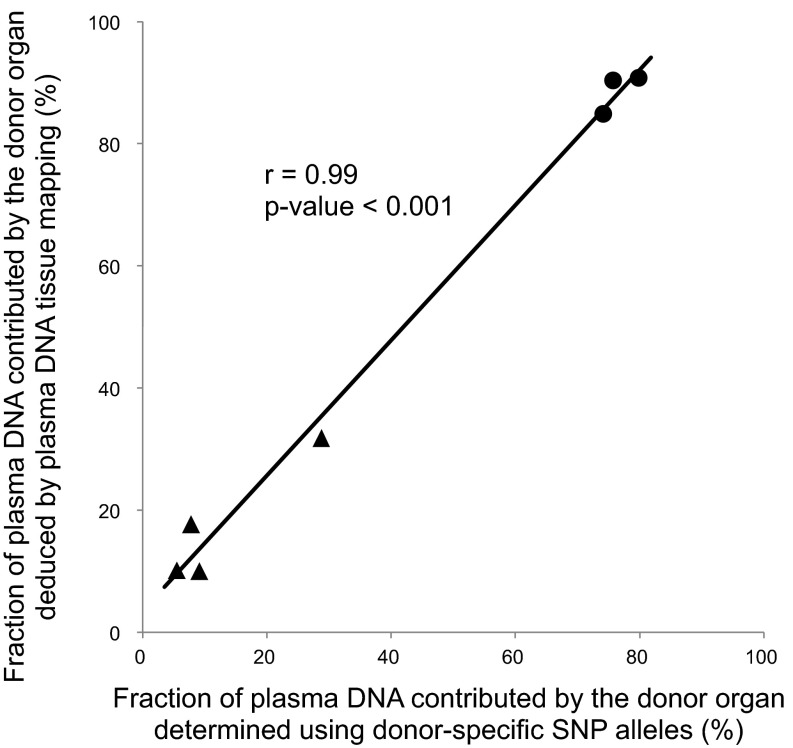
Subjects who received transplantation provided a valuable opportunity for validating the plasma DNA tissue mapping approach. By using SNP alleles that were present in an organ donor and that were absent in a transplant recipient, one could measure the fractional concentration of the transplanted organ in plasma as previously described (19). This result could then be compared with that deduced using methylation deconvolution. We performed plasma DNA tissue mapping for four liver transplant recipients and three bone marrow transplant recipients (Table S3). The donor DNA fractions estimated using the donor-specific SNP alleles were compared with the liver contributions among the liver transplant recipients, whereas those among the bone marrow transplant recipients were compared with the white blood cell contributions (i.e., neutrophils plus lymphocytes). Fig. 6 shows a strong correlation between the methylation deconvolution and SNP-based results (r = 0.99, P < 0.001, Pearson correlation).
Table S3.
Plasma DNA tissue mapping analysis among organ transplantation patients
| Case no. | Percentage contributions of plasma DNA (%) | SNP-based donor DNA fraction (%) | ||||
| Liver | T cells | B cells | Neutrophils | Placenta | ||
| LTP-1 | 10.0 | 8.2 | 12.6 | 66.5 | 2.7 | 9.1 |
| LTP-2 | 31.8 | 3.1 | 12.9 | 51.3 | 0.9 | 28.8 |
| LTP-3 | 10.1 | 9.1 | 16.2 | 62.8 | 1.7 | 5.5 |
| LTP-4 | 17.7 | 7.2 | 15.3 | 55.6 | 4.2 | 7.8 |
| BMT-1 | 7.1 | 11.7 | 9.3 | 69.8 | 2.1 | 79.8 |
| BMT-2 | 13.2 | 13.4 | 12.6 | 58.8 | 1.9 | 74.1 |
| BMT-3 | 8.8 | 16.3 | 14.0 | 60.1 | 0.8 | 75.7 |
BMT, bone marrow transplant recipient; LTP, liver transplant recipient.
Fig. 6.
Correlation between the fractions of plasma DNA contributed by the transplanted graft deduced by plasma DNA tissue mapping and the donor DNA fractions determined using donor-specific SNP alleles. The triangles represent the results of liver transplant recipients and the dots represent the results of bone marrow transplant recipients.
Plasma DNA Methylation Deconvolution in Cancer Patients.
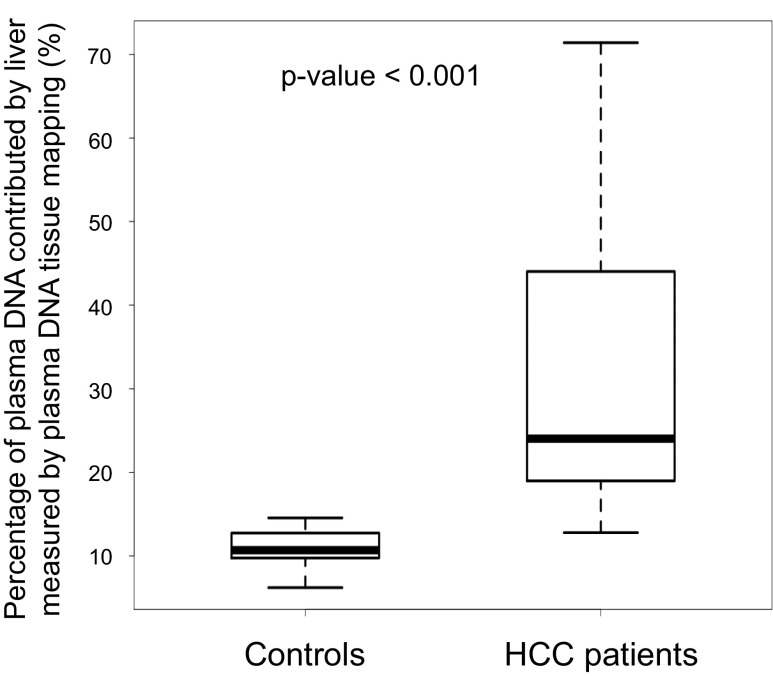
Genome-wide bisulfite sequencing was performed in 29 HCC patients and 32 control subjects without cancer. Among them, the plasma DNA genome-wide bisulfite sequencing results have been reported in a previous study (28) for 26 HCC patients and the 32 controls. Plasma DNA tissue mapping was carried out using the bisulfite sequencing data (Table S4). The methylation deconvolution indicated that the median percentage contributions by the liver to the plasma for the HCC and control subjects were 24.0% (interquartile range: 19.0–44.0%) and 10.7% (interquartile range: 9.8–12.7%), respectively. The HCC patients thus had higher liver contributions to the plasma than the control subjects (P < 0.001, Mann–Whitney rank sum test; Fig. 7).
Table S4.
Plasma DNA tissue mapping analysis among HCC patients
| Case no. | Percentage contributions of plasma DNA (%) | |||
| Liver | T cells | B cells | Neutrophils | |
| HCC-1 | 45.6 | 9.0 | 9.6 | 35.8 |
| HCC-2 | 44.5 | 14.6 | 0.4 | 40.5 |
| HCC-3 | 19.0 | 12.9 | 9.8 | 58.3 |
| HCC-4 | 27.4 | 10.0 | 6.6 | 56.0 |
| HCC-5 | 20.5 | 11.3 | 8.8 | 59.4 |
| HCC-6 | 45.8 | 9.3 | 4.3 | 40.6 |
| HCC-7 | 25.6 | 8.4 | 9.2 | 56.8 |
| HCC-8 | 20.5 | 8.8 | 12.4 | 58.2 |
| HCC-9 | 52.2 | 8.3 | 6.5 | 33.0 |
| HCC-10 | 24.0 | 21.8 | 12.7 | 41.4 |
| HCC-11 | 55.7 | 8.3 | 5.3 | 30.7 |
| HCC-12 | 20.7 | 14.3 | 9.7 | 55.2 |
| HCC-13 | 30.7 | 16.6 | 2.5 | 50.2 |
| HCC-14 | 16.2 | 11.8 | 9.0 | 63.0 |
| HCC-15 | 14.7 | 10.6 | 7.4 | 67.4 |
| HCC-16 | 20.9 | 13.4 | 10.7 | 55.0 |
| HCC-17 | 24.8 | 10.1 | 10.3 | 54.8 |
| HCC-18 | 34.1 | 14.6 | 9.2 | 42.1 |
| HCC-19 | 22.9 | 10.9 | 9.3 | 56.8 |
| HCC-20 | 17.9 | 13.5 | 9.3 | 59.3 |
| HCC-21 | 84.7 | 4.7 | 1.6 | 9.0 |
| HCC-22 | 14.7 | 20.0 | 8.6 | 56.6 |
| HCC-23 | 12.8 | 13.9 | 9.5 | 63.9 |
| HCC-24 | 17.0 | 11.3 | 12.7 | 59.1 |
| HCC-25 | 33.3 | 10.2 | 9.6 | 46.8 |
| HCC-26 | 20.3 | 9.9 | 9.0 | 60.8 |
| HCC-27 | 15.9 | 14.9 | 7.6 | 61.5 |
| HCC-28 | 44.0 | 15.0 | 1.3 | 39.7 |
| HCC-29 | 71.4 | 6.1 | 3.0 | 19.5 |
| Median | 24.0 | 11.3 | 9.0 | 55.2 |
| Lower quartile | 19.0 | 9.3 | 6.5 | 40.6 |
| Upper quartile | 44.0 | 14.3 | 9.6 | 59.1 |
Fig. 7.
Percentage of plasma DNA contributed by the liver among healthy controls and patients with HCC as deduced by plasma DNA tissue mapping analysis.
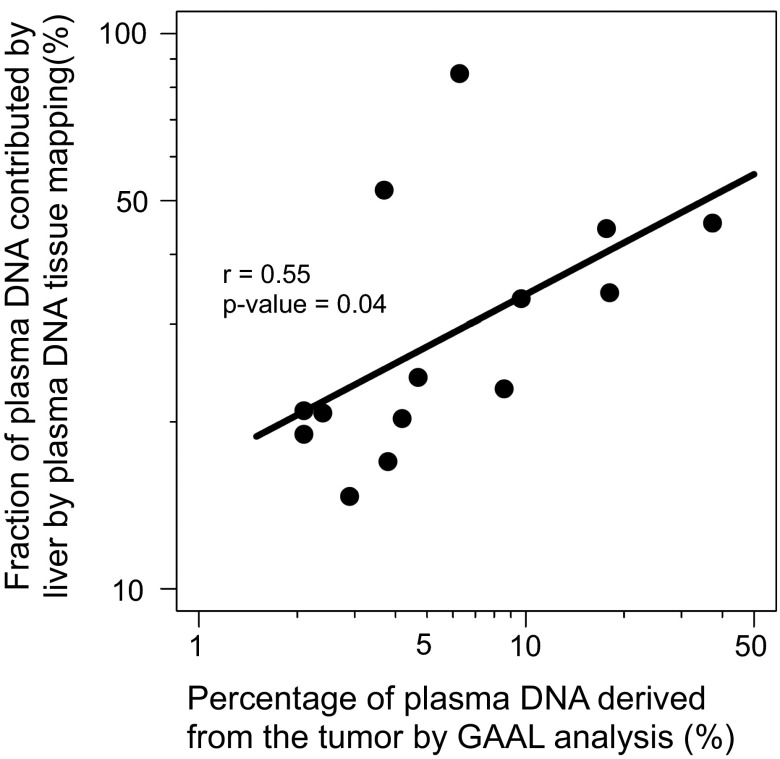
For 14 cases in which tumor tissues were available, we also measured the fractional concentrations of HCC tumor DNA in the plasma by studying the genomic regions with loss of heterozygosity, a method we previously named genome-wide aggregated allelic loss (GAAL) (11). Fig. 8 shows that there is a good correlation between the contributions of liver-derived DNA into plasma deduced by methylation deconvolution and the tumor DNA concentration measured by GAAL (r = 0.55, P = 0.04, Pearson correlation).
Fig. 8.
Correlation between the fractions of plasma DNA contributed by the liver based on plasma DNA tissue mapping analysis and the tumor-derived plasma DNA fractions determined by GAAL analysis.
Tracing the Tissue of Origin of Plasma Copy Number Aberrations.
The detection of copy number aberrations in plasma has been used in the contexts of noninvasive prenatal testing (2, 4, 5, 7, 31) and cancer detection (10, 11, 32). It would be advantageous if one could identify the tissue of origin of the copy number aberrations. For the noninvasive prenatal detection of subchromosomal copy number aberrations (33), it would be useful to identify if the plasma aberrations originated from (i) the placenta alone, (ii) the mother alone, or (iii) both the placenta and the mother. As another example, if the detection of plasma copy number aberrations is eventually used as a cancer screening tool (10, 11, 32), it would be clinically very informative to be able to identify the tissue of origin of the cancer for subsequent diagnostic or therapeutic procedures.
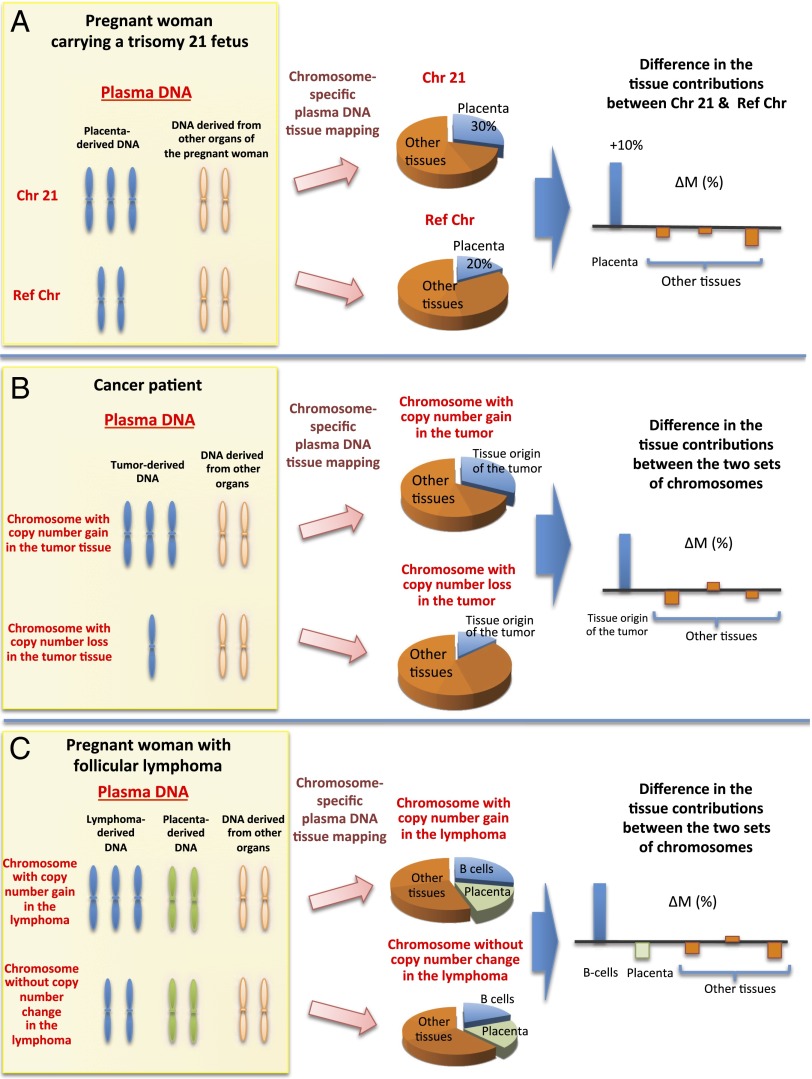
We reasoned that it would be possible to use methylation deconvolution to identify the tissue of origin of plasma copy number aberrations. For example, when a copy number gain is observed in plasma, methylation deconvolution of markers located within the affected genomic region should reveal increased contribution by the tissue of origin of the aberration compared with the same analysis conducted on a genomic region without copy number aberration (Fig. 9). Conversely, when a copy number loss is observed in plasma, methylation deconvolution of markers located within the affected genomic region should reveal decreased contribution by the tissue of origin of the aberration. In the following sections, we illustrate the use of this concept in pregnant women carrying fetuses affected by trisomy 21, in HCC patients, and in a pregnant woman with lymphoma.
Fig. 9.
Schematic illustration showing the principle of analyzing the tissue of origin for plasma DNA copy number aberrations using plasma DNA tissue mapping. Three clinical scenarios are illustrated: (A) pregnancy involving a trisomy 21 fetus; (B) cancer; and (C) pregnancy with concurrent malignancy. Ref Chr, reference chromosome.
Tracing the Placental Origin of Increased Chromosome 21 Copy Numbers in Maternal Plasma.
A fetus with trisomy 21 would release an increased amount of chromosome 21 sequences carrying a placental methylation signature into the plasma of its pregnant mother. Hence, when one performs methylation deconvolution on the plasma bisulfite sequencing data using markers present on chromosome 21, the placental contribution (denoted as ) will be expected to be increased compared with the placental contribution estimated using markers present on the other chromosomes (denoted as ; Fig. 9A). In the following equation, we define a value ΔM where
| [1] |
One can further calculate the ΔM value for each of the other tissue types involved in the methylation deconvolution. If the placenta is the origin of the increased copy number of chromosome 21 in the maternal plasma, then the ΔM value for the placenta will be expected to be the highest compared with those from the other tissue types.
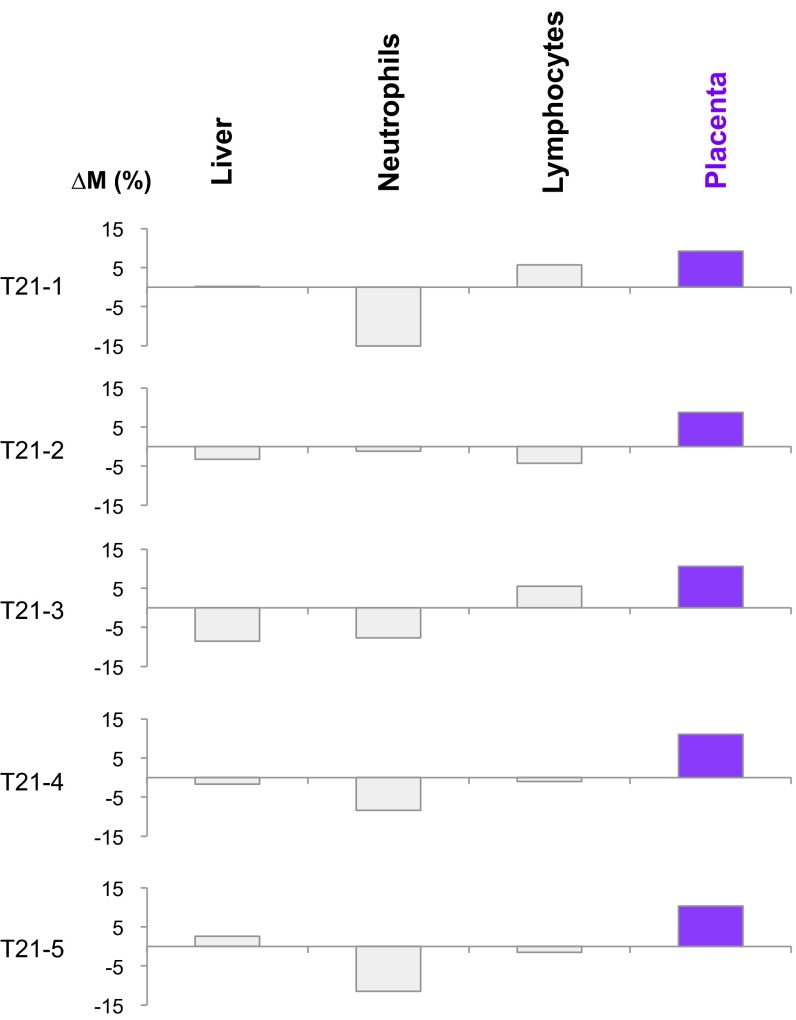
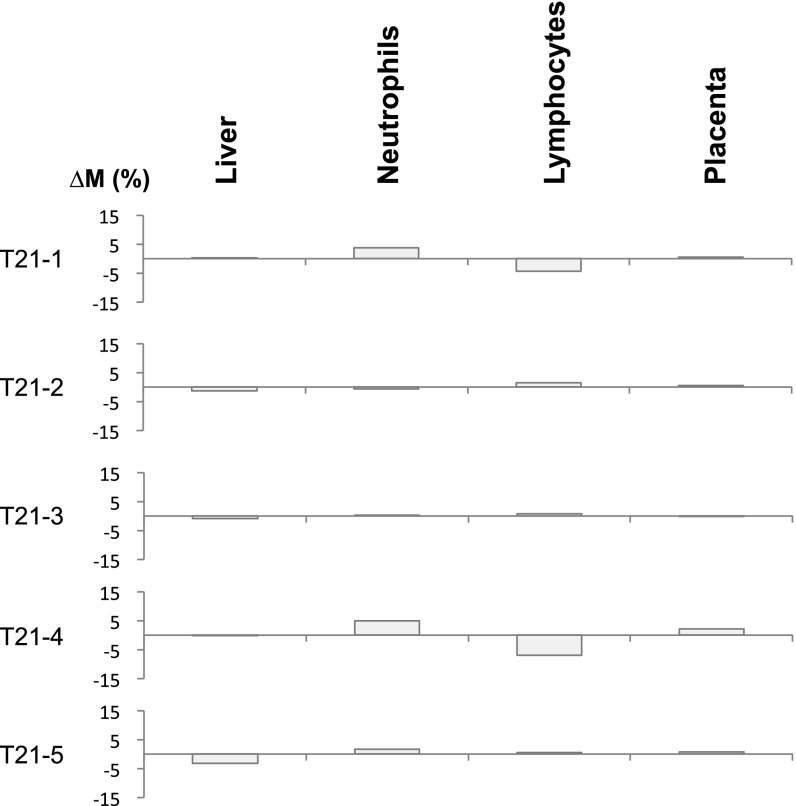
Genome-wide bisulfite sequencing was previously performed on the plasma DNA obtained from five pregnant women carrying fetuses with trisomy 21 (24). The gestational ages ranged between 13 and 14 wk. In the present study, we performed methylation deconvolution on the sequencing data, and ΔM values were calculated using Eq. 1 for multiple tissue types. As can be seen in Fig. 10, the placenta possessed the highest ΔM values for chromosome 21 among the studied tissue types. When the analysis was performed for the other chromosomes, no single tissue consistently showed a raised ΔM value (Fig. S1).
Fig. 10.
∆M values across different tissues for pregnant women each carrying a fetus with trisomy 21 (T21). In each of the five cases, the value of ∆M was highest for the placenta, suggesting that the copy number aberrations originated from the placenta.
Fig. S1.
∆M values across different tissues for pregnant women each carrying a fetus with trisomy 21 (T21). The methylation markers on all of the autosomes except chromosome 21 were randomly divided into two sets, namely, set A and set B. The randomization was implemented using a series of random numbers (ranged from 0 to 1) generated by a computer. A marker associated with a random number less than 0.5 was assigned to set A; otherwise, it would be assigned to set B. In this analysis, set A included markers originating from chromosomes 1, 2, 4, 5, 6, 8, 12, 14, 15, 17, and 22, and set B included markers originating from chromosomes 3, 7, 9, 10, 11, 13, 16, 18, 19, and 20. Plasma DNA tissue mapping was conducted using each set of markers. The ∆M values shown represent the difference in contributions of a particular tissue to plasma DNA using markers in sets A and B.
Tracing the Tissue Origin of Copy Number Aberrations in the Plasma of Cancer Patients.
In cancer patients, genomic regions in which there were increased copy numbers (i.e., amplifications) would be expected to be enriched in DNA released from the tissues of origin of the respective cancers (Fig. 9B). One would therefore observe an increase in the proportional contributions of the tissues of origin of the cancer in plasma (denoted as ). In contrast, genomic regions in which there were decreased copy numbers (i.e., deletions) would be expected to be depleted in DNA released from the tissues of the respective cancers. One would then observe a decrease in the proportional contributions of the tissues of origin of the cancer in plasma (denoted as ). Similar to the trisomy 21 example above, one can define a value ΔM using the following equation:
| [2] |
For tissues that were not the tissues of origin of the cancer, there would not be any systematic effect by the copy number aberrations (i.e., amplifications or deletions) on their proportional contributions to plasma. Hence, in such an analysis, the ΔM value would be the highest for the tissues of origin of the cancer compared with those from the other tissue types.
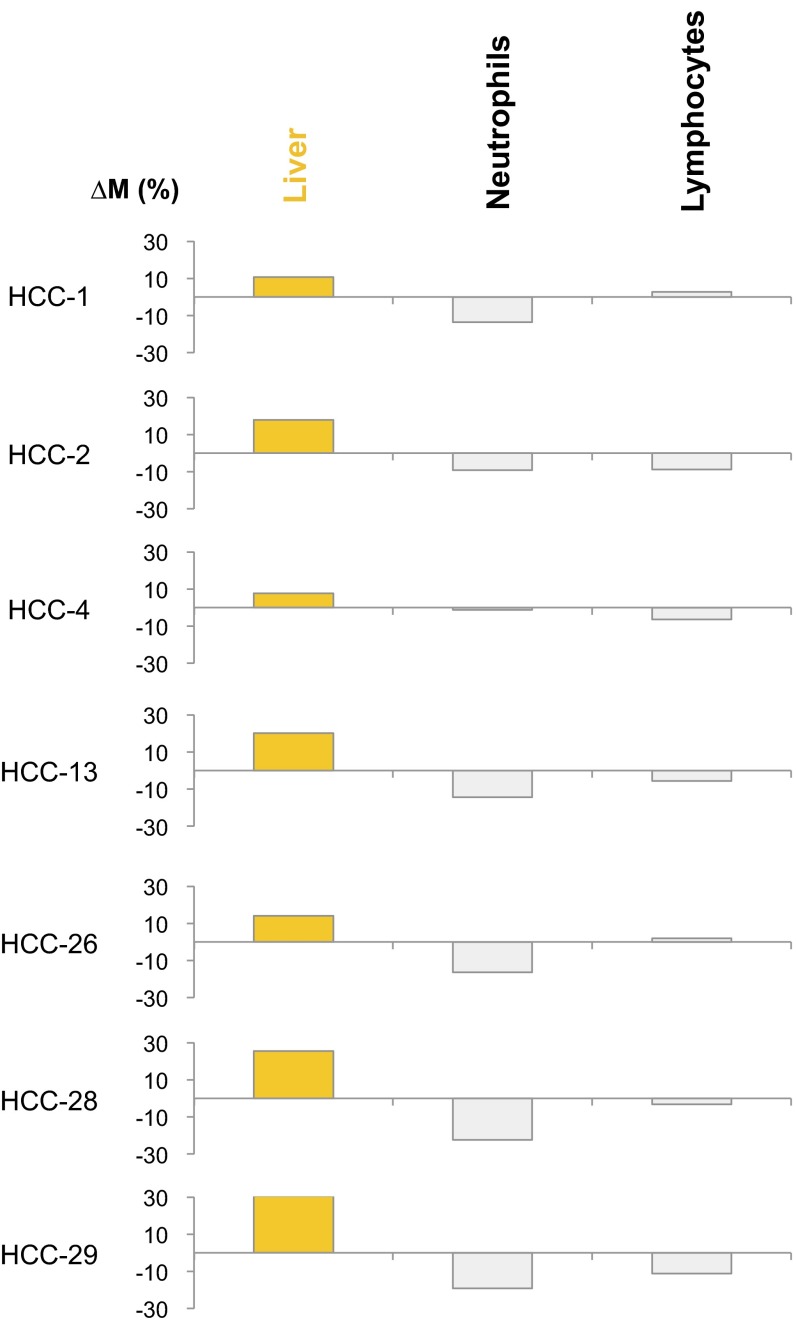
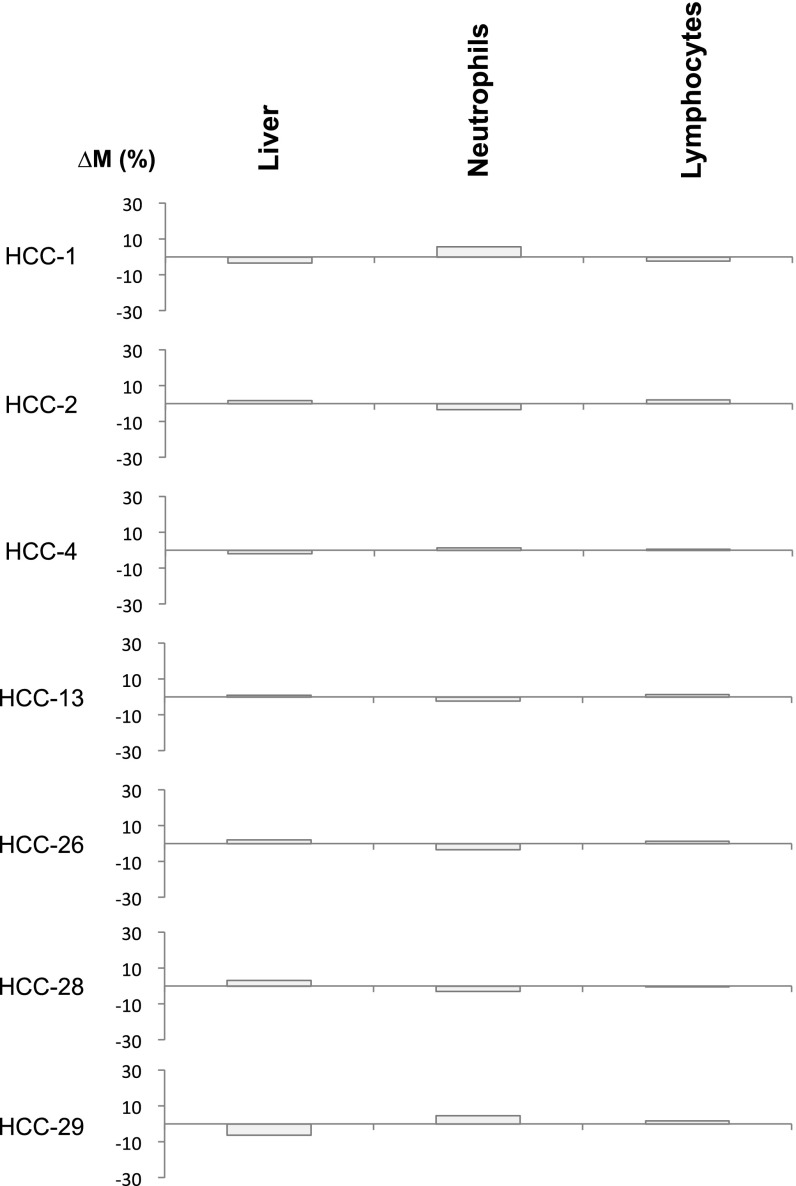
Among the HCC samples studied above, copy number aberrations affecting at least a 30-Mb region (i.e., ∼1% of the human genome) were observed in the plasma of seven HCC patients. The proportional contributions of each tissue type into plasma based on the genomic regions showing amplifications and deletions were separately determined. Then, the ΔM values were determined for each of the tissue types using Eq. 2. Fig. 11 shows that the highest ΔM values are observed for the liver for these HCC cases. As a control, we also performed the same analysis using two sets of randomly chosen genomic regions not exhibiting copy number aberrations in plasma. As can be seen in Fig. S2, for this control analysis, there is no systematic relationship between the ΔM values and the tissue of origin of the cancer.
Fig. 11.
∆M values across different tissues for the HCC patients. ∆M represents the difference in the contributions of a particular tissue to plasma DNA between regions exhibiting copy number gains and copy number losses. For each case, the highest ∆M is shown in orange. Other ∆M values are shown in gray. The tissue with the highest ∆M is considered as the tissue of origin of the copy number aberration. HCC, hepatocellular carcinoma.
Fig. S2.
∆M values across different tissues for the HCC patients. The ∆M values shown represent the difference in contributions of a particular tissue to plasma DNA between two sets of randomly selected regions without plasma DNA copy number aberrations.
Tracing the Tissue Origin of Malignancy During Pregnancy.
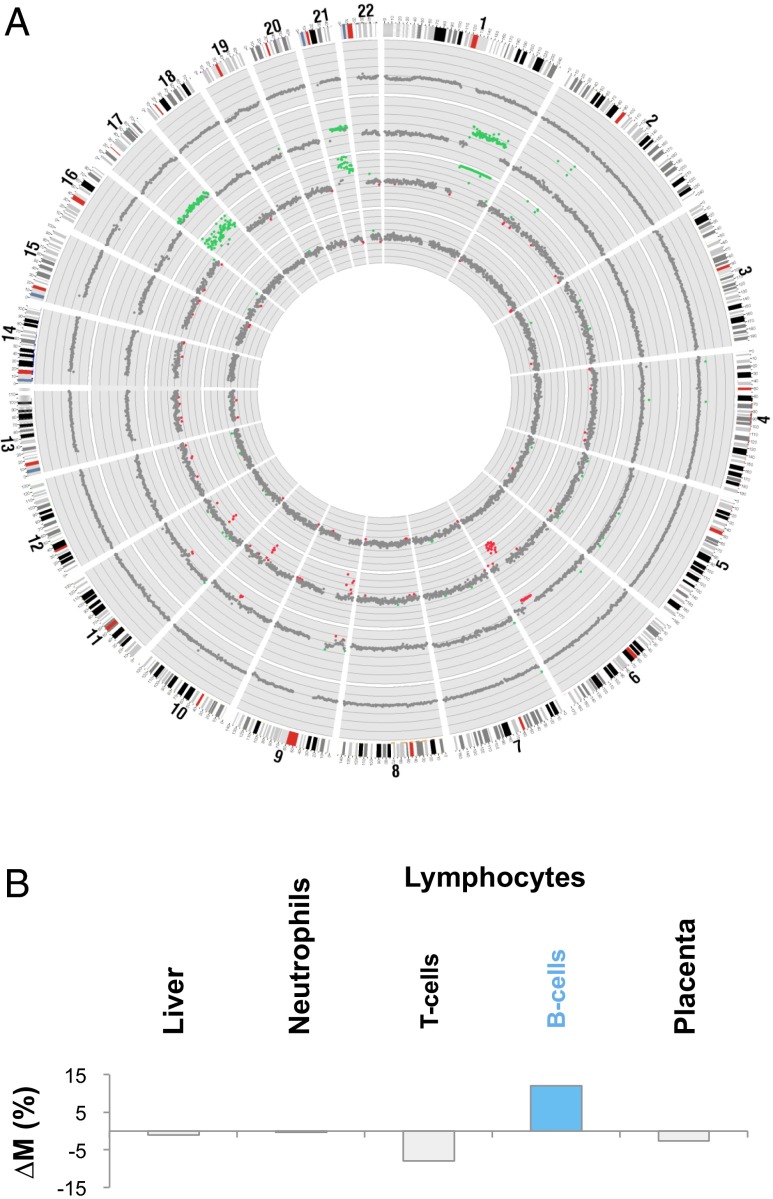
During the course of this work, we identified a 37-y-old pregnant woman who was diagnosed as having recurrent follicular lymphoma during early pregnancy. This woman was first diagnosed with follicular lymphoma in August 2011. After a course of chemotherapy, no residual lymphoma was observed in the follow-up trephine biopsies obtained in October 2011 and April 2013. She subsequently became pregnant. At the 11th week of pregnancy (March 2014), blood samples were collected for noninvasive prenatal testing of fetal chromosomal aneuploidies. However, the maternal plasma DNA sequencing analysis revealed gross abnormalities (Fig. 12A). Recurrence of the follicular lymphoma was confirmed by histological examination of lymph node and trephine biopsies.
Fig. 12.
Elucidation of the tissue of origin for the copy number aberrations identified in the plasma of a pregnant woman with concurrent follicular lymphoma. (A) Genome-wide DNA sequencing analysis for copy number aberration detection among specimens collected from the patient. From outside to inside: buffy coat of the pretreatment blood sample, lymph node biopsy, plasma sample collected before treatment, and plasma sample collected after treatment. The chromosome ideogram is shown in clockwise manner at the outermost ring. Each dot represents a 1-Mb region. Green, red, and gray dots represent regions with copy number gains, copy number losses, and without copy number aberrations, respectively. (B) ∆M values across different tissues for the pretreatment plasma sample of this patient. The B cells show the highest ∆M value, suggesting that the copy number aberrations were derived from B cells.
Fig. 12A shows the genome-wide copy number analysis in the buffy coat, lymph node biopsy, pretreatment plasma, and a plasma sample collected 10 wk after the start of chemotherapy. Copy number aberrations were detected in the lymph node biopsy and the pretreatment plasma sample but not in the posttreatment plasma sample and the buffy coat of the pretreatment plasma sample. There was a high similarity between the profiles of copy number aberrations of the lymphoma and that in the pretreatment plasma. The presence of copy number aberrations in the pretreatment plasma portion but absence of such aberrations in the blood cell portion of the same blood sample suggest that the plasma DNA abnormalities were derived from the lymphoma-associated cell-free DNA rather than circulating tumor cells. Genome-wide bisulfite sequencing and methylation deconvolution were performed on the pretreatment plasma sample (Table S5). Plasma DNA contribution of the B lymphocytes was 62.6%, and the T lymphocytes contributed 6.8%. Hence, the total proportional contribution of plasma DNA from lymphocytes was 69.4%.
Table S5.
Plasma DNA tissue mapping for the pregnant woman with recurrent follicular lymphoma
| Organ | Percentage contributions of plasma DNA (%) |
| Liver | 0.6 |
| T cells | 6.8 |
| B cells | 62.6 |
| Neutrophils | 4.4 |
| Placenta | 25.5 |
To further confirm the tissue of origin of the observed copy number aberrations in plasma, we performed plasma methylation deconvolution separately using markers present in the genomic regions showing amplifications in plasma (denoted as ) and regions showing normal copy numbers (denoted as ) (Fig. 9C)
In this patient, none of the contiguous regions exhibiting copy number losses in plasma were 30 Mb or above in size. As a result, the number of methylation markers located within the deleted regions was insufficient for tissue mapping analysis. Therefore, regions that did not exhibit any copy number aberrations were used as reference.
Fig. 12B shows the ΔM values calculated for each of the tissue types. As can be seen, the B lymphocytes show the highest ΔM value, thus confirming that they are the origin of the copy number aberrations in plasma.
Discussion
We demonstrated the feasibility of using genome-wide bisulfite sequencing of plasma DNA and through a process of deconvolution to simultaneously deduce the contributions of different types of tissues into the plasma DNA pool. Before this work, efforts had generally been focused on one tissue type at a time, e.g., placental methylation signature in pregnancy (23, 25) and donor-derived genetic markers for detecting transplant graft-derived DNA in plasma (13, 14, 19, 34). Our presently reported approach provides a bird’s eye view of the major tissue contributors of circulating DNA (Fig. 1 and Tables S1–S5).
Our study takes advantage of the recent availability of reference methylomes of a number of tissues (21, 24, 29). It is likely that such reference databases would be continually updated to include more sample types and from more individuals. The DNA mixture experiment showed that the conceptual framework of this approach is sound (Figs. 2 and 3). We then validated our approach for the detection of the plasma contribution of (i) the placenta using pregnant women, (ii) the liver using HCC patients and subjects following liver transplantation, and (iii) white blood cells using bone marrow transplantation recipients and the lymphoma case diagnosed during pregnancy. The good correlation between the results obtained using the methylation deconvolution approach and those obtained using genetic markers (Figs. 5, 6, and 8) indicates that our choice of tissues for the deconvolution analyses is justified. Future studies could be designed to address the plasma DNA contributions from other tissue types using relevant physiological or pathological scenarios. As plasma DNA has generally been regarded as a marker of cell death, our approach can be used as a general method for assessing cell death phenomena in different tissue types. Hence, in addition to applications to prenatal testing, cancer detection/monitoring and transplantation monitoring, the approach might also have applications in many branches of medicine for studying cell death or injury of various bodily tissues, e.g., stroke, myocardial infarction, trauma, autoimmune disorders, and infectious diseases (Fig. 1).
One of the key observations from this work is that DNA derived from white blood cells (i.e., neutrophils and lymphocytes) typically contributes more than 70% of the circulating DNA pool, sometimes even to more than 90%. These results are consistent with those previously obtained using donor-specific genetic markers following bone marrow transplantation that showed a predominance of circulating DNA derived from the hematopoietic system (18). However, before the present work, it was not known whether the conclusions obtained in bone marrow transplant recipients could be extrapolated to other individuals, e.g., liver cancer patients.
Our data show that characteristic perturbations of the tissue composition of the plasma DNA pool would be observed in accordance with the physiological state or underlying pathology of the subject. For example, major plasma DNA contributions from the placenta were observed during pregnancy (Fig. 4 and Table S1) that were distinguishable from the results of the healthy nonpregnant controls (Table S2). The plasma DNA contributions from the tissue of origin of the tumor in cancer patients (Fig. 7 and Table S4) were elevated compared with the controls. These observations reveal the diagnostic potential of plasma DNA tissue mapping in pinpointing the organs where the pathology might be located. Future work will be needed to apply this approach to a large cohort of subjects with different health status to test the applicability of the approach for detecting the contributions of other tissues and to establish normative values.
The ability of our method to identify the tissue of origin of copy number aberrations that can be observed in plasma has numerous potential clinical applications (Fig. 9). For example, in the use of plasma DNA sequencing for screening of cancer, one could use this method for identifying the likely tissue of origin of the cancer, for planning further diagnostic investigations, or therapeutic procedures.
The applications of our approach for cancer detection and noninvasive prenatal testing converge in the case of the pregnant woman who suffered from follicular lymphoma. We observed copy number aberrations in the plasma of this pregnant woman (Fig. 12A). Plasma methylation deconvolution revealed a very high contribution from lymphocytes into plasma. The B lymphocyte is the cell type involved in the pathology of follicular lymphoma. Thus, it was interesting to observe that our method further identified the B cells (Table S5), rather than the T cells, as the major contributor of plasma DNA in the patient. The ΔM analysis comparing the methylation deconvolution results obtained using methylation markers originating from the genomic regions showing increased copy number aberrations vs. those showing normal copy numbers further confirmed the B cells as the source of the copy number aberrations (Fig. 12B). These results are thus entirely consistent with the diagnosis of follicular lymphoma. With the increase in the clinical utility of noninvasive prenatal testing and the trend of further advances in maternal age, it is likely that more and more cases of malignancy will be detected during the course of such testing (35, 36). The approach described here would therefore be very useful in the further investigation of such cases.
In future studies, the selection of methylation markers that would be used for the deconvolution process could be further refined. In one variation, the marker set can be adjusted to focus more on the tissue types that are the less prominent contributors to the plasma DNA pool. This development would potentially uncover new pathophysiological status that one can monitor using this approach. Second, as another area of refinement, instead of carrying out genome-wide bisulfite sequencing, one could consider the use of a more targeted approach with potential cost saving. Third, with the advent of single molecule sequencing approaches, e.g., using nanopores (37), that would allow the direct interrogation of the methylation status without bisulfite conversion, the analytic precision of the approach might be improved. In this regard, it is interesting to note that nanopore sequencing has recently been demonstrated to be applicable for analyzing maternal plasma DNA (38).
In addition to the use of DNA methylation markers, one can also investigate the tissue contribution toward the circulating nucleic acids pool through the study of mRNA (39–41) and microRNA (42, 43). The DNA methylation and transcriptomic approaches are potentially synergistic to one another and would give different types of information. Future studies using both DNA methylation and transcriptomic approaches would allow one to directly compare these approaches.
In summary, we developed a general approach that can provide an overview of the tissue contribution into the circulating DNA pool. This development has opened up numerous research avenues and diagnostic applications. The ability to link genomic information generated using circulating DNA to the anatomy has created a bridge between molecular diagnostics and the traditional more organ-based medical practices. The application of this technology is analogous to a whole body molecular scan. Furthermore, the ability to localize the tissue of origin of genomic aberrations would have many applications in cancer detection, noninvasive prenatal testing and other fields. Large-scale validation of this approach would be necessary in subjects with different physiological and pathological conditions.
Materials and Methods
Subjects.
All study subjects except the lymphoma patient were recruited from the Prince of Wales Hospital of Hong Kong with informed consent. The lymphoma patient was recruited from the Hong Kong Sanatorium & Hospital, Hong Kong, with informed consent. The study was approved by the institutional review boards.
DNA Extraction and Preparation of Sequencing Libraries.
Peripheral blood samples were collected into EDTA-containing tubes. Plasma DNA was obtained as previously described (24). DNA libraries were prepared using the KAPA HTP Library Preparation Kit (Kapa Biosystems) according to the manufacturer’s instructions (28). Non–bisulfite-based plasma DNA sequencing was performed as previously reported (11). Plasma DNA bisulfite sequencing was performed as previously described (24).
DNA Sequencing and Data Analysis.
DNA libraries were prepared following manufacturer’s instructions (Illumina) and sequenced on a HiSeq or NextSeq system (Illumina). For HiSeq, 76 (single-end mode) or 76 × 2 (paired-end mode) cycles of sequencing were performed with the TruSeq SBS Kit v3 (Illumina). For NextSeq, 76 × 2 paired-end sequencing cycles were performed using the NextSEq. 500 High Ouput v2 Kit (Illumina). After base calling, adapter sequences and low quality bases (i.e., quality score < 5) were removed. The trimmed reads in FASTQ format were then processed by the methylation data analysis pipeline Methy-Pipe (44). The basic sequencing parameters, including the sequencing depth, of all of the samples are summarized in Dataset S1, at the tab labeled sequencing parameters of the Excel file.
Identification of Methylation Markers for Plasma DNA Tissue Mapping.
The bisulfite sequencing data for 14 human tissues were analyzed to identify methylation markers for plasma DNA tissue mapping. Whole genome bisulfite sequencing data for the liver, lungs, esophagus, heart, pancreas, colon, small intestines, adipose tissues, adrenal glands, brain, and T cells were retrieved from the Human Epigenome Atlas from the Baylor College of Medicine (www.genboree.org/epigenomeatlas/index.rhtml). The bisulfite sequencing data for B cells and neutrophils were from Hodges et al. (29), whereas those for the placenta were from Lun et al. (24).
All CpG islands (CGIs) and CpG shores on autosomes were assessed for potential inclusion into the methylation marker set. CGIs and CpG shores on sex chromosomes were not used, to minimize potential variations in methylation levels related to the sex-associated chromosome dosage difference in the source data. CGIs were downloaded from the University of California, Santa Cruz (UCSC) database (genome.ucsc.edu/, 27,048 CGIs for the human genome) (45), and CpG shores were defined as 2-kb flanking windows of the CGIs (46). Then, the CGIs and CpG shores were subdivided into nonoverlapping 500-bp units, and each unit was considered a potential methylation marker.
The methylation densities (i.e., the percentage of CpGs being methylated within a 500-bp unit) of all of the potential marker loci were compared between the 14 tissue types. As previously reported (24), the placenta was found to be globally hypomethylated compared with the remaining tissues. Thus, during the first step of the marker identification process, the methylation profile of the placenta was not considered. Using the methylation profiles of the remaining 13 tissue types, two types of methylation markers were identified. Type I markers refer to any genomic loci with methylation densities that are 3 SDs below or above in one tissue compared with the mean level of the 13 tissue types. Type II markers are genomic loci that demonstrate highly variable methylation densities across the 13 tissue types. A locus is considered highly variable when (A) the methylation density of the most hypermethylated tissue is at least 20% higher than that of the most hypomethylated one; and (B) the SD of the methylation densities across the 13 tissue types when divided by the mean methylation density (i.e., the coefficient of variation) of the group is at least 0.25. To reduce the number of potentially redundant markers, only one marker would be selected in one contiguous block of two CpG shores flanking one CGI. After the markers have been selected, we then considered a locus as being useful as a marker for the placenta if the placenta methylation density at the said locus is 3 SD more or less than the mean methylation density of the 13 tissues. Two hundred ninety-one markers for the placenta were thus selected and are listed in Dataset S1.
Plasma DNA Tissue Mapping.
The mathematical relationship between the methylation densities of the different methylation markers in plasma and the corresponding methylation markers in different tissues can be expressed as
where represents the methylation density of the methylation biomarker i in the plasma; pk represents the proportional contribution of tissue k to the plasma; and MDik represents the methylation density of the methylation biomarker i in tissue k. The aim of the deconvolution process was to determine the proportional contribution of tissue k to the plasma, namely pk, for each member of the panel of tissues.
Quadratic programming (47) was used to solve the simultaneous equations. A matrix was compiled including the panel of tissues and their corresponding methylation densities for each methylation marker on the combined list of type I and type II markers (a total of 5,820 markers). The program input a range of pk values for each tissue type and determined the expected plasma DNA methylation density for each marker. The tested range of pk values should fulfill the expectation that the total contribution of all candidate tissues, namely, the placenta, liver, neutrophils, and lymphocytes for this study, to plasma DNA would be 100% and the values of all pk would be nonnegative. These four tissue types were selected as each of them could be validated by one or more clinical scenarios, i.e., the placenta in pregnancy, the liver in liver transplantation and HCC, and blood cells in bone marrow transplantation and the lymphoma case. The program then identified the set of pk values that resulted in expected methylation densities across the markers that most closely resembled the data obtained from the plasma DNA bisulfite sequencing.
Methylation density values of the placental tissues were included for the 5,820 markers into a quadratic function when plasma DNA tissue mapping was performed on the samples from the pregnant women and the nonpregnant controls. The total contribution from T cells and B cells was regarded as the contribution from the lymphocytes.
Tissue Mapping of Plasma DNA Copy Number Aberrations.
To determine the tissue origin of copy number aberrations in plasma, plasma DNA tissue mapping was performed using the methylation markers located within the genomic regions exhibiting such aberrations in plasma. For the cancer patients, mapping of plasma DNA copy number aberrations was performed only in cases with aberrations affecting at least one contiguous chromosome region of at least 30 Mb so that a sufficient number of methylation markers could be used for mapping.
Fetal DNA Fraction by Fetal-Specific SNP Alleles Analysis.
For the first trimester pregnancy cases, chorionic villus samples were obtained. For the second trimester pregnancy cases, amniotic fluid samples were obtained. For the third trimester cases, the placentas were obtained after delivery. For each case, the genotypes of the chorionic villus samples, amniotic fluid samples or the placentas were compared with those of the mothers to identify paternally-inherited SNP alleles possessed by the fetus but not by the mother, i.e., the fetal-specific SNP alleles. The ratio between the number of the fetal-specific SNP alleles in the plasma sample and the number of SNP alleles shared by the fetus and the mother was used to deduce the fetal DNA fraction in the plasma sample as previously described (30).
Copy Number Aberrations Identification in Plasma.
The human genome was partitioned into ∼3,000 nonoverlapping 1-Mb bins (11). The number of reads mapping to each 1-Mb bin was determined. After correcting for GC bias (48), the sequence read density of each bin was calculated. For each bin, the sequenced read density of the test case was compared with the values of the reference control subjects. Copy number gains and losses were defined as 3 SDs above and below, respectively, the mean of the controls.
GAAL Analysis.
Tumor samples of 14 HCC cases were analyzed using the Affymetrix Genome-Wide Human SNP Array 6.0 system and massively parallel sequencing. Regions exhibiting loss of heterozygosity (LOH) were identified as previously described (11). The fractional concentrations of tumor-derived DNA in plasma were determined by analyzing, in a genome-wide manner, the allelic counts for SNPs exhibiting LOH in the plasma sequencing data using the following equation:
where Nnon-del represents the number of sequenced reads carrying the nondeleted alleles in the tumor tissues, and Ndel represents the number of sequenced reads carrying the deleted alleles in the tumor tissues.
Statistical Analysis.
Sequencing data analysis was performed by using bioinformatics programs written in Perl and R languages. P < 0.05 was considered as statistically significant, and all probabilities were two-tailed.
Supplementary Material
Acknowledgments
We thank Lisa Chan, Yongjie Jin, Wing Shan Lee, Sze Wan Yeung, and Xiaoxi Su for technical assistance. This work was supported by the Hong Kong Research Grants Council Theme-Based Research Scheme (T12-404/11), the University Grants Committee Areas of Excellence Scheme (AoE/M-04/06), the S. K. Yee Foundation, and the Innovation and Technology Fund under the State Key Laboratory Programme. Y.M.D.L. is supported by an endowed chair from the Li Ka Shing Foundation.
Footnotes
The authors declare no conflict of interest.
Data deposition: Sequence data for the subjects studied in this work who consented to data archiving have been deposited in the European Genome-Phenome Archive (EGA), www.ebi.ac.uk/ega/, hosted by the European Bioinformatics Institute (accession no. EGAS00001001219).
This article contains supporting information online at www.pnas.org/lookup/suppl/doi:10.1073/pnas.1508736112/-/DCSupplemental.
References
- 1.Lo YMD, et al. Presence of fetal DNA in maternal plasma and serum. Lancet. 1997;350(9076):485–487. doi: 10.1016/S0140-6736(97)02174-0. [DOI] [PubMed] [Google Scholar]
- 2.Chiu RWK, et al. Noninvasive prenatal diagnosis of fetal chromosomal aneuploidy by massively parallel genomic sequencing of DNA in maternal plasma. Proc Natl Acad Sci USA. 2008;105(51):20458–20463. doi: 10.1073/pnas.0810641105. [DOI] [PMC free article] [PubMed] [Google Scholar]
- 3.New MI, et al. Noninvasive prenatal diagnosis of congenital adrenal hyperplasia using cell-free fetal DNA in maternal plasma. J Clin Endocrinol Metab. 2014;99(6):E1022–E1030. doi: 10.1210/jc.2014-1118. [DOI] [PMC free article] [PubMed] [Google Scholar]
- 4.Bianchi DW, et al. CARE Study Group DNA sequencing versus standard prenatal aneuploidy screening. N Engl J Med. 2014;370(9):799–808. doi: 10.1056/NEJMoa1311037. [DOI] [PubMed] [Google Scholar]
- 5.Chiu RWK, et al. Non-invasive prenatal assessment of trisomy 21 by multiplexed maternal plasma DNA sequencing: Large scale validity study. BMJ. 2011;342:c7401. doi: 10.1136/bmj.c7401. [DOI] [PMC free article] [PubMed] [Google Scholar]
- 6.Clausen FB. Integration of noninvasive prenatal prediction of fetal blood group into clinical prenatal care. Prenat Diagn. 2014;34(5):409–415. doi: 10.1002/pd.4326. [DOI] [PubMed] [Google Scholar]
- 7.Bayindir B, et al. Noninvasive prenatal testing using a novel analysis pipeline to screen for all autosomal fetal aneuploidies improves pregnancy management. Eur J Hum Genet. 2015 doi: 10.1038/ejhg.2014.282. [DOI] [PMC free article] [PubMed] [Google Scholar]
- 8.Lo YMD, et al. Quantitative analysis of cell-free Epstein-Barr virus DNA in plasma of patients with nasopharyngeal carcinoma. Cancer Res. 1999;59(6):1188–1191. [PubMed] [Google Scholar]
- 9.Yung TKF, et al. Single-molecule detection of epidermal growth factor receptor mutations in plasma by microfluidics digital PCR in non-small cell lung cancer patients. Clin Cancer Res. 2009;15(6):2076–2084. doi: 10.1158/1078-0432.CCR-08-2622. [DOI] [PubMed] [Google Scholar]
- 10.Leary RJ, et al. Detection of chromosomal alterations in the circulation of cancer patients with whole-genome sequencing. Sci Transl Med. 2012;4(162):162ra154. doi: 10.1126/scitranslmed.3004742. [DOI] [PMC free article] [PubMed] [Google Scholar]
- 11.Chan KCA, et al. Cancer genome scanning in plasma: Detection of tumor-associated copy number aberrations, single-nucleotide variants, and tumoral heterogeneity by massively parallel sequencing. Clin Chem. 2013;59(1):211–224. doi: 10.1373/clinchem.2012.196014. [DOI] [PubMed] [Google Scholar]
- 12.Murtaza M, et al. Non-invasive analysis of acquired resistance to cancer therapy by sequencing of plasma DNA. Nature. 2013;497(7447):108–112. doi: 10.1038/nature12065. [DOI] [PubMed] [Google Scholar]
- 13.Lo YMD, et al. Presence of donor-specific DNA in plasma of kidney and liver-transplant recipients. Lancet. 1998;351(9112):1329–1330. doi: 10.1016/s0140-6736(05)79055-3. [DOI] [PubMed] [Google Scholar]
- 14.Snyder TM, Khush KK, Valantine HA, Quake SR. Universal noninvasive detection of solid organ transplant rejection. Proc Natl Acad Sci USA. 2011;108(15):6229–6234. doi: 10.1073/pnas.1013924108. [DOI] [PMC free article] [PubMed] [Google Scholar]
- 15.Masuzaki H, et al. Detection of cell free placental DNA in maternal plasma: Direct evidence from three cases of confined placental mosaicism. J Med Genet. 2004;41(4):289–292. doi: 10.1136/jmg.2003.015784. [DOI] [PMC free article] [PubMed] [Google Scholar]
- 16.Chen C, et al. A pregnancy with discordant fetal and placental chromosome 18 aneuploidies revealed by invasive and noninvasive prenatal diagnosis. Reprod Biomed Online. 2014;29(1):136–139. doi: 10.1016/j.rbmo.2014.03.017. [DOI] [PubMed] [Google Scholar]
- 17.Bettegowda C, et al. Detection of circulating tumor DNA in early- and late-stage human malignancies. Sci Transl Med. 2014;6(224):224ra24. doi: 10.1126/scitranslmed.3007094. [DOI] [PMC free article] [PubMed] [Google Scholar]
- 18.Lui YYN, et al. Predominant hematopoietic origin of cell-free DNA in plasma and serum after sex-mismatched bone marrow transplantation. Clin Chem. 2002;48(3):421–427. [PubMed] [Google Scholar]
- 19.Zheng YW, et al. Nonhematopoietically derived DNA is shorter than hematopoietically derived DNA in plasma: A transplantation model. Clin Chem. 2012;58(3):549–558. doi: 10.1373/clinchem.2011.169318. [DOI] [PubMed] [Google Scholar]
- 20.Fernandez AF, et al. A DNA methylation fingerprint of 1628 human samples. Genome Res. 2012;22(2):407–419. doi: 10.1101/gr.119867.110. [DOI] [PMC free article] [PubMed] [Google Scholar]
- 21.Kundaje A, et al. Roadmap Epigenomics Consortium Integrative analysis of 111 reference human epigenomes. Nature. 2015;518(7539):317–330. doi: 10.1038/nature14248. [DOI] [PMC free article] [PubMed] [Google Scholar]
- 22.Houseman EA, et al. DNA methylation arrays as surrogate measures of cell mixture distribution. BMC Bioinformatics. 2012;13:86. doi: 10.1186/1471-2105-13-86. [DOI] [PMC free article] [PubMed] [Google Scholar]
- 23.Chim SSC, et al. Detection of the placental epigenetic signature of the maspin gene in maternal plasma. Proc Natl Acad Sci USA. 2005;102(41):14753–14758. doi: 10.1073/pnas.0503335102. [DOI] [PMC free article] [PubMed] [Google Scholar]
- 24.Lun FMF, et al. Noninvasive prenatal methylomic analysis by genomewide bisulfite sequencing of maternal plasma DNA. Clin Chem. 2013;59(11):1583–1594. doi: 10.1373/clinchem.2013.212274. [DOI] [PubMed] [Google Scholar]
- 25.Ou X, et al. Epigenome-wide DNA methylation assay reveals placental epigenetic markers for noninvasive fetal single-nucleotide polymorphism genotyping in maternal plasma. Transfusion. 2014;54(10):2523–2533. doi: 10.1111/trf.12659. [DOI] [PubMed] [Google Scholar]
- 26.Jensen TJ, et al. Whole genome bisulfite sequencing of cell-free DNA and its cellular contributors uncovers placenta hypomethylated domains. Genome Biol. 2015;16(1):78. doi: 10.1186/s13059-015-0645-x. [DOI] [PMC free article] [PubMed] [Google Scholar]
- 27.Wong IH, et al. Detection of aberrant p16 methylation in the plasma and serum of liver cancer patients. Cancer Res. 1999;59(1):71–73. [PubMed] [Google Scholar]
- 28.Chan KCA, et al. Noninvasive detection of cancer-associated genome-wide hypomethylation and copy number aberrations by plasma DNA bisulfite sequencing. Proc Natl Acad Sci USA. 2013;110(47):18761–18768. doi: 10.1073/pnas.1313995110. [DOI] [PMC free article] [PubMed] [Google Scholar]
- 29.Hodges E, et al. Directional DNA methylation changes and complex intermediate states accompany lineage specificity in the adult hematopoietic compartment. Mol Cell. 2011;44(1):17–28. doi: 10.1016/j.molcel.2011.08.026. [DOI] [PMC free article] [PubMed] [Google Scholar]
- 30.Lo YMD, et al. Maternal plasma DNA sequencing reveals the genome-wide genetic and mutational profile of the fetus. Sci Transl Med. 2010;2(61):61ra91. doi: 10.1126/scitranslmed.3001720. [DOI] [PubMed] [Google Scholar]
- 31.Norton ME, et al. Cell-free DNA analysis for noninvasive examination of trisomy. N Engl J Med. 2015;372(17):1589–1597. doi: 10.1056/NEJMoa1407349. [DOI] [PubMed] [Google Scholar]
- 32.Heitzer E, et al. Establishment of tumor-specific copy number alterations from plasma DNA of patients with cancer. Int J Cancer. 2013;133(2):346–356. doi: 10.1002/ijc.28030. [DOI] [PMC free article] [PubMed] [Google Scholar]
- 33.Yu SCY, et al. Noninvasive prenatal molecular karyotyping from maternal plasma. PLoS One. 2013;8(4):e60968. doi: 10.1371/journal.pone.0060968. [DOI] [PMC free article] [PubMed] [Google Scholar]
- 34.De Vlaminck I, et al. Circulating cell-free DNA enables noninvasive diagnosis of heart transplant rejection. Sci Transl Med. 2014;6(241):241ra77. doi: 10.1126/scitranslmed.3007803. [DOI] [PMC free article] [PubMed] [Google Scholar]
- 35.Bianchi DW, et al. Noninvasive prenatal testing and incidental detection of occult maternal malignancies. JAMA. 2015;314(2):162–169. doi: 10.1001/jama.2015.7120. [DOI] [PubMed] [Google Scholar]
- 36.Amant F, et al. Presymptomatic identification of cancers in pregnant women during noninvasive prenatal testing. JAMA Oncol. 2015 doi: 10.1001/jamaoncol.2015.1883. [DOI] [PubMed] [Google Scholar]
- 37.Laszlo AH, et al. Detection and mapping of 5-methylcytosine and 5-hydroxymethylcytosine with nanopore MspA. Proc Natl Acad Sci USA. 2013;110(47):18904–18909. doi: 10.1073/pnas.1310240110. [DOI] [PMC free article] [PubMed] [Google Scholar]
- 38.Cheng SH, et al. Noninvasive prenatal testing by nanopore sequencing of maternal plasma DNA: Feasibility assessment. Clin Chem. 2015;61(1):172–181. doi: 10.1373/clinchem.2015.245076. [DOI] [PubMed] [Google Scholar]
- 39.Ng EKO, et al. mRNA of placental origin is readily detectable in maternal plasma. Proc Natl Acad Sci USA. 2003;100(8):4748–4753. doi: 10.1073/pnas.0637450100. [DOI] [PMC free article] [PubMed] [Google Scholar]
- 40.Tsui NBY, et al. Maternal plasma RNA sequencing for genome-wide transcriptomic profiling and identification of pregnancy-associated transcripts. Clin Chem. 2014;60(7):954–962. doi: 10.1373/clinchem.2014.221648. [DOI] [PubMed] [Google Scholar]
- 41.Koh W, et al. Noninvasive in vivo monitoring of tissue-specific global gene expression in humans. Proc Natl Acad Sci USA. 2014;111(20):7361–7366. doi: 10.1073/pnas.1405528111. [DOI] [PMC free article] [PubMed] [Google Scholar]
- 42.Chim SSC, et al. Detection and characterization of placental microRNAs in maternal plasma. Clin Chem. 2008;54(3):482–490. doi: 10.1373/clinchem.2007.097972. [DOI] [PubMed] [Google Scholar]
- 43.Wang K, et al. Circulating microRNAs, potential biomarkers for drug-induced liver injury. Proc Natl Acad Sci USA. 2009;106(11):4402–4407. doi: 10.1073/pnas.0813371106. [DOI] [PMC free article] [PubMed] [Google Scholar]
- 44.Jiang P, et al. Methy-Pipe: An integrated bioinformatics pipeline for whole genome bisulfite sequencing data analysis. PLoS One. 2014;9(6):e100360. doi: 10.1371/journal.pone.0100360. [DOI] [PMC free article] [PubMed] [Google Scholar]
- 45.Kent WJ, et al. The human genome browser at UCSC. Genome Res. 2002;12(6):996–1006. doi: 10.1101/gr.229102. [DOI] [PMC free article] [PubMed] [Google Scholar]
- 46.Irizarry RA, et al. The human colon cancer methylome shows similar hypo- and hypermethylation at conserved tissue-specific CpG island shores. Nat Genet. 2009;41(2):178–186. doi: 10.1038/ng.298. [DOI] [PMC free article] [PubMed] [Google Scholar]
- 47.van den Meersche K, Soetaert K, van Oevelen D. An R function for sampling linear inverse problems. J Stat Softw. 2009;30:1–15. [Google Scholar]
- 48.Chen EZ, et al. Noninvasive prenatal diagnosis of fetal trisomy 18 and trisomy 13 by maternal plasma DNA sequencing. PLoS One. 2011;6(7):e21791. doi: 10.1371/journal.pone.0021791. [DOI] [PMC free article] [PubMed] [Google Scholar]
Associated Data
This section collects any data citations, data availability statements, or supplementary materials included in this article.


