Significance
Women remain underrepresented in academia as they continue to face a leadership gap, salary gap, and funding gap. Closing the funding gap is of particular importance, because this may directly retain women in academia and foster the closing of other gaps. In this study, we examined the grant funding rates of a national full population of early career scientists. Our results reveal gender bias favoring male applicants over female applicants in the prioritization of their “quality of researcher” (but not “quality of proposal”) evaluations and success rates, as well as in the language use in instructional and evaluation materials. This work illuminates how and when the funding gap and the subsequent underrepresentation of women in academia are perpetuated.
Keywords: gender bias, research funding, success rates, academia, STEM
Abstract
We examined the application and review materials of three calls (n = 2,823) of a prestigious grant for personal research funding in a national full population of early career scientists awarded by the Netherlands Organization for Scientific Research (NWO). Results showed evidence of gender bias in application evaluations and success rates, as well as in language use in instructions and evaluation sheets. Male applicants received significantly more competitive “quality of researcher” evaluations (but not “quality of proposal” evaluations) and had significantly higher application success rates than female applicants. Gender disparities were most prevalent in scientific disciplines with the highest number of applications and with equal gender distribution among the applicants (i.e., life sciences and social sciences). Moreover, content analyses of the instructional and evaluation materials revealed the use of gendered language favoring male applicants. Overall, our data reveal a 4% “loss” of women during the grant review procedure, and illustrate the perpetuation of the funding gap, which contributes to the underrepresentation of women in academia.
Women are still underrepresented in academia today. Despite various attempts to promote gender equality (e.g., affirmative action initiatives, quotas), female scientists are less likely to get offered tenure, are judged to be less competent, receive less payment and research facilities, and are less likely to be awarded research grants compared with male scientists (1–3). Over time, this type of bias accumulates and contributes to the attrition of women from academia (4); the academic pipeline leaks. Here we report evidence of gender bias in personal research funding for early career scientists.
The importance of equal gender representation is widely acknowledged, for several reasons. First, it can resolve historic inequalities and provide equal opportunities (the “moral case for diversity”) (5, 6). Second, research has demonstrated that gender diversity in organizations can boost innovation and creativity, expand target groups, and increase productivity (the “business case for diversity”) (7, 8), either directly or indirectly through decision making processes or reputation, and provided that the organizational culture is open to change (9–12). This is true for academia as well. Gender-diverse research teams facilitate innovation and excellence in research and policy, address different research questions and methods, and facilitate wider application of research findings (13), thereby contributing to scientific progress.
Relevant statistics, however, show a persistent leadership gap, salary gap, and funding gap for women in academia (3). To illustrate, The Netherlands—generally considered a high-equity nation—had only 16% female full professors in 2012 (14). Leadership is stereotyped as masculine and consequently associated more strongly with stereotypical male traits rather than female traits. Although women are equally effective in, and equally likely to use optimal leadership styles, as men (15, 16), women continue to be devalued as leaders due to the influence of gender stereotypes on judgment (17). Overall, science also is more implicitly associated with men than with women, because gender stereotypes characterize women as lacking the masculine traits associated with ability and success in science (18, 19). For instance, a recent study linked the level of women’s underrepresentation across academic disciplines to the magnitude of the stereotype-based assumption that innate talent is associated with male traits and considered necessary for academic career success (20). Moreover, women still earn on average 18% less than their male colleagues for the same work with similar responsibilities (3). Although the salary gap seems to narrow for early career researchers, women in top academic positions are still substantially underpaid compared with men. Finally, across different career phases, success rates for female scientists applying for research funding tend to be lower than for male scientists (3, 21, 22). Even when overall success rates for men and women are equal, women receive less research funding than men, and are less often listed as principal investigators (23–25). Closing the funding gap is of particular importance, because this may help retain women in academia and foster the closing of other gaps by facilitating negotiations about salaries, research facilities, and promotion opportunities.
Current Study
To investigate the possibility of a funding gap, we examined a national full population of early career researchers who applied for a prestigious personal grant between 2010 and 2012 (Innovational Research Incentives Scheme Veni; n = 2,823, with 42.1% female applicants) awarded by the Netherlands Organization for Scientific Research (NWO). The NWO made available anonymized data from their archives for the purpose of this study, and approved publication of this research.
Our focus in this study was twofold. First, we tested for applicant gender differences in success rates and application evaluations. In doing so, we analyzed applicant gender as a statistical predictor of final success rates and also the success rates at each step in the review procedure (application, preselection, external reviewing,* interviews, and grant awards), as well as a predictor of committee evaluations for each assessment criterion (quality of researcher, quality of proposal, and knowledge utilization). Second, we examined the use of gendered language by content analyzing the instructional and evaluation materials. Together these data can provide evidence of the extent to which stereotype-based evaluations of male and female applicants resulting in differential awarding rates may contribute to the funding gap.
Application Evaluations and Success Rates
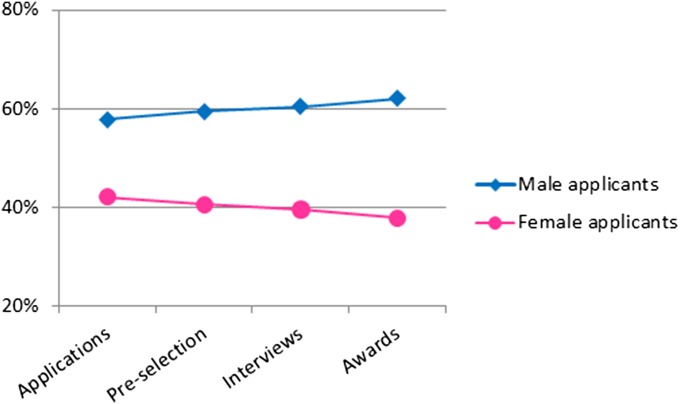
Of the total population of 2,823 applications examined, 467 were awarded, resulting in an overall success rate of 16.5%. The success rate was systematically lower for female applicants than for male applicants [14.9% vs. 17.7%; χ2(1) = 4.01, P = 0.045, Cramer’s V = 0.04] (Table S1). Examination of success rates at each step in the review procedure revealed a similar pattern; women accounted for 42.1% of the applicants, but their success rates declined at every step in the review procedure, whereas success rates for men increased during the review procedure (Fig. 1). A direct comparison of the proportion of women among the applicants (42.1%) and that among the grant awardees (37.9%) revealed a “loss” of ∼4% women during the grant review procedure.
Table S1.
Numbers of applications and awarded grants, along with success rates for male and female applicants, by scientific discipline
| Discipline | Applications, n | Awards, n | Success rates, % | ||||||
| Total | Men | Women | Total | Men | Women | Total | Men | Women | |
| Total | 2,823 | 1,635 | 1,188 | 467 | 290 | 177 | 16.5 | 17.7a | 14.9b |
| Chemical sciences | 122 | 83 | 39 | 32 | 22 | 10 | 26.2 | 26.5a | 25.6a |
| Physical sciences | 174 | 135 | 39 | 35 | 26 | 9 | 20.1 | 19.3a | 23.1a |
| Physics | 76 | 67 | 9 | 20 | 18 | 2 | 26.3 | 26.9a | 22.2a |
| Humanities | 396 | 230 | 166 | 65 | 33 | 32 | 16.4 | 14.3a | 19.3a |
| Technical sciences | 251 | 189 | 62 | 43 | 30 | 13 | 17.1 | 15.9a | 21.0a |
| Interdisciplinary | 183 | 105 | 78 | 29 | 12 | 17 | 15.8 | 11.4a | 21.8a |
| Earth/life sciences | 282 | 156 | 126 | 56 | 38 | 18 | 19.9 | 24.4a | 14.3b |
| Social sciences | 834 | 425 | 409 | 112 | 65 | 47 | 13.4 | 15.3a | 11.5a |
| Medical sciences | 505 | 245 | 260 | 75 | 46 | 29 | 14.9 | 18.8a | 11.2b |
Success rates for male and female applicants with different subscripts differ reliably from one another (P < 0.05).
Fig. 1.
Success rates for male and female applicants for each phase in the grant review procedure.
We also examined the numbers of applications and success rates for reappliers, that is, applicants who applied to the same grant scheme for a second time.† Women were just as likely as men to submit a reapplication [22.6% vs. 20.9%; χ2 (1) = 0.39, P = 0.53, Cramer’s V = 0.02]. The average overall success rate for reappliers were substantially higher than those for first time appliers [23.6% vs. 13.9%; χ2 (1) = 11.10, P = 0.001, Cramer’s V = 0.11], indicating that reapplying generally is beneficial. However, disentangling success rates for men and women who applied for the first versus a second time revealed that success rates for female first time appliers were considerably lower than those for male first time appliers [10.8% vs. 16.1%; χ2 (1) = 4.06, P = 0.04, Cramer’s V = 0.075]. Success rates for both men and women increased for reapplications (resulting in equal success rates for male and female reappliers), although the increase was more substantial for women (Table S2).
Table S2.
Numbers of applications and awarded grants, along with success rates for male and female applicants, by first-time applications vs. reapplications in one call, 2012
| Category | Applications, n | Awards, n | Success rates, % | ||||||
| Total | Men | Women | Total | Men | Women | Total | Men | Women | |
| Total | 921 | 527 | 394 | 147 | 93 | 54 | 16.0 | 17.6i | 13.7i |
| First-time applications | 722 | 417 | 305 | 100 | 67 | 33 | 13.9i | 16.1a | 10.8b |
| Reapplications | 199 | 110 | 89 | 47 | 26 | 21 | 23.6j | 23.6ac | 23.6c |
Success rates for male and female applicants with different subscripts per row and column differ reliably from one another (P < 0.05).
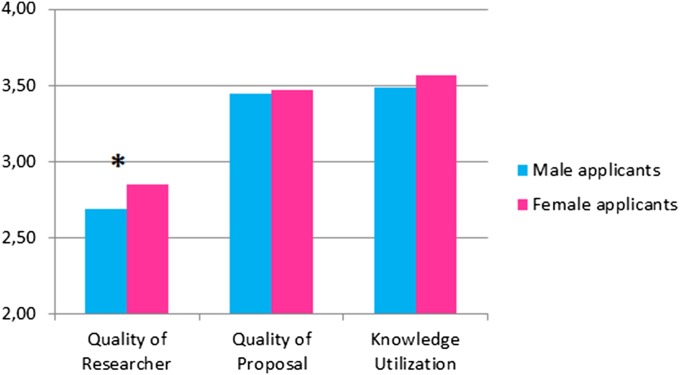
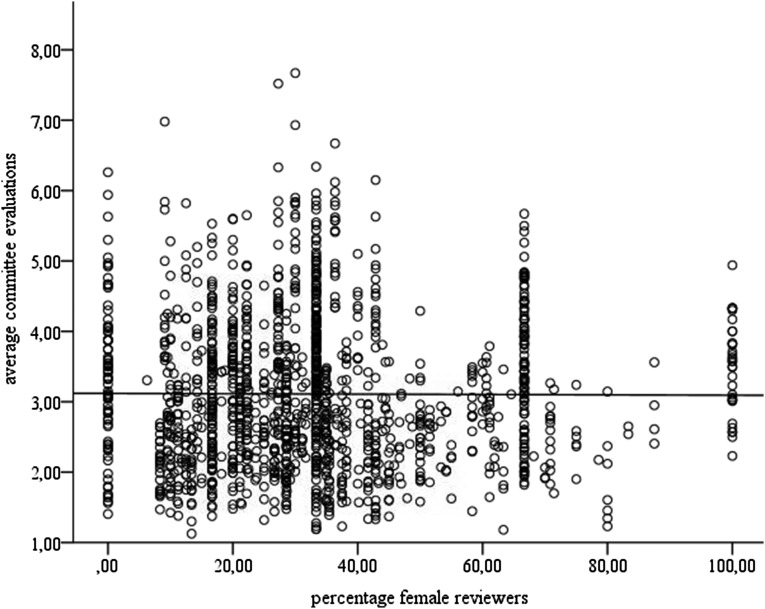
To gain further insight in the processes that might account for these skewed success rates, we next assessed the different committee evaluations that were made. Throughout the review procedure, women received less favorable evaluations than men. That is, women were less likely to be prioritized in preselection recommendations as well as committee-evaluations after the interviews.‡ During the preselection phase, reviewers rated applicants with one overall score indicating their potential for funding success. Analyses of the standardized preselection recommendations indicated that women were less likely to be prioritized than men [z = 0.07 vs. −0.05; F(1, 2388) = 7.94, P = 0.01, = 0.003]. In the interview phase, applicants were evaluated on three assessment criteria.§ Analyses of the evaluations for each of these assessment criteria revealed that women were less likely to be prioritized (mean = 2.85, SD = 1.09) for their “quality of researcher” than men [mean = 2.69, SD = 1.02; F(1, 1276) = 7.36; P = 0.007; = 0.006]. Importantly, no such differences between male and female applicants were observed for evaluations of “quality of proposal” [F(1, 1276) = 0.13, P = 0.72, < 0.001] and “knowledge utilization” [F(1, 1276) = 1.53, P = 0.22, = 0.001], indicating that the research proposals submitted by women were seen as equally innovative and relevant as those of men (Fig. 2).** We were able to rule out that these evaluations were due to unequal gender representation in the review committee. On average, committees contained 32.6% female reviewers; the gender composition of the review committee was unrelated to application evaluations and success rates for male and female applicants (26, 27) (SI Text and Fig. S1).
Fig. 2.
Committee evaluations during the interview phase for male and female applicants for each evaluation criterion.
Fig. S1.
Scatterplot with the average committee evaluations of applicants as a function of the share of female reviewers.
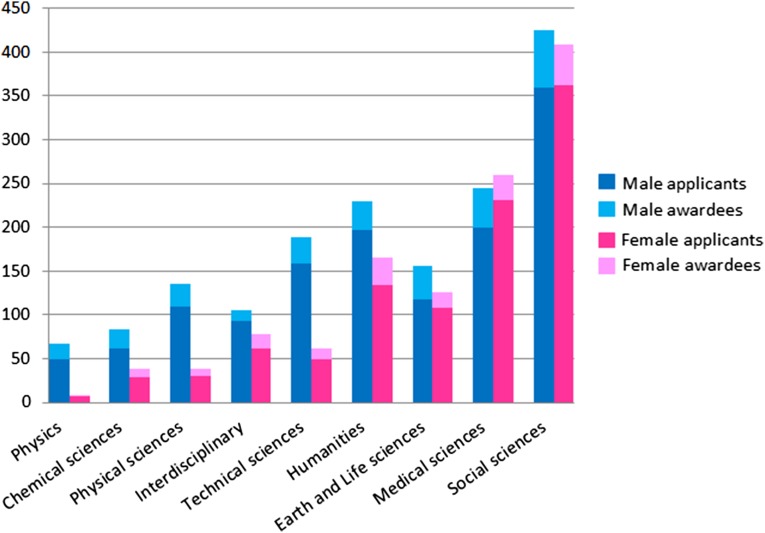
To explore differences between scientific disciplines, we ran similar analyses comparing the scientific disciplines distinguished by the NWO. The differences in success rates, as well as in the committee evaluations, of male and female applicants described above were most pronounced in the life sciences and social sciences (e.g., medicine, psychology) (Fig. 3 and Table S1). These disciplines received a relatively high number of applications and also showed an equal gender distribution among the applicants. In comparison, scientific disciplines in which gender differences in success rates were less clearly visible (e.g., physics, mathematics) received a relatively low number of applications, of which only a few were submitted by women. In these fields, success rates and committee evaluations did not differ between men and women. This finding is in line with the distinction in science, technology, engineering, and mathematics (STEM) disciplines between math-intensive fields [geoscience, engineering, economics, mathematics/computer science, and physical sciences (GEEMP)] and non–math-intensive fields [life science, psychology, and social science (LPS)], showing that the pipeline leakage for women is most prevalent in the LPS disciplines (24).
Fig. 3.
Numbers of applications and grants awarded for men and women for each of the scientific disciplines.
Language Use in Instructional and Evaluation Materials
In addition to analyzing application evaluations and success rates for men and women, we also content-analyzed the language use in instructional and evaluation materials. Because gendered language can impact the motivation of applicants (28–30) as well as their evaluation by others (31–34), it is important to assess the extent to which funding agencies rely on gendered language in their review procedures. To examine this, we content-coded the materials for the presence of three indicators of gendered language: explicit references to the NWO’s gender policy, gender-exclusive language, and gendered wording.
We coded a total of 86 documents containing all written communications related to the application and review procedure in the years 2010–2012. These written communications contained both Dutch and English documents; we found no effect of language, because these were direct translations. The documents included grant calls, application information on the website, and evaluation sheets and instructions for committee members. Because the review procedure and instructions were similar across scientific disciplines and communications were generally standardized, the content-coded materials pertained to all scientific disciplines; however, we distinguished between different target groups addressed by the communications in the review procedure. That is, we compared gendered language use in written communications aimed at applicants, external reviewers, and committee members (preselection advisors as well as interview committees).
The NWO’s gender policy was widely disseminated; 38.4% of all written communications contained references to its gender policy. There were major differences in the extent to which these references were included in the communications aimed at the target groups, however [χ2 (2) = 11.24, P = 0.004, Cramer’s V = 0.36]. References to the NWO’s gender policy were most prevalent in the written communications directed at committee members (49.2%), where, for example, it was explicitly stated that “the board of NWO has decided that the disciplines have to specifically consider the selection of female applicants, conform the general policy of NWO. For the Veni procedure, this means that the percentage of female applicants that are selected needs to be equal to the percentage of female applicants that submit a proposal.” References to this gender policy also were included in the written communications directed at applicants, albeit less often (26.7%); however, none of the written communications directed at external reviewers included references to the NWO’s gender policy.
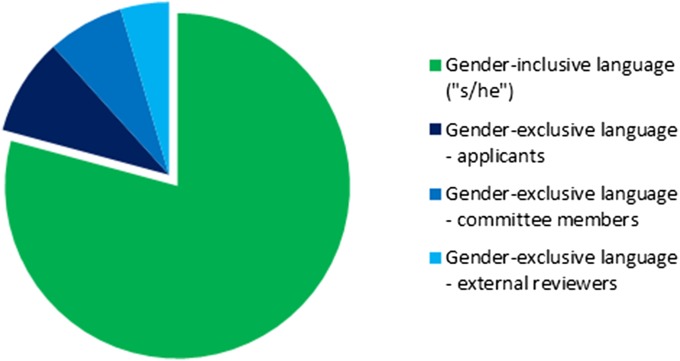
We next coded the written communications for the occurrence of gender-exclusive language††; that is, instances in which pronouns exclusively referred to one gender (e.g., “he”) rather than more inclusive forms that referred to both genders (e.g., “he/she” or “they”) (28). Gender-inclusive language was used in 79.2% of instances in which such pronouns appeared; however, the 20.8% of cases where gender-exclusive language was used always consisted of exclusive references to men (e.g., “man-years of research,” “among the best 10–20% of his population”) and never referred to women [t(52) = 3.67, P = 0.001, d = 1.02]. Written communications directed at applicants contained statistically equal instances of gender-exclusive language as documents directed at committee members and external reviewers [9.1% vs. 7.2% vs. 4.5%; F(2, 50) = 2.43, P = 0.10, ηp2 = 0.09] (Fig. 4).
Fig. 4.
The occurrence (in %) of gender-inclusive language (“she/he”) and masculine gender-exclusive language (“he”) in instructional and evaluation materials aimed at applicants, committee members, and external reviewers.
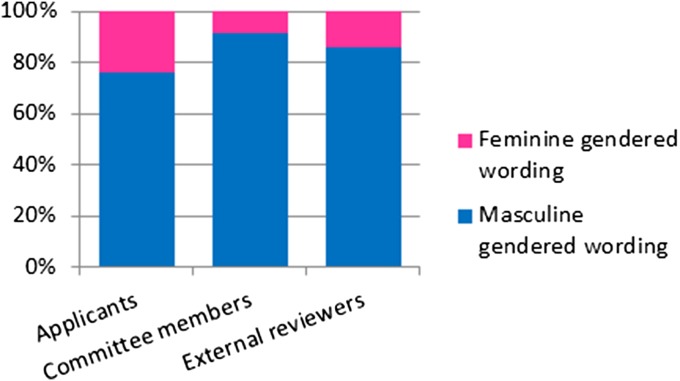
We then coded the written communications for gendered wording. This implies that words that were used in these communications have been identified in research as referring to gender stereotypes (29, 31). For example, masculine-gendered words included “challenging,” “independent,” and “adventurous,” whereas feminine-gendered words included “responsible,” “organized,” and “thorough.” In the instances where gendered wording occurred (0.66% of the total number of words, which is similar to the previously documented occurrence of gendered wording in job advertisements) (29), 86.2% were masculine-gendered and 13.8% were feminine-gendered [t(85) = 7.55, P < 0.001, d = 1.64]. The difference was most pronounced in written communications directed at committee members, but also was observed in the written communications aimed at external reviewers and applicants [masculine-gendered wording: 91.8% vs. 85.9% vs. 76.2%; F(2, 83) = 5.38, P = 0.006, ηp2 = 0.115] (Fig. 5). Importantly, the prevalence of masculine-gendered wording was most clearly visible in the main evaluation criteria and requirements (e.g., “The target group for the scheme consists of outstanding individuals of exceptional talent and originality who have a great enthusiasm for the conduct of challenging, ground-breaking research. In view of the purpose of the scheme, it is obviously essential that candidates should have the ability to formulate and conduct a research programme independently.”). Feminine wording was only used when describing the NWO’s gender policy (e.g., “The maximum period of 3 years may also be relaxed if the candidate has a part-time research appointment with care responsibilities.”) or as a secondary evaluation criterion (e.g., “Aspects such as management experience, valorization, and organizational experience are also important, as well as cooperation with international research teams and coordination of international activities such as conferences.”).
Fig. 5.
The occurrence of gendered wording in instructional and evaluation materials aimed at applicants, committee members, and external reviewers.
The results of these content analyses revealed that the NWO’s gender policy was widely disseminated (in approximately 50% of all written communications to committee members); however, this was not supported by the language use in the instructional and evaluation materials. The written communications contained both gender-exclusive language and gendered wording favoring male applicants over female applicants. Importantly, this was mainly the case for descriptions specifying the main evaluation criteria, as communicated to both applicants and reviewers. When gendered language did favor women, this was directly related to explanations of the NWO’s gender policy or the descriptions of additional, secondary requirements.
Discussion and Conclusion
The data reported herein provide compelling evidence of gender bias in personal grant applications to obtain research funding. Our results reveal an uneven distribution in the success rates of men and women; the share of female grant awardees was smaller than what would be expected based on the share of female applicants. Gender disparities were visible in committee evaluations of the applicants, specifically in the prioritization of applicants’ quality as a researcher (but not the quality of their research proposals), and in language use in instructions and evaluation sheets. In addition, systematically lower success rates were observed for female applicants compared with male applicants. Because applicants’ track record data were not available for analysis, we cannot conclusively rule out the possibility that gender disparities in productivity resulted in differential evaluations of male and female applicants; however, this unlikely to be the case, given that productivity (i.e., number of publications and citations) of male and female early career scientists in The Netherlands are comparable (35), or can be explained by other factors, such as time allocation and available resources (24). In addition, our data reveal that the proposals of male and female applicants were evaluated as equally competitive, indicating similar research ability.
Gender disparities were most pronounced in scientific disciplines in which female applicants were more visibly present and larger numbers of applications had to be processed (i.e., life sciences and social sciences). This corroborates previously reported evidence that especially women in LPS fields face more difficulties than men in advancing their academic career path (24). Although our data reflect a national full population, the results and insights revealed speak to the broader issue of women’s underrepresentation in academia and are highly relevant to other scientific funding agencies. For example, a comparable analysis of personal research funding success rates for early career scientists across Europe (n = 17,951 in the years 2007–2011) revealed a similar ‘loss’ of 5% of women in the grant review procedure of the highly prestigious European Research Council (ERC) Starting Grant (21).
Although direct comparisons of funding rates of scientific agencies are rather difficult due to variations in grant types and review procedures (36), at least one feature of the review procedure seems particularly prone to gender bias: researchers’ track records. In our data as well as in the ERC Starting Grant review procedure, an important evaluation criterion is the “scientific excellence of the researcher.” Both grant schemes reveal gender disparity in funding rates. At the same time, funding rates of the National Institutes of Health’s (NIH) R01 new awards—where reviewers are requested to focus on the quality of the proposal alone—show no gender bias. The situation is different for the NIH’s R01 renewal awards; here researchers’ track records are heavily weighted in the review process, and gender disparity is present in application and funding rates disadvantaging women (37, 38). Because the track record of applicants tends to be viewed as a key criterion for personal grant schemes, these awards seem particularly prone to gender bias. The introduction of review procedures with an exclusive focus on the research proposal constitutes a promising avenue to eliminate gender bias in awarding decisions.
The grant review procedure for personal research funding as examined in the present study highlights bias-enhancing conditions (2). First, particularly in the scientific disciplines with larger numbers of applications, it is more difficult for reviewers to thoroughly process the available information and carefully weigh all of the applications. This increases the likelihood of relying on heuristics, which has been related to the emergence of implicit biases (19, 39). Second, repeated emphasis on gender policy endorsing the advancement of women while observing an equal gender distribution among the applicants might have misled reviewers into thinking that gender bias is no longer an issue. This “paradox of equality” has been documented to make people less vigilant for unequal outcomes and can actually enhance biased evaluations (40, 41). Third, the use of masculine-gendered language in both instructions and evaluation sheets might have benefitted the evaluations of male applicants, given that their stereotypical qualities provide a more natural match with the way in which requirements are specified (31, 33). Although our current data do not allow for a direct test of the effect of gendered language on gender disparities in awarding rates, our findings resonate with previous work demonstrating the effect of gendered language in tenure criteria on women’s academic advancement (34). Skewed evaluations are documented as being most visible in ratings regarding the perceived competencies of men and women, which matches our findings with respect to the “quality of researcher” ratings (22, 42, 43). Circumstances such as these facilitate rather than diminish the effects of (implicit) gender stereotypes and biases, even in high–gender-equity nations. This sustains the funding gap, which contributes to perpetuation of the underrepresentation and divergent resources offered to women in academia.
SI Text
Given that the gender composition of the review committee might affect the chances of female applicants to obtain grant funding, we examined the role of the share of female reviewers on the success rates and committee evaluations of male and female applicants.
Preselection advisors.
On average, 3.4 reviewers rated the applications in the preselection phase; 34.9% of the preselection advisors were women. A simple regression analysis demonstrated that the percentage of female preselection advisors was not associated with the average preselection advice for applicants [β = −0.03, R2 = 0.03, F(1, 2387) = 1.97, P = 0.16]. In addition, a binary logistic regression analysis showed that the main effect of the percentage of female preselection advisors on the success rates of applicants in the preselection phase was nonsignificant [B = 0.001, SE = 0.001, Wald (df = 1) = 0.88, P = 0.35; OR = 1.00, model χ2 (1) = 0.87, P = 0.35]. In sum, the gender composition of the preselection advisors was not associated with applicants’ chances (i.e., evaluations and success rates) of making it through the preselection phase of the grant review procedure.
Review committee.
On average, 8.1 reviewers, 32.6% of which were women, took part in the interview committee and evaluated the applications on the three assessment criteria. A simple regression analysis showed that the percentage of female reviewers was not associated with the committee evaluations for applicants [β = −0.005, R2 = 0.00, F(1, 1,448) = 0.04, P = 0.85]. Fig. S1 shows the relationship between the percentage of female reviewers and committee evaluations of applicants. A binary logistic regression analysis also showed that the percentage of female reviewers was not associated with applicants’ success rate [B = 0.000, SE = 0.005, Wald (df = 1) = 0.003, P = 0.96; OR = 1.00, model χ2 (1) = 0.003, P = 0.96]. Thus, the representation of female reviewers appeared to be unrelated to the evaluation and success rates of male and female applicants.
Acknowledgments
We thank two anonymous reviewers for their valuable comments on a previous draft of this manuscript. This research was funded by the Netherlands Organization for Scientific Research (NWO).
Footnotes
The authors declare no conflict of interest.
This article is a PNAS Direct Submission.
*External reviewing is conducted by international experts in the topic and field of the application proposal. Although these experts report their evaluation to the review committee, they are not considered members of the review committee.
†Scientists are allowed to apply twice within the first 3 y after obtaining their PhD. These data were available only for one call, that is, applicants who applied in 2012.
‡Applications were rated on a nine-point Likert scale ranging from 1, “excellent,” to 9, “unsuccessful.” Lower scores thus indicated more favorable evaluations and led to higher prioritization of applicants.
§Applications were evaluated twice by the interview committee, once before the interview and once after the interview. Because these two scores were highly correlated (r > 0.60, P < .001 for all), here we present the average interview evaluation.
**Applicants’ track record data were not available for analysis.
††We did not take into account the written communications containing explicit references to the NWO’s gender policy, resulting in 53 documents coded for gender-exclusive language use.
This article contains supporting information online at www.pnas.org/lookup/suppl/doi:10.1073/pnas.1510159112/-/DCSupplemental.
References
- 1.Ellemers N. Women at work: How organizational features impact career development. Policy Insights Behav Brain Sci. 2014;1(1):1–9. [Google Scholar]
- 2.Kaatz A, Gutierrez B, Carnes M. Threats to objectivity in peer review: The case of gender. Trends Pharmacol Sci. 2014;35(8):371–373. doi: 10.1016/j.tips.2014.06.005. [DOI] [PMC free article] [PubMed] [Google Scholar]
- 3.Shen H. Inequality quantified: Mind the gender gap. Nature. 2013;495(7439):22–24. doi: 10.1038/495022a. [DOI] [PubMed] [Google Scholar]
- 4.Valian V. Why So Slow? The Advancement of Women. MIT Press; Cambridge, MA: 1999. [Google Scholar]
- 5.Crosby FJ, Iyer A, Clayton S, Downing RA. Affirmative action: Psychological data and the policy debates. Am Psychol. 2003;58(2):93–115. doi: 10.1037/0003-066x.58.2.93. [DOI] [PubMed] [Google Scholar]
- 6.Dovidio JF, Gaertner SL. Affirmative action, unintentional racial biases, and intergroup relations. J Soc Issues. 1996;52(4):51–75. [Google Scholar]
- 7.Catalyst Why diversity matters. 2013 Available at www.catalyst.org/system/files/why_diversity_matters_catalyst_0.pdf. Accessed April 30, 2015.
- 8.Clark D. Making the business case for diversity. 2014 Available at www.forbes.com/sites/dorieclark/2014/08/21/making-the-business-case-for-diversity/. Accessed April 30, 2015.
- 9.Pletzer JL, Nikolova R, Kedzior KK, Voelpel SC. Does gender matter? Female representation on corporate boards and firm financial performance—a meta-analysis. PLoS One. 2015;10(6):e0130005. doi: 10.1371/journal.pone.0130005. [DOI] [PMC free article] [PubMed] [Google Scholar]
- 10.Adams RB, Ferreira D. Women in the boardroom and their impact on governance and performance. J Financ Econ. 2009;94(2):291–309. [Google Scholar]
- 11.Rhode DL, Packel AK. Diversity on corporate boards: How much difference does difference make? Del J Corp Law. 2014;39(2):377–425. [Google Scholar]
- 12.van Dijk H, van Engen ML, van Knippenberg D. Defying conventional wisdom: A meta-analytical examination of the differences between demographic and job-related diversity relationships with performance. Organ Behav Hum Decision Proc. 2012;119(1):38–53. [Google Scholar]
- 13.Schiebinger L, Klinge I, Sánchez de Madariaga I, Schraudner M, Stefanick M. (Eds.) (2011-2013). Gendered Innovations in Science, Health and Medicine, Engineering, and Environment. Available at genderedinnovations.stanford.edu/what-is-gendered-innovations.html. Accessed January 21, 2015.
- 14.World Economic Forum The Global Gender Gap Report 2014. 2014 Available at reports. weforum.org/global-gender-gap-report-2014/. Accessed.
- 15.Eagly AH, Karau SJ, Makhijani MG. Gender and the effectiveness of leaders: A meta-analysis. Psychol Bull. 1995;117(1):125–145. doi: 10.1037/0033-2909.117.1.125. [DOI] [PubMed] [Google Scholar]
- 16.Hyde JS. Gender similarities and differences. Annu Rev Psychol. 2014;65:373–398. doi: 10.1146/annurev-psych-010213-115057. [DOI] [PubMed] [Google Scholar]
- 17.Ellemers N, Rink F, Derks B, Ryan M. Women in high places: When and why promoting women into top positions can harm them individually or as a group (and how to prevent this) Res Organ Behav. 2012;32:163–187. [Google Scholar]
- 18.Miller DI, Eagly AH, Linn MC. Women’s representation in science predicts national gender-science stereotypes: Evidence from 66 nations. J Educ Psychol. 2015;107(3):631–644. [Google Scholar]
- 19.Nosek BA, et al. National differences in gender-science stereotypes predict national sex differences in science and math achievement. Proc Natl Acad Sci USA. 2009;106(26):10593–10597. doi: 10.1073/pnas.0809921106. [DOI] [PMC free article] [PubMed] [Google Scholar]
- 20.Leslie S-J, Cimpian A, Meyer M, Freeland E. Expectations of brilliance underlie gender distributions across academic disciplines. Science. 2015;347(6219):262–265. doi: 10.1126/science.1261375. [DOI] [PubMed] [Google Scholar]
- 21.European Research Council Gender statistics. 2014 Available at erc.europa.eu/sites/default/files/document/file/Gender_statistics_April_2014.pdf. Accessed December 17, 2014.
- 22.Wennerås C, Wold A. Nepotism and sexism in peer-review. Nature. 1997;387(6631):341–343. doi: 10.1038/387341a0. [DOI] [PubMed] [Google Scholar]
- 23.Bedi G, Van Dam NT, Munafo M. Gender inequality in awarded research grants. Lancet. 2012;380(9840):474. doi: 10.1016/S0140-6736(12)61292-6. [DOI] [PubMed] [Google Scholar]
- 24.Ceci SJ, Ginther DK, Kahn S, Williams WM. Women in academic science: A changing landscape. Psychol Sci Public Interest. 2014;15(3):75–141. doi: 10.1177/1529100614541236. [DOI] [PubMed] [Google Scholar]
- 25.Hosek SD, et al. Gender differences in major federal external grant programs. 2005 Available at www.rand.org/pubs/technical_reports/TR307.html. Accessed October 24, 2014.
- 26.Steinpreis RE, Anders KA, Ritzke D. The impact of gender on the review of the curricula vitae of job applicants and tenure candidates: A national empirical study. Sex Roles. 1999;41(7-8):509–528. [Google Scholar]
- 27.Marsh HW, Jayasinghe UW, Bond NW. Improving the peer-review process for grant applications: Reliability, validity, bias, and generalizability. Am Psychol. 2008;63(3):160–168. doi: 10.1037/0003-066X.63.3.160. [DOI] [PubMed] [Google Scholar]
- 28.Stout JG, Dasgupta N. When he doesn’t mean you: Gender-exclusive language as ostracism. Pers Soc Psychol Bull. 2011;37(6):757–769. doi: 10.1177/0146167211406434. [DOI] [PubMed] [Google Scholar]
- 29.Gaucher D, Friesen J, Kay AC. Evidence that gendered wording in job advertisements exists and sustains gender inequality. J Pers Soc Psychol. 2011;101(1):109–128. doi: 10.1037/a0022530. [DOI] [PubMed] [Google Scholar]
- 30.Born MP, Taris TW. The impact of the wording of employment advertisements on students’ inclination to apply for a job. J Soc Psychol. 2010;150(5):485–502. doi: 10.1080/00224540903365422. [DOI] [PubMed] [Google Scholar]
- 31.Schmader T, Whitehead J, Wysocki VH. A linguistic comparison of letters of recommendation for male and female chemistry and biochemistry job applicants. Sex Roles. 2007;57(7-8):509–514. doi: 10.1007/s11199-007-9291-4. [DOI] [PMC free article] [PubMed] [Google Scholar]
- 32.Rubini M, Menegatti M. Hindering women’s careers in academia: Gender linguistic bias in personnel selection. J Lang Soc Psychol. 2014;33(6):632–650. [Google Scholar]
- 33.Kaatz A, Magua W, Zimmerman DR, Carnes M. A quantitative linguistic analysis of National Institutes of Health R01 application critiques from investigators at one institution. Acad Med. 2015;90(1):69–75. doi: 10.1097/ACM.0000000000000442. [DOI] [PMC free article] [PubMed] [Google Scholar]
- 34.Marchant A, Bhattacharya A, Carnes M. Can the language of tenure criteria influence women’s academic advancement? J Womens Health (Larchmt) 2007;16(7):998–1003. doi: 10.1089/jwh.2007.0348. [DOI] [PubMed] [Google Scholar]
- 35.van Arensbergen P, van der Weijden I, van den Besselaar P. Gender differences in scientific productivity: A persisting phenomenon? Scientometrics. 2012;93(3):857–868. doi: 10.1007/s11192-012-0712-y. [DOI] [PMC free article] [PubMed] [Google Scholar]
- 36.Bornmann L, Mutz R, Daniel HD. Gender differences in grant peer review: A meta-analysis. J Informetrics. 2007;1(3):226–238. [Google Scholar]
- 37.Pohlhaus JR, Jiang H, Wagner RM, Schaffer WT, Pinn VW. Sex differences in application, success, and funding rates for NIH extramural programs. Acad Med. 2011;86(6):759–767. doi: 10.1097/ACM.0b013e31821836ff. [DOI] [PMC free article] [PubMed] [Google Scholar]
- 38.National Institutes of Health R01-equivalent grants: Success rates, by gender and type of application. 2015 Available at report.nih.gov/NIHDatabook/Charts/Default.aspx?showm=Y&chartId=131&catId=13. Accessed April 10, 2015.
- 39.Devine PG. Stereotypes and prejudice: Their automatic and controlled components. J Pers Soc Psychol. 1989;56(1):5–18. [Google Scholar]
- 40.Castilla EJ, Bernard S. The paradox of meritocracy in organizations. Adm Sci Q. 2010;55(4):543–576. [Google Scholar]
- 41.Kaiser CR, et al. Presumed fair: Ironic effects of organizational diversity structures. J Pers Soc Psychol. 2013;104(3):504–519. doi: 10.1037/a0030838. [DOI] [PubMed] [Google Scholar]
- 42.Biernat M, Fuegen K. Shifting standards and the evaluation of competence: Complexity in gender-based judgments and decision making. J Soc Issues. 2001;57(4):707–724. [Google Scholar]
- 43.Moss-Racusin CA, Dovidio JF, Brescoll VL, Graham MJ, Handelsman J. Science faculty’s subtle gender biases favor male students. Proc Natl Acad Sci USA. 2012;109(41):16474–16479. doi: 10.1073/pnas.1211286109. [DOI] [PMC free article] [PubMed] [Google Scholar]


