

Article first published online 6 July 2015.
Supplemental Digital Content is Available in the Text.
Key Words: Crohn's disease, inflammatory bowel diseases, microRNA, high-throughput RNA-sequencing
Background:
There is a dire need for reliable prognostic markers that can guide effective therapeutic intervention in Crohn's disease (CD). We examined whether different phenotypes in CD can be classified based on colonic microRNA (miRNA) expression and whether miRNAs have prognostic utility for CD.
Methods:
High-throughput sequencing of small and total RNA isolated from colon tissue from patients with CD and controls without Inflammatory Bowel Disease (non-IBD) was performed. To identify miRNAs associated with specific phenotypes of CD, patients were stratified according to disease behavior (nonstricturing, nonpenetrating; stricturing; penetrating), and miRNA profiles in each subset were compared with those of the non-IBD group. Validation assays were performed using quantitative reverse transcription polymerase chain reaction. These miRNAs were further evaluated by quantitative reverse transcriptase polymerase chain reaction on formalin-fixed, paraffin-embedded tissue (index biopsies) of patients with nonpenetrating CD at the time of diagnosis that either retained the nonpenetrating phenotype or progressed to penetrating/fistulizing CD.
Results:
We found a suite of miRNAs, including miR-31-5p, miR-215, miR-223-3p, miR-196b-5p, and miR-203 that stratify patients with CD according to disease behavior independent of the effect of inflammation. Furthermore, we also demonstrated that expression levels of miR-215 in index biopsies of patients with CD might predict the likelihood of progression to penetrating/fistulizing CD. Finally, using a novel statistical simulation approach applied to colonic RNA-sequencing data for patients with CD and non-IBD controls, we identified miR-31-5p and miR-203 as candidate master regulators of gene expression profiles associated with CD.
Conclusions:
miRNAs may serve as clinically useful prognostic markers guiding initial therapy and identifying patients who would benefit most from effective intervention.
SUMMARY BOX.
What is known about the subject:
Crohn's disease (CD) is a highly variable and complex disease, which makes diagnosis and effective treatment a challenge.
Dysregulated microRNAs (miRNAs) have been identified in colon and blood plasma of patients with CD and can be used as biomarkers of disease.
miRNAs have been shown to regulate specific genes associated with CD including NOD2, IL-6, and TNF.
What are the new findings:
miRNA expression profiles stratify distinct behavioral phenotypes of CD.
Dysregulated miRNAs, miR-31 and miR-203, are candidate master regulators of pathways disrupted in CD pathogenesis.
miR-215 is a candidate prognostic indicator of CD progression.
How might it impact clinical practice in the foreseeable future:
Our study shows for the first time that miRNAs are useful for classification of disease behavior within CD, which is valuable for determining effective, personalized treatment plans.
Our findings indicate that specific miRNAs may be useful in predicting CD progression, which could have transformative implications for early treatment.
Crohn's disease (CD) results from an aberrant immune response to the enteric microbiota in a genetically susceptible host. CD susceptibility genes identified through genome-wide association studies highlight mechanistic pathways, including defective innate immunity. The innate immune system forms the first line of defense against pathogens and mediates mucosal responses to resident microbiota. Microbial recognition is initiated by pathogen-associated molecular patterns triggering extracellular receptors termed toll-like receptors or intracytoplasmic nucleotide-binding oligomerization domain-containing protein (NOD)-like receptors. This leads to downstream signaling through pathways regulated by nuclear factor kappa-B (NFκB), mitogen-activated protein kinase, and interferons.1
MicroRNAs (miRNAs) are a group of small (∼22 nucleotide), noncoding RNAs that regulate gene expression at the posttranscriptional level.2 They have emerged as key regulators of a wide variety of biological processes. A number of miRNAs have already been identified as regulators of pathways that underlie the pathogenesis of inflammatory bowel diseases (IBD), which include CD and ulcerative colitis (UC). For example, miR-192, miR-122, miR-29, and miR-146a have been shown to target and repress NOD2, which has been implicated in CD.3–6 Furthermore, a single nucleotide polymorphism (SNP), rs3135500, in the 3' UTR of NOD2 weakens the miR-192 target site resulting in reduced inhibition of NOD2.4 Another miRNA regulator of NOD2 expression, miR-146a, has been shown to drive interleukin 6 and tumor necrosis factor (TNF) secretion in muramyl dipeptide–activated macrophages in experimental models of colitis.5
Recent studies have performed miRNA profiling in tissues of patients with IBD. Most of these studies used either microarray platforms7–10 or quantitative reverse transcriptase polymerase chain reaction (qRT-PCR).11–13 These approaches are informative but harbor at least 3 major limitations. First, they are limited to known miRNAs and are therefore not sensitive to functionally distinct miRNA variants known as isomiRs. Second, they often cannot adequately distinguish among miRNAs in the same family that differ by only 1 or 2 nucleotides. Third, microarrays have low dynamic range, which mitigates the accuracy of differential miRNA expression analysis across samples, particularly for more lowly expressed miRNAs.
Small RNA-sequencing, while not without its own biases,14–16 ameliorates each of these 3 limitations. To our knowledge, only one study has used this technology to investigate miRNAs in IBD.17 In our study, we performed next-generation sequencing of small RNAs isolated from macroscopically noninflamed colon tissue obtained from a set of extensively phenotyped patients with CD. We stratified the patients based on inflammatory, stricturing, or penetrating CD and identified unique colonic miRNA signatures of each class. We also studied the effect of inflammation on miRNA expression through small RNA-sequencing of matched colon samples obtained from macroscopically inflamed regions from a subset of patients with CD. To determine disease specificity of the inflammation effect, we used tissue samples from inflamed and noninflamed regions of the colon in patients with UC as controls. These studies revealed specific miRNAs that serve as colonic markers of distinct disease behaviors in CD. Furthermore, we reveal the potential prognostic utility of miRNAs in CD by demonstrating that miR-215 expression in index biopsies of well phenotyped patients with nonpenetrating CD obtained at the time of diagnosis may predict progression to penetrating CD. Finally, using a statistical simulation strategy, we identified candidate miRNA drivers of the gene expression profiles associated with CD.
MATERIALS AND METHODS
Patient Population
Well-characterized patients with CD from the adult IBD Center at University of North Carolina were included in this study. A total of 35 samples were submitted for small RNA- and RNA-sequencing analyses (see Table, Supplemental Digital Content 1, http://links.lww.com/IBD/A957). For qRT-PCR validation, 14 non-IBD (NIBD) controls as well as 21 patients with CD and 6 patients with UC were analyzed (see Table, Supplemental Digital Content 2, http://links.lww.com/IBD/A958). In the prospective study, index biopsies from 10 NIBD control samples, 6 non-B3 patients with CD, and 6 B3 patients were analyzed (see Table, Supplemental Digital Content 3, http://links.lww.com/IBD/A959). This study received Institutional Review Board approval at University of North Carolina (UNC) at Chapel Hill (Protocol nos. 10-0355 and 15-0024).
Phenotyping
All data were collected by chart review and stored in a secured database. For the purpose of this study, phenotype was defined as all variables that were not genetic.
Clinical Phenotype
Clinical phenotypes included demographic and clinical variables: age, gender, disease duration, age at diagnosis, disease location, and type of disease behavior (see Tables, Supplemental Digital Content 4 and 5, http://links.lww.com/IBD/A960 and http://links.lww.com/IBD/A961) such as B1, nonstricturing and nonpenetrating; B2, stricturing; and B3, penetrating/fistulizing. Stricturing disease was defined as the occurrence of constant luminal narrowing demonstrated by radiologic, endoscopic, or surgical examination combined with prestenotic dilatation and/or obstructive signs or symptoms. Penetrating disease was defined as the presence of perianal, enteroenteric, or enterovesicular fistulae, intra-abdominal abscesses or intestinal perforation.
Identification of Formalin-fixed, Paraffin-embedded Sections in Patients with CD
We identified 12 adult patients followed at the adult IBD clinic of UNC for inclusion into the study. Each patient was diagnosed at UNC with formalin-fixed, paraffin-embedded (FFPE) tissue available from a macroscopically and microscopically quiescent section of the colon taken at the time of diagnosis (index biopsy). All 12 patients at time of diagnosis had a B1 CD phenotype. Six of 12 patients as of 2015 had progressed to a B3 penetrating CD phenotype (5 with perianal fistulizing CD and 2 with intra-abdominal abscess secondary to CD affecting the terminal ileum). The remaining 6 of the 12 patients remained in the B1 phenotype (2 of 6 with disease remission and 4 of 6 with active CD). Mucosal sections were identified by a pathologist (D.G.T.) from each FFPE sample, and scrolls were obtained to process for small RNA isolation (see Tables, Supplemental Digital Content 3, http://links.lww.com/IBD/A959 and Figs., Supplemental Digital Content 6 and 7, http://links.lww.com/IBD/A962 and http://links.lww.com/IBD/A963). Sections were selected for no or minimal chronic inflammation. The presence or absence of acute (active) and chronic inflammation was determined after review of each H&E stained slide. Activity was determined by the presence of histologic features of acute inflammation, including neutrophilic inflammation of crypt epithelium and crypt abscess formation. Chronicity was determined based on the presence of features such as architectural distortion and basal lymphoplasmacytosis of the lamina propria. Degree of activity was determined based on the percentage of mucosa involved by active inflammation.
RNA Isolation
RNA was isolated from fresh-frozen human colon tissues using the Qiagen RNeasy Mini Kit (Valencia, CA), which preserves both miRNA and mRNA content. This kit uses a column-based DNase treatment to eliminate DNA contamination. miRNA was enriched from FFPE tissue samples using the Roche High Pure miRNA Isolation Kit (Penzberg, Germany; see Fig., Supplemental Digital Content 7, http://links.lww.com/IBD/A963). RNA purity and integrity were assessed with Thermo Scientific NanoDrop 2000 (Waltham, MA) and Agilent 2100 Bioanalyzer (Santa Clara, CA), respectively.
Small RNA- and mRNA-Sequencing and Expression Analysis
Small RNA libraries were generated using Illumina TruSeq Small RNA Sample Preparation Kit (San Diego, CA). Single-end (50 bp) sequencing was performed on the Illumina HiSeq 2500 platform at the UNC High-Throughput Sequencing Facility. Eight libraries were randomly assigned to each sequencing lane. miRNAs and their isomiRs were annotated and quantified according to our previously described bioinformatics analysis pipeline.14 Sequencing quality and mapping statistics were compared across all samples (see Table, Supplemental Digital Content 8, http://links.lww.com/IBD/A964). miRNAs with an expression level of 100 reads per million mapped in at least 1 sample were considered for differential expression analysis.
Libraries for RNA-sequencing were prepared using the Illumina TruSeq polyA+ Sample Prep Kit. Paired-end (50 bp) sequencing was performed on the Illumina HiSeq 2500 platform at the UNC High-Throughput Sequencing Facility. Ten libraries were assigned to each lane. Genotype data from the Illumina Immunochip was available for all samples with RNA-sequencing data. Genotype imputation was performed with MaCH-admix,18 and custom genomes were created using genotype calls for all genotyped and imputed variants. RNA-sequencing reads were then aligned to personalized genomes using the “SNP-tolerant” GSNAP software.19 This alignment pipeline allows for elimination of mapping biases that arise from discrepancies in genetic variation between individual samples and a standard reference genome, at both homozygous and heterozygous sites. Sequencing quality and mapping statistics were compared across all samples (see Table, Supplemental Digital Content 9, http://links.lww.com/IBD/A965). The top 60% of genes, filtering by the mean of the raw counts, were used for differential expression analysis. Differentially expressed (DE) genes in CD samples relative to NIBD samples were identified by unpaired Student's t test after variance stabilizing transformation of the data (DESeq20).
miRNAs and genes were considered significantly DE in CD relative to NIBD if they had a log2(fold-change [FC]) ≥±1.0 at a P-value ≤0.05 by an unpaired 2-tailed Student's t test. Small RNA- and mRNA-sequencing data were deposited in GEO (GEO accession No. GSE66209).
Quantitative Reverse Transcriptase PCR
Total RNA was isolated from tissues using the Norgen's Total RNA Purification kit (Thorold, ON, Canada). Fifty nanograms of RNA was used for reverse transcription with the Life Technologies TaqMan MicroRNA Reverse Transcription kit (Grand Island, NY). miRNA qRT-PCR were performed using the TaqMan Universal PCR Master Mix per Life Technologies' protocol, on a Bio-Rad Laboratories CFX96 Touch Real Time PCR Detection System (Richmond, CA). Reactions were performed in triplicate using RNU48 as the normalizer.
miRHub Analysis
Candidate master miRNA regulators were identified by miRHub,14,21 using the “non-network” mode and requiring a predicted target site to be conserved between human and at least one other species.
RESULTS
Small RNA-sequencing Reveals Distinct miRNA Signatures in the Noninflamed Colon of Patients with CD with Different Disease Behaviors
To characterize the small RNA transcriptome in different phenotypic classes of CD, we performed high-throughput sequencing of small RNA isolated from noninflamed colon tissue from 21 patients and 14 NIBD controls (Methods). We obtained an average of approximately 18.5 million reads per sample, of which an average of approximately 75% were mapped to the human genome (see Table, Supplemental Digital Content 8, http://links.lww.com/IBD/A964). Individual miRNAs were annotated and quantified according to our previously described small RNA-sequencing analysis pipeline (Methods, GEO accession No. GSE66209). We found that the expression levels of 4 miRNAs (miR-31-5p, miR-149-5p, miR-150-5p, and miR-375) were significantly altered (log2(FC) > 1 or < −1, P < 0.05, 2-tailed unpaired Student's t test) in patients with CD compared with NIBD controls (Fig. 1A).
FIGURE 1.
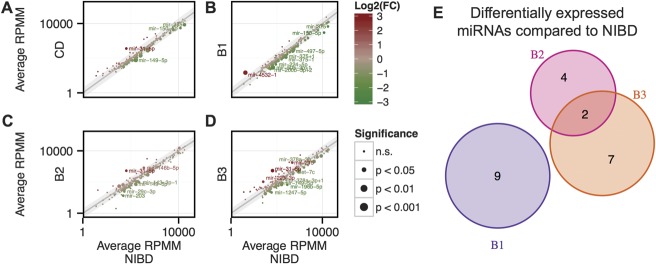
Scatter plots showing average miRNA expression as determined by small RNA-sequencing comparing (A) CD, (B) B2/nonstricturing, nonpenetrating class, (C) B2/stricturing class, and (D) B3/penetrating class with NIBD patient samples. (E), Venn diagram showing overlap of significantly DE microRNAs relative to NIBD. Gray shaded region indicates log2(FC) < 1 or > −1. Size of point indicates significance level as determined by a 2-tailed unpaired Student's t test, whereas color indicates direction of change. miRNAs achieving significance and log2(FC) of > 1 or < −1 change in expression are labeled and considered DE.
To identify miRNAs associated with specific CD phenotypes, we stratified the 21 patients according to their disease subclass (B1: nonstricturing and nonpenetrating, n = 8; B2: stricturing, n = 6; and B3: penetrating, n = 7) and compared miRNA profiles in each class with those of the NIBD control group. We found 9, 6, and 9 significantly (log2(FC) > 1 or < −1, P < 0.05) DE miRNAs in the B1, B2, and B3 classes, respectively (Fig. 1B–D; see Table, Supplemental Digital Content 10, http://links.lww.com/IBD/A966). These included several 5'-end variants of canonical miRNAs (referred to as 5'-isomiRs), such as miR-375-3p+1, miR-143-3p-1, and miR-378a-3p+1, which have been shown to be functionally relevant and are only distinguishable from their canonical counterparts by sequencing-based analysis.14,22,23
Strikingly, we found that the majority of the significantly DE miRNAs in each disease class were unique to that class (Fig. 1). Specifically, 9/9, 4/6, and 7/9 miRNAs were exclusively DE compared with NIBD controls in B1, B2, and B3, respectively (Fig. 1E). For example, miR-150-5p, which normally represses the immune response,24 was significantly downregulated only in the B1 disease class (see Fig., Supplemental Digital Content 11, http://links.lww.com/IBD/A967). Also, miR-31-5p (up), miR-149-5p (down), miR-196b-5p (down), miR-215 (up), miR-223-3p (up), and miR-203 (down) were altered in B2 and/or B3, both of which exhibit fibrosis and penetrating/fistulizing phenotypes, but not in B1 (Fig. 2). The downregulation of miR-196 (Ref. 25) and miR-203,26 as well as the upregulation of miR-192/215 (Ref. 27) and miR-223 (Ref. 28) have been associated with fibrosis in different tissues including kidney and skin. miR-31-5p and miR-149-5p were significantly DE in both B2 and B3 classes (Fig. 2A, G). Although ileocolonic miR-31 levels were previously associated with CD,29,30 miR-149-5p has only been reported previously as a plasma marker of CD.8,31
FIGURE 2.
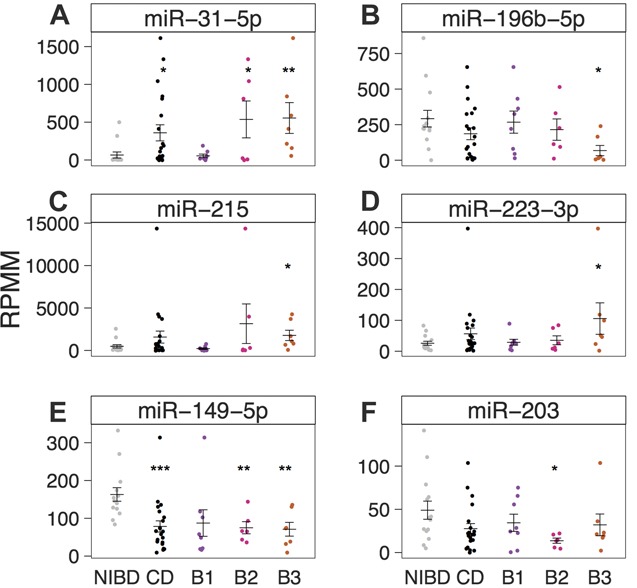
miRNA expression (reads per million mapped) as determined by small RNA-sequencing is shown for (A) miR-31-5p, (B) miR-196b-5p, (C) miR-215, (D) miR-223-3p, (E) miR-203, and (F) miR-149-5p in NIBD (gray, n = 14) and CD (black, n = 21) patient samples. CD samples are further categorized as B1 (purple, n = 8), B2 (pink, n = 6), or B3 (orange, n = 7). Mean and SE for each group are depicted using horizontal and vertical bars. Significance is determined using a 2-tailed unpaired Student's t test comparing each group with NIBD samples. *P < 0.05, **P < 0.01, ***P < 0.001.
To validate these findings, we performed qRT-PCR (Methods) for 3 miRNAs (miR-31-5p, miR-215, and miR-149-5p). We confirmed that all 3 were unchanged in B1 but DE in both B2 and B3 (Fig. 3). miR-31-5p was the most prominently upregulated in both B2 (7.6-fold) and B3 (9.2-fold), whereas miR-215 was more modestly upregulated in B3 (1.7-fold), and miR-149-5p was significantly downregulated in both B2 (−3.6-fold) and B3 (−2.6-fold).
FIGURE 3.
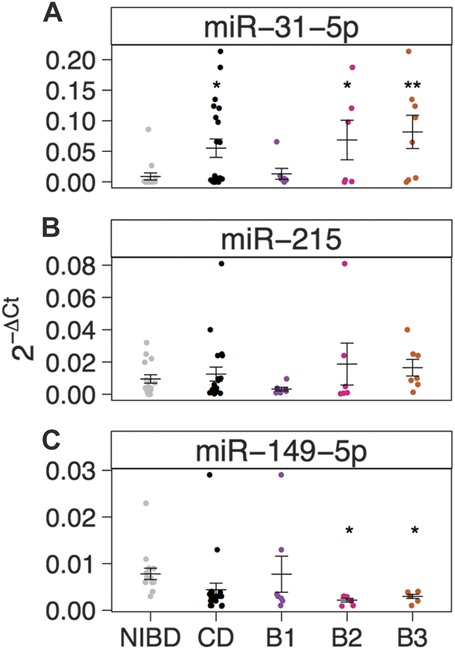
Relative miRNA expression levels (2−ΔCt) as determined by qRT-PCR and normalized to RNU48 are shown for (A) miR-31-5p, (B) miR-215, and (C) miR-149-5p in NIBD (n = 15, gray) and CD (n = 20, black) patient samples. CD samples are further categorized as B1 (purple, n = 7), B2 (pink, n = 6), or B3 (orange, n = 7). Mean and SE for each group are depicted using horizontal and vertical bars. Significance is determined using a 2-tailed unpaired Student's t test comparing each group with NIBD samples. *P < 0.05, **P < 0.01.
Taken together, these results reveal distinct miRNA signatures associated with different CD disease classes. In particular, patients with B2/stricturing and/or B3/penetrating phenotypes exhibit a completely different colonic miRNA profile than patients without either of those conditions. To our knowledge, these findings are the first to demonstrate that molecular subtypes of CD stratify according to miRNA profiles.
Inflammation Is Not a Primary Driver of miR-31-5p, miR-215, and Other CD-associated miRNAs
To determine whether the DE miRNAs are further dysregulated by active inflammation, we performed small RNA-sequencing on total RNA isolated from inflamed colon tissue from 6 individuals with CD, including at least 1 from each disease class (B1, n = 3; B2, n = 1; B3, n = 2), and compared the miRNA profiles with those of the patient-matched noninflamed tissue (see Fig. A and B, Supplemental Digital Content 12, http://links.lww.com/IBD/A968; Table, Supplemental Digital Content 8, http://links.lww.com/IBD/A964, GEO accession No. GSE66209). We found that none of the 22 miRNAs that were found to be significantly DE in the noninflamed colon of B1, B2, or B3 classes of patients with CD (Fig. 1) were significantly altered in the matched inflamed tissue (Fig. 4; see Fig. A, C and D, Supplemental Digital Content 12, http://links.lww.com/IBD/A968), although miR-149-5p did trend upward (Fig. 4E). As a positive control, we compared miR-132 and miR-99b-5p, both of which are known to be associated with proinflammatory processes32,33 and found that they were indeed significantly elevated in inflamed relative to noninflamed colon tissue (see Fig. E and F, Supplemental Digital Content 12, http://links.lww.com/IBD/A968). These findings suggest that the CD-associated miRNAs we have identified are molecular markers of genetic predisposition to CD as opposed to indicators of an acute inflammatory process.
FIGURE 4.
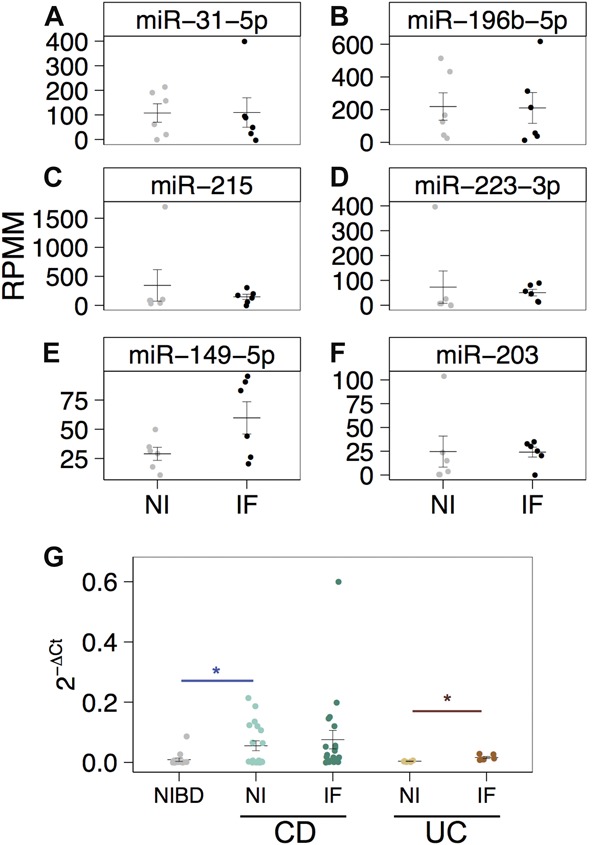
miRNA expression (reads per million mapped) as determined by small RNA-sequencing is shown for (A) miR-31-5p, (B) miR-196b-5p, (C) miR-215, (D) miR-223-3p, (E) miR-149-5p, and (F) miR-203 in 6 matched noninflamed (NI; gray) and inflamed CD samples (IF; black) patient samples. (G), Relative miR-31-5p expression levels (2−ΔCt) as determined by qRT-PCR and normalized to RNU48 are shown for samples from NIBD patients (n = 15), matched NI and IF patients with CD (n = 19), and matched NI and IF UC patient samples (n = 6). Significance is determined using a 2-tailed unpaired Student's t test comparing each group with NIBD (blue with bar) samples or matched noninflamed tissue (red with bar). *P < 0.05. Significance was not achieved by a 2-tailed paired Student's t test comparing NI with IF in panels (A–F).
We measured miR-31-5p by qRT-PCR in colon tissue with low-grade inflammation from patients with UC (n = 6) and found that the levels were not changed compared with colon tissue from normal controls (n = 15) (Fig. 4G). Interestingly, miR-31-5p was 4.2-fold elevated in UC patient-matched inflamed tissue (Fig. 4G), unlike what we observed in CD (Fig. 4A).
Taken together, these findings indicate that although inflammation may modulate miR-31-5p in some disease contexts such as psoriasis34 or even within the IBDs (UC; Fig. 4G), biological processes other than inflammation are primarily responsible for the dysregulation of colonic miRNAs, such as miR-31-5p, miR-215, and miR-196b-5p, in CD.
miR-215 Is a Potential Predictor of a Penetrating Disease Phenotype in CD
To determine whether miR-31-5p, miR-149-5p, and miR-215 could predict the progression of a B1 CD phenotype to a B3 phenotype, we obtained from 12 patients FFPE colon tissue that was available from biopsies taken at the time of diagnosis at the UNC Hospital. All twelve patients were classified as B1-type CD at the time of diagnosis. Six of the 12 patients subsequently developed a B3 phenotype (B1 → B3), whereas the remaining 6 did not (B1 → non-B3). We performed qRT-PCR (Methods) for 3 miRNAs (miR-31-5p, miR-215, and miR-149-5p) on small RNAs enriched from the FFPE tissue. There was no statistical difference in expression of the miRNAs between the 2 groups (see Fig. 5A and Fig. A and B, Supplemental Digital Content 13, http://links.lww.com/IBD/A969). However, a post hoc analysis revealed that 2 of the patients (both in the B1 → non-B3 group) were in complete clinical and mucosal remission, whereas the remainder had active disease. Adjusting for these 2 patients, we found that miR-215 was 4.8-fold enriched in the B1 → B3 group of patients relative to B1 → non-B3 (P = 0.049, by one-tailed, unpaired, and unequal variance Student's t Test; Fig. 5B). To our knowledge, this is the first description of using miRNAs to prospectively predict disease phenotype in CD.
FIGURE 5.
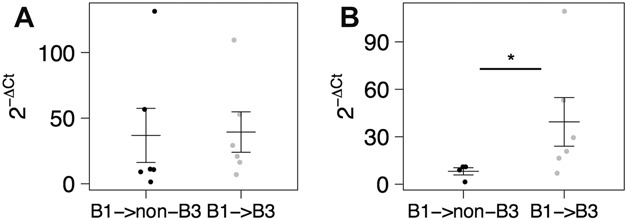
Relative miR-215 expression levels (2−ΔCt) as determined by qRT-PCR and normalized to RNU48 for B1 patient samples that (A) either progressed to a non-B3/penetrating disease (B1 → non-B3, n = 6, black) or progressed to B3/penetrating disease (B1 → B3, n = 6, gray). B, Samples from (B) were subcategorized to include only B1 samples from patients with active CD that did not progress to B3/penetrating disease (B1 → non-B3, n = 4) or progressed to B3/penetrating disease (n = 6). Mean and SE for each group are depicted using horizontal and vertical bars. Significance determined using a one-tailed, unpaired, and unequal variance Student's t test comparing each group with B1 → non-B3 samples. *P < 0.05.
Whole Transcriptome Analysis Reveals that miR-31-5p and miR-203 are Candidate Drivers of the Colonic Gene Expression Profile in CD
To determine whether any of the miRNA markers of CD are also candidate master regulators of gene networks underlying disease pathogenesis, we first performed paired-end high-throughput sequencing of messenger RNAs isolated from the same colon tissue samples that were used for small RNA-sequencing studies (Methods). We obtained an average of approximately 29.4 million paired-end reads per sample, of which an average of approximately 70% mapped uniquely to the human genome (see Table, Supplemental Digital Content 9, http://links.lww.com/IBD/A965). We used DESeq20 to identify DE genes in CD and in each of B1, B2, and B3 phenotype classes, relative to the NIBD control group (Fig. 6A, B). Similar to the results of the small RNA-sequencing analyses, there was very minimal overlap of DE genes between pairwise comparisons of B1, B2, and B3 classes (Fig. 6A, B). These findings highlight the unique molecular identities of different disease behaviors of CD.
FIGURE 6.

Venn diagram showing the number of DE genes (P < 0.05) that were (A) upregulated or (B) downregulated compared with NIBD controls in each of the CD subclasses. Genes that were significantly upregulated or downregulated in all 3 classes, respectively, are shown on the right in the bracketed table. C, Enrichment analysis for target sites of expressed miRNAs (reads per million mapped >100) in DE genes as determined by RNA-sequencing. On the x-axis, DE gene lists were divided into upregulated and downregulated genes for 4 comparisons: CD versus NIBD, B1 versus NIBD, B2 versus NIBD, or B3 versus NIBD. P-values <0.05 are shown in shades of red.
We next applied the miRHub algorithm,14,21 which determines whether the predicted regulatory effect of any miRNA on a set of DE genes is significantly greater than expected by chance (empirical P < 0.05). Only 1 significantly upregulated miRNA, miR-31-5p, was identified as a candidate master regulator of genes that are downregulated in CD (Fig. 6C). Likewise, only 1 significantly downregulated miRNA, miR-203, was identified as a candidate master regulator of genes that are upregulated in CD (Fig. 6).
DISCUSSION
There is a rapidly expanding interest in evaluating the use of miRNAs as potential diagnostic markers of IBD. Most studies of miRNA expression in IBD have used qRT-PCR or microarrays to quantify miRNA abundance. Notable among these was the demonstration that miRNAs were DE in the sigmoid colons of patients with UC.7 A subsequent study demonstrated that none of the CD-associated miRNAs were altered in colon tissues from patients with UC. Furthermore, miRNA expression in CD limited to the ileum was different than CD involving the colon.8 Inflammation was shown to alter the profiles of many of the implicated miRNAs, suggesting inflammation-dependent effects on miRNA expression. Our study is different in its unbiased, next-generation sequencing–based approach to small RNAs. To our knowledge, only 1 study has used small RNA-sequencing in patients with IBD.30 This study, consistent with our findings, reported that miR-31 expression was increased in colon tissue from patients with CD. Although Lin et al used tissues from patients with ischemic colitis and infectious colitis as controls, the effect of inflammation in the context of CD on miR-31 expression was not studied. miR-149 expression was found to be decreased in peripheral blood in patients with CD, but again, the effects of active CD versus inactive disease were not studied, making it difficult to interpret whether plasma miR-149 was truly a marker of genetic predisposition or a sequela of the inflammatory response. Using matched inflamed tissue from the same CD patients, we show that select groups of miRNAs, including miR-31, are aberrantly expressed in an inflammation-independent fashion in patients with CD. This effect was not seen in the inflammatory tissue obtained from patients with UC, suggesting the potential for the use of miR-31 as a marker of genetic predisposition for CD.
Perhaps most notably, our study is the first to demonstrate that miRNAs classify different disease behaviors of CD. We identify a unique colonic miRNA profile for CD that is characterized by a penetrating (fistulas, perianal, and intra-abdominal abscesses) inflammatory phenotype compared with a nonpenetrating phenotype. Closer examination of the miRNAs uniquely altered in each disease behavior revealed pertinent altered biology in CD. For example, we found that miR-29c was uniquely downregulated in the B2 class, which is associated with stricturing secondary to fibrosis. The miR-29 miRNAs have long been established as potent repressors of fibrosis. The downregulation of miR-29c in B2 is consistent with the elevation in B2 of several extracellular matrix genes, including COL6A1, COL6A3, COL21A1, and ELN. In fact, ELN is a validated target of miR-29 in several different cell types.35,36 The downregulation of miR-29c in B2 likely leads to the increased expression of extracellular matrix genes, thereby contributing to the fibrotic phenotype. Also, miR-203 has been shown to regulate TNF-α, the major biological target in managing patients with CD.37 In our study, we found miR-203 to be downregulated in all classes of CD, but only significantly in the B2 class, which may contribute to elevated TNF-α levels seen in CD.38 Importantly, we found that the degree of inflammation did not affect the expression of miR-203.
Our findings highlight the exciting potential of using an miRNA signature as a disease biomarker. Olaru et al found that miR-224 and miR-31 were increased successively at each stage of IBD progression from noninflamed to inflamed nonneoplastic, dysplastic, and finally cancer.29,39 Zhang et al40 found miR-31 to be dysregulated in IBD but not microscopic colitis. miR-21 is also widely reported as dysregulated in UC and CD. Specifically, Ludwig et al41 found that miR-21 was upregulated in IBD-associated dysplastic lesions compared with active patients with IBD. In our study, although highly expressed, there was no statistical difference in miR-21 expression between NIBD and CD tissue. These differences may be related to use of colonic tissue for our study compared with ileal mucosal samples as previously reported.8,10 However, subgroup analysis based on disease behavior did reveal that there is a trend toward higher miR-21 expression in B3 versus NIBD (FC = 4.99, P = 0.14) that is not seen in B2 (FC = 1) or B1 (FC = 1.2) versus NIBD. This highlights the importance of studying different disease classes of CD independently. Future studies similar to ours but incorporating a larger patient cohort will help to make these molecular distinctions more evident. Other than miR-31, we did not see significant changes in colonic expression between patients with CD and NIBD controls for miRNAs most frequently associated with UC, such as miR-126.10
Our results reveal the importance of accounting for CD disease behavior in experimental design and data analysis to more sensitively capture potential diagnostic markers and therapeutic targets. Previous studies have been inconsistent in identifying miRNAs that may serve as biomarkers. Furthermore, no attempt has been made to use an miRNA signature as a potential prognostic marker of CD. By focusing on miRNAs that are highly expressed and demonstrate differences based on disease behavior, we have identified miRNAs with potential diagnostic and prognostic utility. miR-31 expression levels are similar between normal mucosal specimens from cecum, ascending, transverse, descending, sigmoid colon, and rectum, making it a practical choice as a marker, given the frequency of colonoscopies and flexible sigmoidoscopes in patients with IBD.29
Our study focused on miRNA expression in the colon. Signatures in the small bowel are likely different and may add to the value of our study, particularly because it has been shown that inflammation does affect miRNA expression in the ileum.42 miRNAs that we found to be associated with a penetrating phenotype of CD (B3), including miR-31 and miR-215, are known to be increased in the terminal ileum compared with the colon.8 A future study design with samples also obtained from the ileum, incorporating a larger number of patients, may be able to pinpoint which miRNAs are associated with penetrating/fibrosing disease in the small intestine compared with perianal fistulizing disease in the colon.
Perhaps, the most novel aspect of our study is the use of a new “prospective” patient cohort. By carefully selecting a group of patients with penetrating CD who on initial presentation lacked the presence of penetrating CD, we are able to identify an miRNA that may be predictive of this disease phenotype. Furthermore, the ability to test this in an FFPE sample block makes the application of our work a practical reality with potential for clinical use. Given the limitations of clinically phenotyping patients with CD, there is a need to develop molecular phenotypes that help to predict disease behavior. There are many inherent difficulties in patient selection when conducting a prospective biomarker study, including availability of tissue at the time of disease diagnosis, availability of detailed and careful phenotyping of patient disease course, clinical follow-up, and accurate technology for analysis of FFPE samples. Given these challenges, our sample numbers are small, but the study has nonetheless yielded novel and intriguing results, which merit detailed further investigation. Interestingly, post hoc analysis of the B1 → B3 group showed that miR-215 was most increased in patients with a penetrating CD phenotype of the ileum (see Fig., Supplemental Digital Content 14, http://links.lww.com/IBD/A970) compared with the patients with perianal fistulizing CD. Given the recent study showing that peripheral blood miRNAs can be used to distinguish active CD and UC from healthy controls, it will be interesting to test the potential of the select group of miRNAs that share a common systemic and colonic expression profile. Our findings demonstrate that miRNAs can be used to classify different CD disease behaviors and lay the groundwork to study their clinical utility as prognostic markers of IBD.
Supplementary Material
ACKNOWLEDGMENTS
Author contributions: B. C. E. Peck acquired, analyzed and interpreted data, prepared figures, drafted and revised the manuscript. M. Weiser acquired, analyzed and interpreted data, drafted and revised the manuscript. S. E. Lee, G. R. Gipson, and V. B. Iyer acquired data. R. B. Sartor, H. H. Herfarth, M. D. Long, J. J. Hansen, K. L. Isaacs, D. G. Trembath, R. Rahbar, and T. S. Furey provided help with tissue acquisition and patient phenotyping. T. S. Furey and P. Sethupathy designed the study, analyzed and interpreted the data, drafted and revised the manuscript, and obtained funding. S. Z. Sheikh conceptualized and designed the study, acquired the data, interpreted data, drafted and revised the manuscript, obtained funding, acted as study sponsor, and supervised the study. All authors uphold the integrity of the work, have had final approval of the manuscript in its entirety, and are accountable for all aspects of the work.
Footnotes
Supplemental digital content is available for this article. Direct URL citations appear in the printed text and are provided in the HTML and PDF versions of this article on the journal's Web site (www.ibdjournal.org).
The authors have no conflicts of interest to disclose.
Supported by American Gastroenterological Association (AGA) Research Scholar Award (SZS), Broad Medical Research Program (SZS), Crohn's and Colitis Foundation of America's Career Development Award (SZS) and Microbiome Consortium (RBS), R01-ES024983 from NIEHS (MW, SZS, and TSF), P01-DK094779-01A1 from NIDDK (RBS and SZS), P30-DK034987 from NIDDK (RBS and SZS), R00-DK09131802 from NIDDK (PS), UNC Nutrition Obesity Research Center Pilot & Feasibility Grant P30DK056350 (PS), UNC Genetics and Molecular Biology T32 Training Grant GM00709239 (BCEP), SHARE from the Helmsley Trust and UNC Institute for Maximizing Student Diversity Excellence Fellowship R25-GM05533613 (BCEP). The UNC Translational Pathology Laboratory is supported in part by grants from the National Cancer Institute (3P30CA016086) and the UNC University Cancer Research Fund (UCRF).
REFERENCES
- 1.Geremia A, Biancheri P, Allan P, et al. Innate and adaptive immunity in inflammatory bowel disease. Autoimmun Rev. 2014;13:3–10. [DOI] [PubMed] [Google Scholar]
- 2.Bartel DP. MicroRNAs: target recognition, and regulatory functions. Cell. 2009;136:215–233. [DOI] [PMC free article] [PubMed] [Google Scholar]
- 3.Chen Y, Wang C, Liu Y, et al. miR-122 targets NOD2 to decrease intestinal epithelial cell injury in Crohn's disease. Biochem Biophys Res Commun. 2013;438:133–139. [DOI] [PubMed] [Google Scholar]
- 4.Chuang AY, Chuang JC, Zhai Z, et al. NOD2 expression is regulated by microRNAs in colonic epithelial HCT116 cells. Inflamm Bowel Dis. 2014;20:126–135. [DOI] [PMC free article] [PubMed] [Google Scholar]
- 5.Ghorpade DS, Sinha AY, Holla S, et al. NOD2-nitric oxide-responsive microRNA-146a activates sonic hedgehog signaling to orchestrate inflammatory responses in murine model of inflammatory bowel disease. J Biol Chem. 2013;288:33037–33048. [DOI] [PMC free article] [PubMed] [Google Scholar]
- 6.Brain O, Owens BMJ, Pichulik T, et al. The intracellular sensor NOD2 induces microRNA-29 expression in human dendritic cells to limit IL-23 release. Immunity. 2013;39:521–536. [DOI] [PubMed] [Google Scholar]
- 7.Wu F, Zikusoka M, Trindade A, et al. MicroRNAs are differentially expressed in ulcerative colitis and alter expression of macrophage inflammatory peptide-2 alpha. Gastroenterology. 2008;135:1624–1635.e24. [DOI] [PubMed] [Google Scholar]
- 8.Wu F, Zhang S, Dassopoulos T, et al. Identification of microRNAs associated with ileal and colonic Crohn's disease. Inflamm Bowel Dis. 2010;16:1729–1738. [DOI] [PMC free article] [PubMed] [Google Scholar]
- 9.Takagi T, Naito Y, Mizushima K, et al. Increased expression of microRNA in the inflamed colonic mucosa of patients with active ulcerative colitis. J Gastroenterol Hepatol. 2010;25 (suppl 1):S129–S133. [DOI] [PubMed] [Google Scholar]
- 10.Fasseu M, Tréton X, Guichard C, et al. Identification of restricted subsets of mature microRNA abnormally expressed in inactive colonic mucosa of patients with inflammatory bowel disease. PLoS One. 2010;5. [DOI] [PMC free article] [PubMed] [Google Scholar]
- 11.Pekow JR, Dougherty U, Mustafi R, et al. miR-143 and miR-145 are downregulated in ulcerative colitis: putative regulators of inflammation and protooncogenes. Inflamm Bowel Dis. 2012;18:94–100. [DOI] [PMC free article] [PubMed] [Google Scholar]
- 12.Huang Z, Shi T, Zhou Q, et al. miR-141 Regulates colonic leukocytic trafficking by targeting CXCL12β during murine colitis and human Crohn's disease. Gut. 2014;63:1247–1257. [DOI] [PubMed] [Google Scholar]
- 13.Feng X, Wang H, Ye S, et al. Up-regulation of microRNA-126 may contribute to pathogenesis of ulcerative colitis via regulating NF-kappaB inhibitor IκBα. PLoS One. 2012;7:e52782. [DOI] [PMC free article] [PubMed] [Google Scholar]
- 14.Baran-Gale J, Fannin EE, Kurtz CL, et al. Beta cell 5'-shifted isomiRs are candidate regulatory hubs in type 2 diabetes. PLoS One. 2013;8:e73240. [DOI] [PMC free article] [PubMed] [Google Scholar]
- 15.Jayaprakash AD, Jabado O, Brown BD, et al. Identification and remediation of biases in the activity of RNA ligases in small-RNA deep sequencing. Nucleic Acids Res. 2011;39:e141. [DOI] [PMC free article] [PubMed] [Google Scholar]
- 16.Sorefan K, Pais H, Hall AE, et al. Reducing ligation bias of small RNAs in libraries for next generation sequencing. Silence. 2012;3:4. [DOI] [PMC free article] [PubMed] [Google Scholar]
- 17.Lin J, Cao Q, Zhang J, et al. MicroRNA expression patterns in indeterminate inflammatory bowel disease. Mod Pathol. 2013;26:148–154. [DOI] [PubMed] [Google Scholar]
- 18.Liu EY, Li M, Wang W, et al. MaCH-admix: genotype imputation for admixed populations. Genet Epidemiol. 2013;37:25–37. [DOI] [PMC free article] [PubMed] [Google Scholar]
- 19.Wu TD, Nacu S. Fast and SNP-tolerant detection of complex variants and splicing in short reads. Bioinformatics. 2010;26:873–881. [DOI] [PMC free article] [PubMed] [Google Scholar]
- 20.Anders S, Huber W. Differential expression analysis for sequence count data. Genome Biol. 2010;11:R106. [DOI] [PMC free article] [PubMed] [Google Scholar]
- 21.Kurtz CL, Peck BCE, Fannin EE, et al. MicroRNA-29 fine-tunes the expression of key FOXA2-activated lipid metabolism genes and is dysregulated in animal models of insulin resistance and diabetes. Diabetes. 2014;63:3141–3148. Available at: http://eutils.ncbi.nlm.nih.gov/entrez/eutils/elink.fcgi?dbfrom=pubmed&id=24722248&retmode=ref&cmd=prlinks. Accessed November 25, 2014. [DOI] [PMC free article] [PubMed] [Google Scholar]
- 22.Cloonan N, Wani S, Xu Q, et al. MicroRNAs and their isomiRs function cooperatively to target common biological pathways. Genome Biol. 2011;12:R126. [DOI] [PMC free article] [PubMed] [Google Scholar]
- 23.Tan GC, Chan E, Molnar A, et al. 5' isomiR variation is of functional and evolutionary importance. Nucleic Acids Res. 2014;42:9424–9435. [DOI] [PMC free article] [PubMed] [Google Scholar]
- 24.Xiao C, Calado DP, Galler G, et al. MiR-150 controls B cell differentiation by targeting the transcription factor c-Myb. Cell. 2007;131:146–159. [DOI] [PubMed] [Google Scholar]
- 25.Kashiyama K, Mitsutake N, Matsuse M, et al. miR-196a downregulation increases the expression of type I and III collagens in keloid fibroblasts. J Invest Dermatol. 2012;132:1597–1604. [DOI] [PubMed] [Google Scholar]
- 26.Song C-Q, Zhang J-H, Shi J-C, et al. Bioinformatic prediction of SNPs within miRNA binding sites of inflammatory genes associated with gastric cancer. Asian Pac J Cancer Prev. 2014;15:937–943. [DOI] [PubMed] [Google Scholar]
- 27.Chung ACK, Huang XR, Meng X, et al. miR-192 mediates TGF-beta/Smad3-driven renal fibrosis. J Am Soc Nephrol. 2010;21:1317–1325. [DOI] [PMC free article] [PubMed] [Google Scholar]
- 28.Oglesby IK, Chotirmall SH, McElvaney NG, et al. Regulation of cystic fibrosis transmembrane conductance regulator by microRNA-145, -223, and -494 is altered in ΔF508 cystic fibrosis airway epithelium. J Immunol. 2013;190:3354–3362. [DOI] [PubMed] [Google Scholar]
- 29.Olaru AV, Selaru FM, Mori Y, et al. Dynamic changes in the expression of microRNA-31 during inflammatory bowel disease-associated neoplastic transformation. Inflamm Bowel Dis. 2011;17:221–231. [DOI] [PMC free article] [PubMed] [Google Scholar]
- 30.Lin J, Welker NC, Zhao Z, et al. Novel specific microRNA biomarkers in idiopathic inflammatory bowel disease unrelated to disease activity. Mod Pathol. 2013;27:602–608. [DOI] [PubMed] [Google Scholar]
- 31.Dalal SR, Kwon JH. The role of microRNA in inflammatory bowel disease. Gastroenterol Hepatol (N Y). 2010;6:714–722. [PMC free article] [PubMed] [Google Scholar]
- 32.Maharshak N, Shenhar-Tsarfaty S, Aroyo N, et al. MicroRNA-132 modulates cholinergic signaling and inflammation in human inflammatory bowel disease. Inflamm Bowel Dis. 2013;19:1346–1353. [DOI] [PubMed] [Google Scholar]
- 33.Tserel L, Runnel T, Kisand K, et al. MicroRNA expression profiles of human blood monocyte-derived dendritic cells and macrophages reveal miR-511 as putative positive regulator of toll-like receptor 4. J Biol Chem. 2011;286:26487–26495. [DOI] [PMC free article] [PubMed] [Google Scholar]
- 34.Xu N, Meisgen F, Butler LM, et al. MicroRNA-31 is overexpressed in psoriasis and modulates inflammatory cytokine and chemokine production in keratinocytes via targeting serine/threonine kinase 40. J Immunol. 2013;190:678–688. [DOI] [PubMed] [Google Scholar]
- 35.Ott CE, Grünhagen J, Jäger M, et al. MicroRNAs differentially expressed in postnatal aortic development downregulate elastin via 3′ UTR and coding-sequence binding sites. PLoS One. 2011;6:e16250. [DOI] [PMC free article] [PubMed] [Google Scholar]
- 36.Zhang P, Huang A, Ferruzzi J, et al. Inhibition of microRNA-29 enhances elastin levels in cells haploinsufficient for elastin and in bioengineered vessels—brief report. Arterioscler Thromb Vasc Biol. 2012;32:756–759. [DOI] [PMC free article] [PubMed] [Google Scholar]
- 37.Primo MN, Bak RO, Schibler B, et al. Regulation of pro-inflammatory cytokines TNFα and IL24 by microRNA-203 in primary keratinocytes. Cytokine. 2012;60:741–748. [DOI] [PubMed] [Google Scholar]
- 38.Martínez-Borra J, López-Larrea C, González S, et al. High serum tumor necrosis factor-alpha levels are associated with lack of response to infliximab in fistulizing Crohn's disease. Am J Gastroenterol. 2002;97:2350–2356. [DOI] [PubMed] [Google Scholar]
- 39.Olaru AV, Yamanaka S, Vazquez C, et al. MicroRNA-224 negatively regulates p21 expression during late neoplastic progression in inflammatory bowel disease. Inflamm Bowel Dis. 2013;19:471–480. [DOI] [PMC free article] [PubMed] [Google Scholar]
- 40.Zhang C, Zhao Z, Osman H, et al. Differential expression of miR-31 between inflammatory bowel disease and microscopic colitis. Microrna. 2015;3:155–159. [DOI] [PubMed] [Google Scholar]
- 41.Ludwig K, Fassan M, Mescoli C, et al. PDCD4/miR-21 dysregulation in inflammatory bowel disease-associated carcinogenesis. Virchows Arch. 2013;462:57–63. [DOI] [PubMed] [Google Scholar]
- 42.Guo Z, Wu R, Gong J, et al. Altered microRNA expression in inflamed and non-inflamed terminal ileal mucosa of adult patients with active Crohn's disease. J Gastroenterol Hepatol. 2015;30:109–116. [DOI] [PubMed] [Google Scholar]
Associated Data
This section collects any data citations, data availability statements, or supplementary materials included in this article.