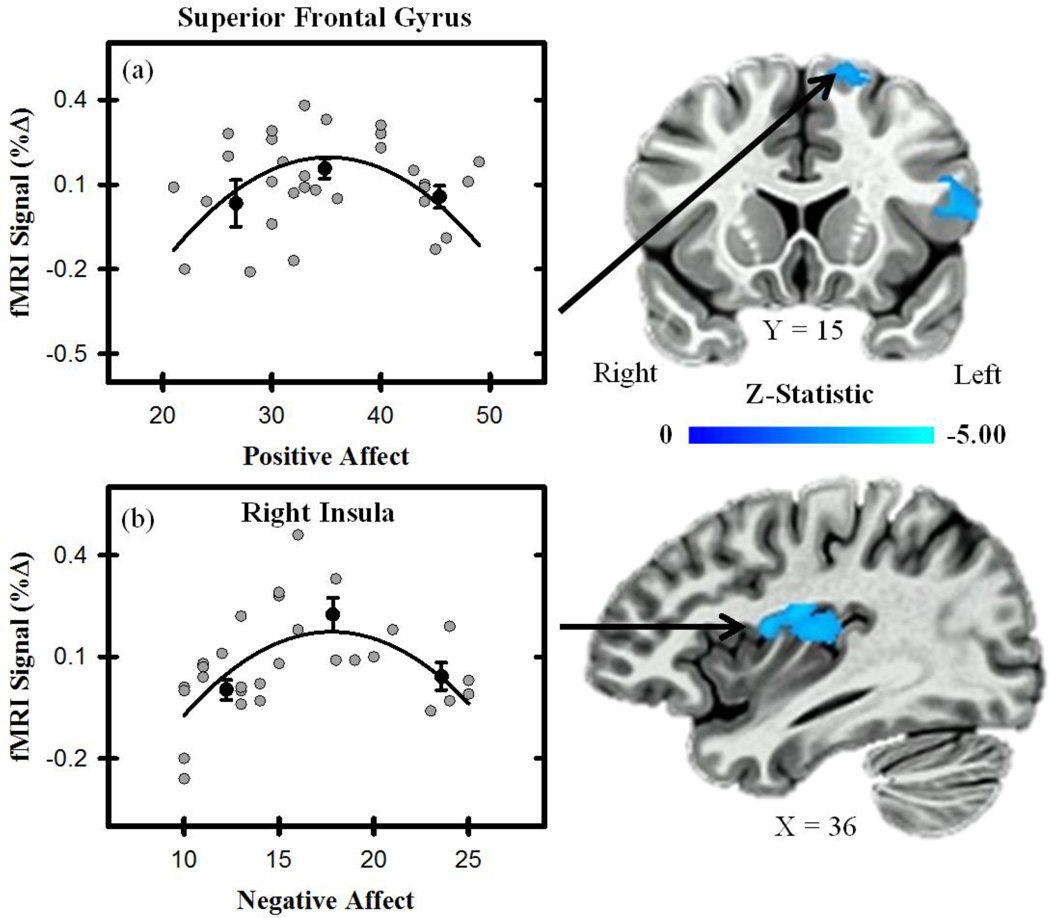
Figure 3.
Unconditioned fMRI signal and affective state. Activity (average to CS+UCS and UCS alone) within the superior frontal gyrus varied curvilinearly with positive affect (a), and activity within the insula varied curvilinearly with negative affect (b). Graphs depict the relationship between fMRI signal (% change) and PANAS (positive and negative affect) scores. Gray dots represent scatter plot of individual participant scores. Black dots represent the % signal change binned by PANAS (positive and negative affect) scores for the top, middle, and bottom third of participants. Error bars reflect the standard error of the mean. Black line represents curvilinear line of best fit.

