

Abstract
Aging is the most important risk factor associated with Alzheimer's disease (AD); however, the molecular mechanisms linking aging to AD remain unclear. Suppression of the ribosomal protein S6 kinase 1 (S6K1) increases healthspan and lifespan in several organisms, from nematodes to mammals. Here we show that S6K1 expression is upregulated in the brains of AD patients. Using a mouse model of AD, we found that genetic reduction of S6K1 improved synaptic plasticity and spatial memory deficits, and reduced the accumulation of amyloid-β and tau, the two neuropathological hallmarks of AD. Mechanistically, these changes were linked to reduced translation of tau and the β-site amyloid precursor protein cleaving enzyme 1, a key enzyme in the generation of amyloid-β. Our results implicate S6K1 dysregulation as a previously unidentified molecular mechanism underlying synaptic and memory deficits in AD. These findings further suggest that therapeutic manipulation of S6K1 could be a valid approach to mitigate AD pathology.
SIGNIFICANCE STATEMENT Aging is the most important risk factor for Alzheimer's disease (AD). However, little is known about how it contributes to AD pathogenesis. S6 kinase 1 (S6K1) is a protein kinase involved in regulation of protein translation. Reducing S6K1 activity increases lifespan and healthspan. We report the novel finding that reducing S6K1 activity in 3xTg-AD mice ameliorates synaptic and cognitive deficits. These improvement were associated with a reduction in amyloid-β and tau pathology. Mechanistically, lowering S6K1 levels reduced translation of β-site amyloid precursor protein cleaving enzyme 1 and tau, two key proteins involved in AD pathogenesis. These data suggest that S6K1 may represent a molecular link between aging and AD. Given that aging is the most important risk factor for most neurodegenerative diseases, our results may have far-reaching implications into other diseases.
Keywords: Aβ, AD, aging, mTOR, plaques, tangles
Introduction
The lack of effective cures or treatments for Alzheimer's disease (AD) is alarming considering the number of people currently affected by this disorder and the projected increase in incidence and prevalence over the next two decades (Alzheimer's Association, 2014). The buildup of amyloid-β (Aβ) and tau is an invariable feature of AD and is believed to contribute to the progressive cognitive deficits associated with this disorder (Querfurth and LaFerla, 2010). Aβ is generated from the amyloid precursor protein (APP), which is sequentially cleaved by the β-site APP cleaving enzymes 1 (BACE-1) and the γ-secretase complex to liberate Aβ. Given the role of BACE-1 in the generation of Aβ, major efforts are underway to develop BACE-1 inhibitors as a possible treatment for AD. Another key event in AD is synaptic dysfunction, which appears to be an early event in disease pathogenesis and precedes neuronal loss (Sheng et al., 2012). Supporting this view, synaptic loss has been reported in the cortex of people with mild cognitive impairment and early AD (Masliah et al., 2001).
Aging is the most important risk factor associated with the development of AD; thus, it is plausible that alterations in selective pathways associated with aging may facilitate the development of this insidious disorder (Moll et al., 2014). The ribosomal protein S6 kinase 1 (S6K1) is a ubiquitously expressed protein involved in several cellular processes, including protein translation and glucose homeostasis (Fenton and Gout, 2011), both of which are altered in AD (Dineley et al., 2014). Overwhelming evidence shows S6K1 as a key regulator of lifespan and healthspan. For example, dominant-negative dS6K increases lifespan in Drosophila (Kapahi et al., 2004), while deletion of S6K1 in mice is sufficient to increase lifespan and decrease the incident of age-dependent motor dysfunction and insulin sensitivity (Selman et al., 2009). Similarly, lack of S6K1 protects mice against age-induced obesity (Um et al., 2004). Given the role of S6K1 in aging and age-related diseases, in this study we sought to determine whether decreasing S6K1 levels could prevent AD-like phenotype developed by the 3xTg-AD mice, a widely used mouse model of AD (Oddo et al., 2003). Specifically, we used a genetic approach to selectively ablate one copy of the S6K1 gene in 3xTg-AD mice. Our results reveal a previously unidentified signaling pathway as a key player in AD pathogenesis and offer a potential therapeutic target for this devastating disorder.
Materials and Methods
Human tissue and mice.
The human tissue was obtained from the Brain and Body Donation Program at the Banner Sun Health Research Institute, a longitudinal clinicopathological study of normal aging and neurodegenerative disorders (Beach et al., 2008). Human cases were selected randomly by personnel of the Brain and Body Donation program among the tissue available. Groups were matched based on their clinical and neuropathological phenotype. The generation of the 3xTg-AD and S6K1 knock-out mice has been described previously (Shima et al., 1998; Oddo et al., 2003). All mice were housed 4–5 per cage at 23°C, kept on a 12 h light/dark cycle, and were given ad libitum access to food and water. In our colony of 3xTg-AD mice, males show a large neuropathological variability, even between littermates. In contrast, female 3xTg-AD mice do not show such large variability and their phenotype changes as a function of age in a predictable manner. Therefore, only female mice were used for the experiments described here. All animal procedures were approved by the Institutional Animal Care and Use Committee of the Banner Sun Health Research Institute and the Institutional Animal Care and Use Committee at the Barrow Neurological Institute for electrophysiological recordings. Mice were assigned to a specific group based on their genotype after birth and there were no other factors that determined group selection. Mice did not receive any other type of treatment before the initiation of the experiments described here. All experiments were performed with the experimenters blinded to genotype.
Morris water maze.
This test was performed in a circular plastic tank of 1.5 m diameter filled with water kept at 25°C. The water was made opaque with nontoxic white paint. A 14-cm-wide platform was kept 1.5 cm under the surface of the water and was invisible to mice. Thus, mice were forced to use extramaze visual cues (located throughout the room) to find the escape platform. The location of the cues and platform were kept in the same place in space throughout the testing period. Mice received four training trials per day for 5 consecutive days. Mice were tested between 9:00 A.M. and 3:00 P.M. Before the first trial of the first day, mice were placed on the platform for 10 s, after which they were placed in the water. Mice were kept in the water until they reached the platform. If a mouse failed to find the platform in 60 s, it was gently guided to the platform location and allowed to stay on it for 20 s. At the end of each trial, mice were placed in a warm holding cage for 25 s before starting the next trial. Twenty-four hours after the last training trial, mice were placed in the pool for a final 60 s probe trial, during which the platform was removed from the water and mice were allowed to freely swim in the tank. Extreme care was taken to minimize animal stress during these procedures. A video camera recorded each mouse, and a tracking system (Ethovision 7.0, Noldus Information Technology) analyzed each mouse's path. The dependent variables for learning were escape latency and swim distance, with less time or swim distance interpreted as better learning. The dependent measures for the probe trials were time spent in the four quadrants and the number of times a mouse crossed the location that previously contained the platform.
Electrophysiology.
Electrophysiological measurements were done in hippocampal slices as described previously (Song et al., 2005; Kimura et al., 2012). Briefly, mice were anesthetized with isoflurane and decapitated. Their brains were rapidly dissected and placed in iced, well oxygenated artificial CSF (ACSF), containing the following (in mm): 117 NaCl; 5.4 KCl; 26 NaHCO3; 1.3 MgSO4; 1.2 NaH2PO4; 2.5 CaCl2; 10 glucose, continuously bubbled with 95% O2–5% CO2. Brain tissue was glued to a cryotome and several 400 μm transverse slices were cut through the hippocampal formation using a vibratome (Vibratome 1000 Plus, Leica). After cutting, slices were incubated in 35°C ACSF first for 30 min and stored in a preincubator (65-0076/BSC-PC, Harvard Apparatus) at room temperature (RT) for ≥1 h before electrophysiological recordings were started. Thereafter, one slice was transferred to a liquid–air interface chamber (Warner Instrument) and suspended on a nylon net at the liquid–air interface in a bath of continuously dripping oxygenated ACSF (2–2.5 ml/min). Humidified ACSF was passed along the upper surface of the slice and bath temperature was set at 30 ± 1°C.
Standard extracellular field potential recordings were performed on coronal hippocampal slice containing CA1 region. Evoked extracellular field potentials were recorded from stratum radiatum using a borosilicate glass capillary pulled to a tip diameter of ∼1 μm, filled with 2 m sodium chloride. A bipolar platinum (0.03 μm diameter) stimulation electrode was placed in Schaffer-collateral-commissural fibers with 0.33 Hz stimulation. After verification of evoked field EPSP (fEPSP) stability for 20 min as the baseline, the experimental protocols were applied. For tetanically induced long-term potentiation (LTP), the theta-burst stimulation, which contains 15 burst trains at 5 Hz (each train contains five pulses at 100 Hz), were applied. Then, the continuous recordings were performed for 60 min using 0.03 Hz stimulation. All electrophysiological signals were recorded using two-channel amplifier (Clamp 2A, Axon Instruments) and data acquisition was performed using Clampex 9.2 (Molecular Devices) with an eight-pole Bessel filter and a 1 kHz low-pass filter, and stored on hard media for subsequent off-line analysis.
Protein extraction.
Human and mouse proteins were prepared as previously described (Orr et al., 2014). Briefly, mice were killed by CO2 asphyxiation and their brains removed and cut in half along the medial longitudinal/sagittal fissure. One hemisphere of the brain was postfixed in 4% paraformaldehyde for 48 h and used for immunohistochemical evaluation. The other hemisphere was flash-frozen on dry ice and used for biochemical experiments and stored at −80°C. The frozen mouse hemispheres as well as 0.1 g of human inferior frontal gyrus tissue were mechanically homogenized in ice-cold T-PER (Thermo Fisher Scientific) protein extraction buffer containing complete protease inhibitor (Roche) and phosphatase inhibitor (Life Technologies). Brain homogenates were ultracentrifuged at 100,000 × g for 1 h at 4°C. The supernatant was recovered and stored at −80°C until used for Western blots and to measure soluble Aβ levels by ELISA. The pellet was resuspended in 70% formic acid, mechanically homogenized, and centrifuged as described above. The supernatant of this second centrifugation was recovered and stored at −80°C until used as the insoluble fraction for ELISA experiments.
Western blot.
Western blots were performed under reducing conditions using precast Novex gels (Life Technologies). Proteins were transferred to nitrocellulose membranes (iBlot, Life Technologies), which were then incubated for 60 min in 5% nonfat powdered milk (Great Value) in Tris-buffered saline with Tween (TBST; 0.1 m Tris, 0.15 m NaCl, and 0.1% Tween 20). Primary antibodies specific to the experiment were then applied overnight at 4°C in 5% milk in TBST. The next day, blots were washed in TBST three times for 10 min and then incubated in the appropriate fluorescent secondary antibody for 1 h at RT. The blots were then washed as describe above, and imaged/quantified using a LI-COR Odyssey CLx (LI-COR Biosciences) attached to a Dell computer (OptiPlex 7010) running Windows 7 and Image Studio (version 1.0.11, LI-COR Biosciences).
Histology.
For immunohistochemistry analysis, hemispheres were fixed in 4% paraformaldehyde for 48 h. Tissue was then sectioned (50 μm thick) using a sliding vibratome, and stored in 0.02% sodium azide in PBS. The endogenous peroxidase activity was quenched with 3% H2O2 in 10% methanol for 30 min. For Aβ1–42 staining, tissue was incubated for 7 min in 95% formic acid to retrieve the epitope. Tissue was incubated overnight at 4°C with an appropriate primary antibody. Sections were washed to remove excess primary antibody and incubated in the appropriate secondary antibody for 1 h at RT. Excess secondary antibody was washed and sections were developed with diaminobenzidine substrate using the avidin–biotin horseradish peroxidase system (Vector Labs).
ELISA.
Aβ40 and Aβ42 levels were assessed via sandwich ELISA using commercially available kits from Life Technologies. Briefly, soluble or insoluble fractions of brain tissue homogenates were processed and read in a plate reader (BioTek) at 450 nm in precoated, flat-bottom 96-well plates according to the kit's instructions. The range of Aβ detection was between ∼10 and 1000 pg/ml. For each assay kit, cross-reactivity with other species of Aβ, APP, or tau was negligible when concentrations were <10 ng/ml. The concentration of Aβ (picograms per milliliter of sample) present in the homogenate was the dependent variable used for statistical analysis.
Quantitative real-time PCR.
Total RNA was extracted from hippocampi of NonTg, 3xTg-AD, 3xTg-AD/S6K1+/−, and S6K1+/− mice using the RNeasy Mini Kit (Qiagen), according to manufacturer's instruction. RNA (500 pg/sample) was reverse-transcribed with the Quantitect Reverse Transcription Kit (Qiagen). After cDNA synthesis, quantitative PCR (qPCR) was performed using the SYBR Green Master Mix (Biorad) with the following gene-specific primers (0.3 pmol/μl): BACE-1: forward, 5′-GGACAACCTGAGGGGAAAGT-3′; reverse, 5′-CGGAGGTCTCGATATGTGCT-3′; β-actin: forward, 5′-GGCTCTTTTCCAGCCTTCCT-3′; reverse, 5′-ATGCCTGGGTACATGGTGGT-3′; mAPP: forward, 5′-GTGATCTACGAGCGCATGAA-3′; reverse, 5′-CGTCGTTTCCGTAGCTGATT-3′; mTau: forward, 5′-AGCCCTAAGACTCCTCCA-3′; reverse, 5′-TGCTGTAGCCGCTTCGTTCT-3′. All primers were designed specifically for mouse mRNA using the Ensembl database (www.ensembl.org), validated by PCR and in silico PCR, which confirmed specificity for mouse but not human genes.
Polysome profiling.
The polysome fractionation was performed as described previously (Gandin et al., 2014). Briefly, hippocampi from NonTg, 3xTg-AD, 3xTg-AD/S6K1+/−, and S6K1+/− mice were homogenized in hypotonic buffer (5 mm Tris-HCl, pH 7.5, 2.5 mm MgCl2, 1.5 mm KCl, protease inhibitor, 0.1 mg/ml cycloheximide, 2 mm DTT, 0.2 U/μl Rnasin, 0.5% Triton X-100, 0.5% sodium deoxycholate). The lysates were loaded onto a 10–50% sucrose gradient and centrifuged using a SW41Ti rotor at 36,000 rpm for 2 h. RNA was extracted from each fraction using Trizol (Life Technologies) according to manufacturer's instruction. RNA was then run on the Agilent 2100 Bioanalyzer (using the RNA nanochip) to evaluate RNA distribution. RNA (500 pg/sample) was reverse-transcribed with the Quantitect Reverse Transcription Kit (Qiagen). After cDNA synthesis, qPCR was performed as described above. Ct values of the gene of interest were normalized to the corresponding Ct (cycle threshold) values obtained from the input sample for the same animal. ΔCt values were obtained by subtracting the Ct of the gene of interest to the Ct value of β-actin. ΔΔCt values were obtained by subtracting the ΔCt values of the gene of interest in 3xTg-AD, 3xTg-AD/S6K1+/−, and S6K1+/− to the ΔCt values of NonTg mice. Fold change represents 2 power (−ΔΔCt).
BACE-1 activity.
BACE-1 enzymatic activity was measured using a kit from Abcam (catalog #ab65387), following the manufacturer's recommendations. All reagents used were provided with the kit. Briefly, hippocampi were homogenized in 200 μl of extraction buffer. The homogenized tissue was left on ice for 10 min and centrifuged at 10,000 × g for 5 m at 4°C. The supernatant was used to measure BACE-1 activity. One hundred micrograms of protein per sample were loaded into each well of a 96-well plate (experiments were run in duplicates). Samples were incubated with 2 μl of BACE-1 substrate for 1 h at 37°C in the dark. Plates were then read using a fluorescent plate reader with an excitation of 335–355 nm and emission of 495–510 nm.
S6K1 activity.
S6K1 activity was measured using a kit from Enzo Life Sciences (catalog #ADI-EKS-470), following the manufacturer's specifications. All the buffers and reagents used were part of the kit. Briefly, frozen brains were homogenized as described in the Western blot section. Samples were diluted in dilution buffer (mouse tissue, 1:20; human tissue, 1:10). Ninety-six-well plates, precoated with the S6K1 substrate, were soaked with 30 μl of kinase assay dilution buffer. After adding the samples to each well (in duplicate), reactions were started by 10 μl of ATP per each well. Plates were then incubated at 30°C for 60 min. After the incubation, plates were emptied and 40 μl of the phosphorylation-specific substrate antibody was added to each well. Plates were incubated an additional 60 min at RT. After this incubation, plates were washed four times with 1× wash buffer and incubated for 30 min at RT with anti-rabbit IgG HRP-conjugate antibody. Subsequently, plates were washed four times in 1× wash buffer and incubated with 3,3′,5,5′-tetramethylbenzidine (60 μl per well) at RT for 15 min. The chromogen reaction was terminated by the addition of acid stop solution (20 μl per well). Absorbance was recorded at 450 nm.
Proteasome activity.
Proteasome activity was assessed by incubating 10 μl of brain homogenate with proteasomal substrates Suc-LLVY-AMC, Bz-VGR-AMC, and Z-LLE-AMC (Enzo Life Sciences), which probe for chymotrypsin-like, trypsin-like, and caspase-like activities, respectively. Reactions were performed in 200 μl of assay buffer (25 mm HEPES, pH 7.5, 0.5 mm EDTA, 0.05% NP-40) using black 96-well plates. Substrates were added immediately before readings. Kinetic readings were taken at 37°C every 1.5 min for 60 min (excitation, 360 nm; emission, 460 nm) using the Synergy HT multimode microplate reader with Gen5 software (BioTek). Readings were normalized to total protein concentrations assayed via a Coomassie Protein Assay Kit (Bradford, Thermo Scientific) following the manufacturer's instructions.
Antibodies.
All of the antibodies used in this study were validated by the manufacturers for use in mouse and/or human tissue (see manufacturers' webpages). Antibodies from Cell Signaling Technology were as follows: total p70S6K (dilution 1:1000, catalog #9202), p70S6K Thr389 (dilution 1:1000, catalog #9204), β-actin (dilution 1:10000, catalog #3700), PSD95 (dilution 1:1000, catalog #2507), eEF2K (dilution 1:000, catalog #3691), rpS6 (dilution 1:1000, catalog #5364), Atg3 (dilution 1:1000, catalog #3415), Atg5 (dilution 1:1000, catalog #2630), Atg7 (dilution 1:1000, catalog #2631), Atg12 (dilution 1:1000, catalog #2010). Antibodies from Millipore were as follows: anti-Aβ42 (dilution 1:200, catalog #AB5078P), p62 (dilution 1:1000, catalog #MABC32), CT20 (dilution 1:3000, catalog #171610), and synaptophysin (dilution 1:1000, catalog #MAB5258). BioLegend provided 6E10 (dilution 1:3000, catalog #SIG-39320). Thermo Fisher Scientific provided HT7 (dilution 1:3000, catalog #MN1000). Antibodies TG3 (dilution 1:1000) and CP13 (dilution 1:000) were a gift from Dr. Peter Davies.
Statistical analyses.
Examination of the data evaluated via mixed (repeated measures) ANOVAs revealed no violations of any assumptions that would warrant using a statistical test other than the ones described. Assumptions were tested via conventional methods using SPSS 18 (IBM). These included normality (Shapiro–Wilk, p's > 0.10), homogeneity of variance (Levene's test, p's > 0.05), and sphericity (Mauchly's test, p's > 0.26). LTP data were analyzed by a two-way mixed ANOVA followed by a post hoc multiple comparisons based on Holm–Sidak using SigmaStat V 3.5 (Systat Software). Learning data were analyzed by a two-way mixed ANOVA, followed by Bonferroni's corrected post hoc tests using GraphPad Prism 5 (GraphPad Software). Probe trials were analyzed by an omnibus one-way ANOVA, followed by Bonferroni's corrected post hoc tests. Proteasome activity was analyzed by an omnibus two-way ANOVA. An omnibus one-way ANOVA followed by Bonferroni's corrected or Tukey's post hoc tests were used to analyze select comparisons with more than two groups (e.g., Western blots and S6K1 activity in mice), as specified in the results section. A two-tailed unpaired t test was used to analyze select pairwise comparisons (e.g., Western blots in human cases and histology), as specified in the results section. These analyses were performed using either SPSS 18 or GraphPad Prism 5. Relationships among bivariate data were assessed via one predictor linear regression and simple correlations (i.e., Pearson product–moment correlations). A priori power analyses were not performed but our sample sizes are similar to those reported in previously published papers (Ma et al., 2013; Caccamo et al., 2014). Where representative images are shown, statistical analyses were performed on the entire sample as indicated in each figure legend.
Results
Reducing S6K1 levels prevents synaptic deficits in 3xTg-AD mice
The S6K1 gene encodes two proteins, the p70S6K1 and the p85S6K1 (Reinhard et al., 1992). The former is the most predominant species, which is mainly localized in the cytoplasm; the latter is less abundant and is mainly localized in the nucleus (Reinhard et al., 1992; Fenton and Gout, 2011). Given the role of S6K1 in aging and age-related diseases (Kapahi et al., 2004; Um et al., 2004; Selman et al., 2009; Rajapakse et al., 2011), we first measured the total and phosphorylated S6K1 levels in the inferior frontal gyrus of human AD and control brains (Table 1). While the levels of total S6K1 were similar between these two groups (Fig. 1A,B), we found that the levels of S6K1 phosphorylated at Thr389 (S6K1-Thr389), indicative of the activated state of the protein (Pearson et al., 1995), were 68.75 ± 24.42% higher in AD patients compared with control cases (p = 0.008; Fig. 1A,C). We also measured S6K1 enzymatic activity and found that it was significantly higher in AD brains when compared with control cases (p < 0.0001; Fig. 1D). We then sought to determine whether S6K1 activity correlated with Aβ42 levels as well as the Mini Mental State Examination (MMSE) score, a commonly used test to assess cognitive impairments (Pangman et al., 2000). Given that S6K1 levels and activity were obtained from proteins extracted from 0.1 g of inferior frontal gyrus, we used the same protein homogenate to measure Aβ42 levels (Table 1), and did not rely on the Aβ load throughout the whole brain. As expected, the levels of Aβ42 were significantly higher in AD cases compared with control cases (Table 1). We found a significant positive correlation between S6K1 activity and total Aβ42 levels in AD cases (r = 0.48, p < 0.05; Fig. 1E). In addition, in AD brains, we found an inverse correlation between S6K1 activity and the MMSE scores (r = −0.39, p < 0.05; Fig. 1F). In contrast, in control brains, there was no correlation between S6K1 activity and total Aβ42 levels and MMSE (Fig. 1G,H). These findings indicate that the buildup of Aβ may contribute to an increase in S6K1 activity, which is consistent with our earlier report showing that naturally secreted Aβ oligomers were sufficient to increase S6K1 phosphorylation in wild-type mice (Caccamo et al., 2011).
Table 1.
Case statistics
| Cognitively normal (n or M ± SEM) | AD (n or M ± SEM) | N or df | t | Cohen's d | |
|---|---|---|---|---|---|
| Male and female cases | 11 male; 6 female | 8 male; 10 female | 35 | ||
| Cases per Braak stage | I, 55; II, 12 | V, 8; VI, 10 | 35 | ||
| Age at death (years) | 82.12 ± 1.55 | 81.78 ± 1.95 | 33 | −0.34 | −0.05 |
| Postmortem interval (years) | 3.05 ± 0.19 years | 3.05 ± 0.26 years | 16 | <0.00 | <0.00 |
| MMSE | 27.06 ± 1.54 | 12.11 ± 2.27 | 33 | −5.39 | −1.88* |
| Soluble Aβ42 (pg/μl) | 89.01 ± 26.75 | 306.01 ± 32.86 | 33 | 9.68 | 1.77* |
| Insoluble Aβ42 (pg/μl) | 8.93 ± 2.27 | 1483.99 ± 148 | 33 | 11.35 | 3.37* |
| Total Aβ42 (pg/μl) | 97.94 ± 28.35 | 1789.99 ± 142.21 | 33 | 11.35 | 3.95* |
| Tau-PHF1 (percentage cognitively normal) | 8.05 ± 1.28 | 33.69 ± 9.39 | 33 | 2.63 | 0.91* |
Aβ levels were measured by sandwich ELISA and tau levels were measured by Western blot in the tissue used for the experiments described here.
*p < 0.05.
Figure 1.

S6K1 activity correlates with Aβ levels and MMSE scores. A, Representative Western blots of proteins extracted from the inferior frontal gyrus of AD and control (CTL) cases. The blots were probed with the indicated antibodies. B, C, Quantitative analyses of the arbitrary fluorescent units of the blots indicated that total S6K1 levels were similar between AD and CTL cases (t(33) = 0.42, p > 0.05). In contrast, the levels of S6K1-pThr389 were significantly higher in AD compared with CTL cases (t(33) = 2.81, p = 0.008). D, S6K1 enzymatic activity was significantly higher in AD brains compared with CTL cases (t(33) = 4.48, p < 0.0001). E–H, Scatter plots analyzed by linear regression displaying the correlation between S6K1 activity and total Aβ42 levels and between S6K1 activity and MMSE scores in AD and CTL cases. Higher S6K1 activity positively correlated with higher levels of total Aβ42 in AD but not in CLT brains. A negative correlation was also evident between S6K1 activity and MMSE scores in AD but not in CTL brains. Western blot data were obtained by normalizing the arbitrary fluorescent unit of the protein of interest to β-actin (used as a loading control). Data in B–D were analyzed by unpaired t test. For each experiment shown, n = 17 brains for CTL and n = 18 brains for AD cases. Error bars represent mean ± SEM.
To study the role of S6K1 in the pathogenesis of AD, we crossed 3xTg-AD mice with S6K1 knock-out mice to obtain and study mice with the following four genotypes: (1) 3xTg-AD; (2) 3xTg-AD;S6K1+/−; (3) S6K1+/−; and (4) NonTg. We first measured S6K1 activity in 15-month-old mice and found that it was significantly different among the four genotypes (p < 0.0001; Fig. 2A). A post hoc test with Bonferroni's correction showed that S6K1 activity was higher in 3xTg-AD mice compared with all the other genotypes. S6K1 activity was similar between NonTg and 3xTg-AD/S6K1+/−, while S6K1+/− mice had the lowest S6K1 activity among the four groups. These data indicate that removing one copy of the S6K1 gene restored S6K1 activity in 3xTg-AD mice to NonTg levels. Consistent with these findings, we previously reported that S6K1 signaling was also increased in the brains of 3xTg-AD mice (Caccamo et al., 2010, 2014). To further assess changes in S6K1 function, we measured the levels of total and phosphorylated S6K1 (at Thr389) by Western blot. We found that total S6K1 levels were significantly lower in the two groups lacking one copy of the S6K1 gene (p < 0.0001; Fig. 2B,C). The levels of S6K1 phosphorylated at Thr389 were also significantly different among the four groups (p < 0.0001; Fig. 2B,D). A post hoc test with Bonferroni's correction showed that the levels of phosphorylated S6K1 were higher in 3xTg-AD mice compared with all the other genotypes. While phosphorylated S6K1 levels in S6K1+/− mice were the lowest among all the groups, they were similar between NonTg and 3xTg-AD/S6K1+/−.
Figure 2.

Reduced S6K1 signaling in 3xTg-AD/S6K1+/− mice. A, The graph shows S6K1 enzymatic activity across the four groups. The values were significantly different among the groups (p < 0.001; F(3,28) = 14.15). Post hoc tests indicated that S6K1 activity in 3xTg-AD mice was significantly different than NonTg mice (p < 0.01, t = 3.63), 3xTg-AD/S6K1+/− mice (p < 0.05, t = 3.03), and S6K1+/− mice (p < 0.01, t = 6.49). Further, S6K1 activity in NonTg mice was similar to that in 3xTg-AD/S6K1+/− mice (p > 0.05, t = 0.60) and significantly different from that in S6K1+/− mice (p < 0.05, t = 2.85). Finally, S6K1 activity in 3xTg-AD/S6K1+/− mice was different from that in S6K1+/− mice (p < 0.05, t = 3.45). B, Representative Western blots of protein extracted from the brains of NonTg, 3xTg-AD, 3xTg-AD/S6K1+/−, and S6K1+/− mice. Blots were probed with the indicated antibodies. C, Quantitative analyses of the blots probed for total S6K1. The values were significantly different among the groups (p < 0.0001; F(3,28) = 15.01). Post hoc tests indicated that total S6K1 levels in NonTg mice were significantly different from those in 3xTg-AD/S6K1+/− (p < 0.01, t = 3.80) and S6K1+/− mice (p < 0.01, t = 4.10). In contrast, no difference was found between NonTg and 3xTg-AD mice (p > 0.05, t = 1.37). Total S6K1 levels in 3xTg-AD mice were significantly different from those in 3xTg-AD/S6K1+/− mice (p < 0.01, t = 5.18) and S6K1+/− mice (p < 0.01, t = 5.48). Finally, total S6K1 levels were similar between 3xTg-AD/S6K1+/− and S6K1+/− mice (p > 0.05, t = 0.30). D, The levels of S6K1 phosphorylated at Thr389 (pThr389) was significantly different among the four groups (p < 0.0001; F(3,28) = 57.48). Post hoc tests indicated that S6K1-pThr389 levels in 3xTg-AD mice were significantly different from those in NonTg mice (p < 0.01, t = 9.11), 3xTg-AD/S6K1+/− mice (p < 0.01, t = 8.30), and S6K1+/− mice (p < 0.01, t = 12.67). S6K1-pThr389 levels in NonTg mice were similar to those in 3xTg-AD/S6K1+/− mice (p > 0.05, t = 0.81) but statistically different from those in S6K1+/− mice (p < 0.01, t = 3.57). Finally, S6K1-pThr389 levels in 3xTg-AD/S6K1+/− mice were statistically different from those in S6K1+/− mice (p < 0.01, t = 4.37). E, The graph shows total levels of eEF2K. No differences were found among the four groups (p > 0.05; F(3,28) = 0.10). F, The graph shows eEF2K levels phosphorylated at Ser366 (eEF2K-pSer366). The values were different among the four groups (p < 0.0001; F(3,28) = 19.66). Post hoc tests indicated that the eEF2K-pSer366 levels in NonTg mice were significantly different from those in 3xTg-AD mice (p < 0.01, t = 5.03), but not from those in 3xTg-AD/S6K1+/− (p > 0.05, t = 1.38) or S6K1+/− mice (p > 0.05, t = 2.48). In 3xTg-AD mice, the eEF2K-pSer366 levels were significantly different compared with those in 3xTg-AD/S6K1+/− (p < 0.01, t = 3.65) and S6K1+/− mice (p < 0.01, t = 7.51). eEF2K-pSer366 levels were also different between 3xTg-AD/S6K1+/− and S6K1+/− mice (p < 0.01, t = 3.86). G, The graph shows total levels of rpS6. No difference was evident among the four groups (p > 0.05; F(3,28) = 1.24). H, The graph shows rpS6 levels phosphorylated at Thr235/236 (pThr235/236). The values were different among the four groups (p < 0.0001; F(3,28) = 20.29). Post hoc tests indicated that the rpS6-pThr235/236 levels in NonTg mice were significantly different compared with those in 3xTg-AD mice (p < 0.01, t = 5.17), but not when compared with those in 3xTg-AD/S6K1+/− (p > 0.05, t = 1.86) or S6K1+/− mice (p > 0.05, t = 2.38). rpS6-pThr235/236 levels in 3xTg-AD mice were significantly different compared with those in 3xTg-AD/S6K1+/− (p < 0.05, t = 3.30) and S6K1+/− mice (p < 0.01, t = 7.55). rpS6-pThr235/236 levels were also different between 3xTg-AD/S6K1+/− and S6K1+/− mice (p < 0.01, t = 4.24). Western blot data were obtained by normalizing the arbitrary fluorescent unit of the protein of interest to β-actin (used as a loading control). Data were analyzed by one-way ANOVA followed by Bonferroni's post hoc tests. For each experiment shown, n = 8 mice/genotype. Error bars represent mean ± SEM.
The primary role of S6K1 is to regulate protein synthesis; several downstream effectors of S6K1 mediate its function (Magnuson et al., 2012). For example, S6K1 directly phosphorylates the eukaryotic elongation faction-2 kinase (eEF2K) at Ser366. Additionally, S6K1 phosphorylates the ribosomal protein S6 (rpS6) at Ser235/236 (Magnuson et al., 2012). eEF2K and rpS6 are known to regulate translation elongation and ribosomal biogenesis, respectively (Magnuson et al., 2012). To determine whether reducing S6K1 levels alters downstream pathways, we measured the levels of total and phosphorylated eEF2K and rpS6. Total eEF2K levels were not statistically different among the four groups (Fig. 2B,E). In contrast, we found that the levels of eEF2K phosphorylated at Ser366 were significantly different among the groups (p < 0.0001; Fig. 2B,F). A post hoc test with Bonferroni's correction indicated that these changes mirrored the changes in S6K1 activity, with the 3xTg-AD mice having the highest levels and the S6K1+/− mice the lowest. Furthermore, total rpS6 levels were similar among the four groups (Fig. 2B,G). However, the levels of rpS6 phosphorylated at Thr235/236 were significantly different among the four groups (p < 0.0001; Fig. 2B,H). A post hoc test with Bonferroni's correction indicated that the phosphorylated levels of rpS6 were significantly different in 3xTg-AD mice compared with all the other groups. Notably, no differences were found between NonTg and 3xTg-AD/S6K1+/− mice, and between NonTg and S6K1+/− mice. Given that mammalian target of rapamycin (mTOR)/S6K1 signaling is necessary for proper learning and memory and hyperactive mTOR is detrimental, we designed our breeding strategy to reduce but not abolish S6K1 activity in the 3xTg-AD mice. Indeed, S6K1 activity and signaling in 3xTg-AD/S6K1+/− mice were similar to S6K1 activity and signaling in NonTg mice.
To investigate basal synaptic transmission, we generated input–output (I/O) curves by measuring fEPSPs elicited in CA1 by stimulation of the Schaffer collaterals at increasing stimulus intensities. We found a statistically significant change in the I/O curves of the four groups (p < 000.1; Fig. 3A). Tukey's post hoc tests revealed the I/O curves of NonTg and S6K1+/− mice were similar between each other but significantly different from the I/O curves of 3xTg-AD and 3xTg-AD/S6K1+/− mice. We next investigated paired-pulse facilitation, a measure of short-term plasticity. We found a significant difference in the amount of facilitation among the four groups (p < 0.05; Fig. 3B). A post hoc test with Bonferroni's correction indicated that only the 3xTg-AD and S6K1+/− groups were significantly different from each other. Together, these data highlight a dissociation between basic synaptic transmission and S6K1 activity.
Figure 3.

Reduced S6K1 signaling rescued synaptic deficits in 3xTg-AD mice. A, I/O curves were obtained by measuring fEPSPs elicited in CA1 by stimulation of the Schaffer collaterals at increasing stimulus intensities. We analyzed the slopes of each curve and found that they were statistically different from each other (F(3,28) = 51.40; p < 0.0001). Post hoc tests indicated that the I/O curve of NonTg mice was statistically significant from that of 3xTg-AD mice (p < 0.01, q = 12.39) and 3xTg-AD/S6K1+/− mice (p < 0.01, q = 11.68), but not from that of S6K1+/− mice (p > 0.05, q = 0.72). The I/O curve of 3xTg-AD mice was statistically significant compared with that of S6K1+/− mice (p < 0.01, q = 13.11), but not compared with that of 3xTg-AD/S6K1+/− mice (p > 0.05, q = 0.71). Last, the I/O curves of 3xTg-AD/S6K1+/− and S6K1+/− were significantly different from each other (p < 0.01, q = 12.40). B, The graph shows the amount of paired-pulse facilitation (PPF) across the four groups (F(3,56) = 3.05; p = 0.036). Post hoc tests indicated that the only statistically significant difference was between 3xTg-AD and S6K1+/− mice (p < 0.05, q = 3.96). C, Hippocampal LTP measured from 3xTg-AD, 3xTg-AD/S6K1+/−, S6K1+/−, and NonTg mice. D, Cumulative data analyzed by one-way ANOVA showing the mean fEPSP slope 5 min after tetanic stimulation. Compared with NonTg mice, 3xTg-AD mice showed significant reduction of LTP (p < 0.001; F(3,50) = 8.06). In addition, LTP in 3xTg-AD;S6K1+/− mice was significantly higher than that in 3xTg-AD mice (p < 0.01), and it was similar to LTP from NonTg mice (p > 0.05). Data were recorded from NonTg (n = 13 slices from 5 mice), 3xTg-AD (n = 15 slices from 6 mice), 3xTg-AD/S6K1+/− (n = 16 slices from 5 mice), and S6K1+/− (n = 10 from 5 mice). E–L, Representative confocal microphotographs of CA1 and CA3 sections from NonTg (n = 3 mice), 3xTg-AD (n = 6 mice), 3xTg-AD/S6K1+/− (n = 6 mice), and S6K1+/− (n = 3 mice). Sections were stained with an anti-synaptophysin antibody. M, N, Quantitative analysis of five images per tissue section of CA1 and CA3 through the z-axis (3 μm step). The data represent the total number of puncta across the five images. Synaptophysin immunoreactivity was significantly different among the four groups (CA1: p = 0.05, F(3,14) = 3.21; CA3: p = 0.017, F(3,14) = 4.80). Post hoc tests indicated that in both hippocampal subregions the only statistically significant difference was between 3xTg-AD and 3xTg-AD/S6K1+/− mice (CA1: p < 0.05, t = 3.07; CA3: p < 0.05, t = 3.77). Data in A and B were analyzed by one-way ANOVA followed by Tukey's multiple-comparison test. Data in C and D were analyzed by a two-way mixed ANOVA followed by a post hoc multiple comparisons based on Holm–Sidak. Data in M and N were analyzed by one-way ANOVA followed by Bonferroni's post hoc tests. Error bars represent mean ± SEM.
We examined LTP, a form of plasticity thought to underlie learning and memory, in Schaffer collateral-CA1 synapses using hippocampal slices. We found that LTP was significantly impaired in 3xTg-AD mice compared with NonTg mice (p < 0.001; Fig. 3C). Notably, removing one copy of the S6K1 gene from the 3xTg-AD mice was sufficient to rescue the LTP deficits (Fig. 3C). Indeed, LTP in 3xTg-AD/S6K1+/− mice was similar to that in NonTg mice and significantly different from that in 3xTg-AD mice (p < 0.01). We also found that S6K1+/− mice demonstrated a similar level of LTP as NonTg and 3xTg-AD/S6K1+/− mice. The mean fEPSP slopes (normalized to baseline) 5 min after tetanic stimulation were 1.69 ± 0.08, 1.29 ± 0.04, 1.64 ± 0.06, and 1.65 ± 0.09 for NonTg, 3xTg-AD, 3xTg-AD/S6K1+/−, and S6K1+/− mice, respectively (Fig. 3D).
To determine whether the LTP improvement corresponded to changes in synaptic markers, we measured synaptophysin immunoreactivity in CA1 and CA3 (Fig. 3E–N). To better quantify these changes, we analyzed five images per each section, per brain region (3–6 mice/genotype). We found that the total number of synaptophysin puncta was significantly different among the four groups (p < 0.05 in both CA1 and CA3; Fig. 3M,N). A post hoc test with Bonferroni's correction indicated that in both CA1 and CA3, the 3xTg-AD/S6K1+/− mice had significantly more synaptophysin puncta when compared with 3xTg-AD mice. While our data are not meant to suggest a causal relationship between synaptophysin levels and LTP deficits, these results implicate S6K1 as a key protein in the hippocampal synaptic deficit found in 3xTg-AD mice.
Reducing S6K1 levels rescues spatial memory deficits in 3xTg-AD mice
To determine the effect of removing one copy of the S6K1 gene on spatial memory deficits developed by the 3xTg-AD mice, we tested 15-month-old mice on the spatial version of the Morris water maze. We gave mice four training trials per day for 5 consecutive days to learn the location of a hidden platform using distal extramaze cues. The distance traveled and the escape latency to find the platform across the training trials are indicators of mouse learning, with less distance and less time interpreted as better performance. Using a mixed ANOVA, we found that for the distance traveled there was a significant effect for days (p < 0.0001) and genotype (p < 0.0001) as well as a significant genotype × day interaction (p < 0.002; Fig. 4A). The effect of day indicated that all mice learned the task across days whereas the effect of genotype indicated that one or more genotypes had a different pace of learning from each other. A post hoc test with Bonferroni's correction showed that 3xTg-AD/S6K1+/− mice performed significantly better than 3xTg-AD mice on day 5 (p < 0.01; Fig. 4A). Notably, the 3xTg-AD/S6K1+/− mice after 3, 4, and 5 d of training performed as well as NonTg and S6K1+/− mice (Fig. 4A). We obtained similar results when we analyzed the escape latency as we found a significant effect for days (p < 0.0001) and genotype (p = 0.008; Fig. 4B). A post hoc test with Bonferroni's correction showed that 3xTg-AD mice were significantly impaired on day 5 compared with NonTg mice (p < 0.01; Fig. 4B). Most notably, on day 5, the 3xTg-AD/S6K1+/− mice performed significantly better than 3xTg-AD mice (p < 0.05) and as well as NonTg mice (p > 0.05; Fig. 4B).
Figure 4.
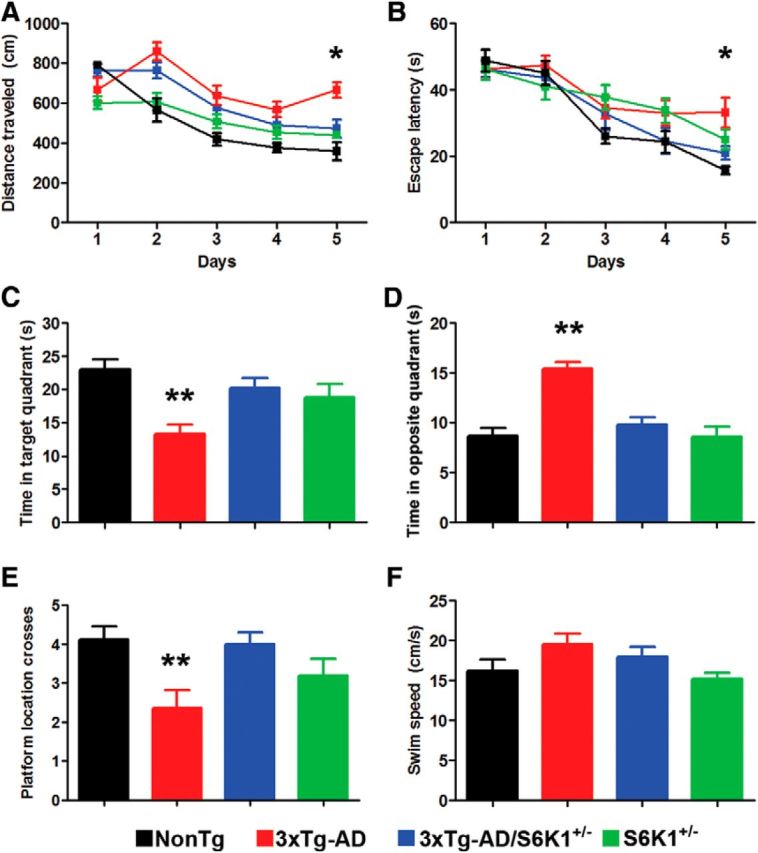
Reducing S6K1 levels improves spatial learning and memory deficits in 3xTg-AD mice. A, B, Learning curves of mice trained in the spatial reference version of the Morris water maze (NonTg, n = 10 mice; S6K1+/−, n = 10 mice; 3xTg-AD, n = 14 mice; 3xTg-AD/S6K1+/−, n = 14 mice). The distance traveled and the escape latency to find the hidden platform was plotted against the days of training. The values for each day represent the average of four training trails. For the distance traveled, we found significant effects for day (p < 0.0001, F(3,43) = 23.81), genotype (p < 0.0001, F(3,43) = 15.99), and genotype × day interaction (p = 0.0018, F(12,172) = 2.74). For the escape latency, we found significant effects for day (p < 0.0001, F(3,43) = 32.19) and genotype (p = 0.008, F(3,43) = 4.01). Post hoc tests indicated that the distance traveled was higher in 3xTg-AD mice compared with NonTg mice on day 2 (p < 0.001, t = 4.38), day 3 (p < 0.01, t = 3.27), day 4 (p < 0.05, t = 2.85), and day 5 (p < 0.001, t = 4.57). However, the 3xTg-AD/S6K1+/− mice performed significantly worse than NonTg mice only on day 2 (p < 0.05, t = 2.91). Further, the distance traveled between 3xTg-AD and 3xTg-AD/S6K1+/− was significantly different on day 5 (p < 0.01, t = 3.20). The escape latency of NonTg mice was significantly different compared with 3xTg-AD mice at day 5 (p < 0.01, t = 3.47). However, 3xTg-AD/S6K1+/− mice performed as well as NonTg mice (day 5: p > 0.05, t = 1.03). Notably, the escape latency and distance traveled was not statistically different between NonTg and S6K1+/− mice. C, Time mice spent in the target quadrant during a single 60 s trial. We found a significant difference among the groups (p = 0.001, F(3,43) = 6.52). Bonferroni's corrected post hoc tests showed that 3xTg-AD mice performed significantly worse when compared with NonTg mice (p < 0.05, t = 4.14). More importantly, the 3xTg-AD/S6K1+/− mice performed significantly better than 3xTg-AD mice (p < 0.05, t = 3.30) and as well as NonTg mice (p > 0.05, t = 2.42). D, Time mice spent in the opposite quadrant during a single 60 s trial. We found a significant difference among the groups (p < 0.0001, F(3,43) = 18.06). Post hoc tests showed that 3xTg-AD mice performed significantly worse when compared with NonTg mice (p < 0.05, t = 5.80). More importantly, the 3xTg-AD/S6K1+/− mice performed significantly better than 3xTg-AD mice (p < 0.05, t = 5.46) and as well as NonTg mice (p > 0.05, t = 0.98). E, Number of platform location crosses during a single 60 s probe trial. We found a significant difference among the groups (p = 0.007, F(3,43) = 4.52). Post hoc tests showed that 3xTg-AD mice performed significantly worse than NonTg mice (p < 0.05, t = 3.01). In contrast, 3xTg-AD/S6K1+/− mice performed significantly better than 3xTg-AD mice (p < 0.05, t = 3.19) and as well as NonTg mice (p > 0.05, t = 0.19). F, Swim speed was similar among the four different groups (p > 0.05, F(3,43) = 2.38). Learning data were analyzed by two-way ANOVA; probe trials were analyzed by one-way ANOVA. Bonferroni's was used for post hoc tests. Asterisk indicates a significant difference between 3xTg-AD and 3xTg-AD/S6K1+/− mice. Error bars represent mean ± SEM.
Twenty-four hours after the last training trial, we conducted probe trials to measure spatial reference memory. Specifically, we measured the time mice spent in the target and opposite quadrants as well as the number of platform location crosses during a single 60 s trial. We found that 3xTg-AD mice spent significantly less time in the target quadrant and more time in the opposite quadrant compared with the other three genotypes (p = 0.001; Fig. 4C,D). For the number of platform location crosses, we found that 3xTg-AD mice performed significantly worse when compared with the other three groups (p = 0.007; Fig. 4E). In contrast, the swim speed was not statistically significant among the four genotypes (Fig. 4F), indicating that the genotype effects on learning and memory were independent of physical performance. Together, these findings indicate that removing one copy of the S6K1 gene from 3xTg-AD mice is sufficient to rescue spatial learning and memory deficits.
Removing one copy of the S6K1 gene lowers Aβ and tau pathology in 3xTg-AD mice
A key neuropathological feature of AD is the accumulation of neurofibrillary tangles made of hyperphosphorylated tau, a microtubule-binding protein (Querfurth and LaFerla, 2010). To determine the effects of removing one copy of the gene encoding S6K1 from the 3xTg-AD mice, we first immunostained sections from 3xTg-AD and 3xTg-AD/S6K1+/− mice with CP13, an antibody that recognizes tau phosphorylated at serine 202. We found that CP13 immunoreactivity was markedly reduced in 3xTg-AD/S6K1+/− compared with 3xTg-AD mice (Fig. 5A–C). To further assess the tau pathology, we measured tau levels by Western blot using antibodies against total and phosphorylated tau (Fig. 5D). We found that the levels of total human and mouse tau (measured by the HT7 and tau 5, respectively), were significantly different among the four groups (p < 0.0001; Fig. 5E,F). A post hoc test with Bonferroni's correction indicated that human tau levels in all groups were significantly different from each other with the exception of the NonTg with the S6K1+/− mice. The levels of mouse tau were significantly higher in 3xTg-AD mice compared with the other three groups, including NonTg mice. Notably, mouse tau levels were not different between 3xTg-AD/S6K1+/− and NonTg mice, nor were they different between NonTg and S6K1+/− mice. We also found that the levels of tau phosphorylated at Thr231 (measured by the TG3 antibody) and at Ser202 (measured by the CP13 antibody) were significantly different among the four groups (p < 0.0001; Fig. 5G,H). A post hoc test with Bonferroni's correction indicated that TG3 levels in all groups were significantly different from each other, with the exception of the NonTg with the S6K1+/− mice. CP13 levels were significantly higher in 3xTg-AD mice compared with the other three groups, including NonTg mice. Notably, CP13 levels were not different between 3xTg-AD/S6K1+/− and NonTg mice, nor were they different between NonTg and S6K1+/− mice. Together, these results clearly indicate that removing one copy of the S6K1 gene is sufficient to ameliorate tau pathology in 3xTg-AD mice.
Figure 5.
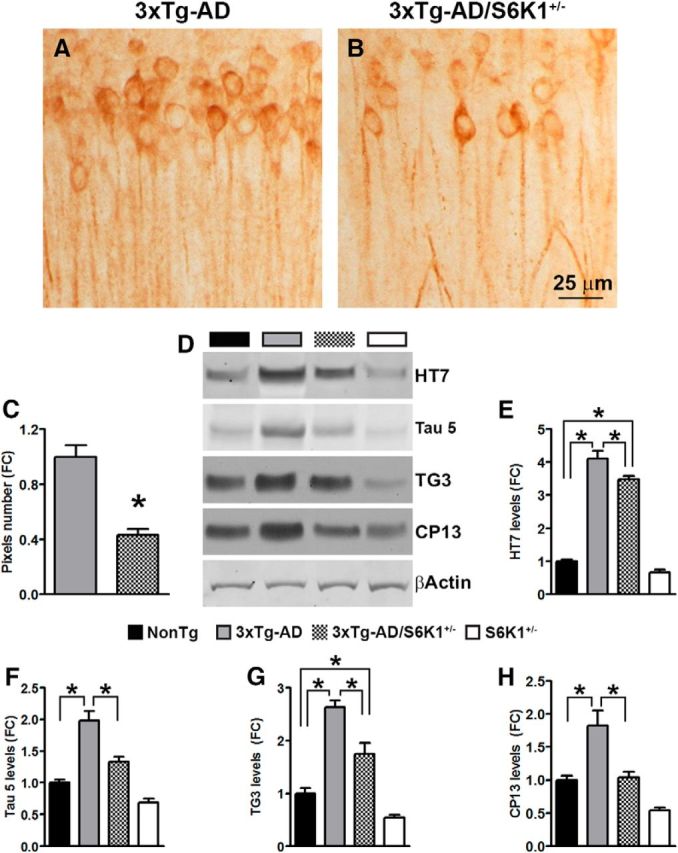
Reduced tau pathology in 3xTg-AD/S6K1+/− mice. A, B, Representative microphotographs of CA1 neurons from 3xTg-AD and 3xTg-AD/S6K1+/− mice stained with the anti-tau antibody CP13, which recognizes tau phosphorylated at Ser202. C, Quantitative analysis of the CP13 immunoreactivity by unpaired t test (t(14) = 5.96, p < 0.0001). D, Representative Western blots of protein extracted from NonTg, 3xTg-AD, 3xTg-AD/S6K1+/−, and S6K1+/− mice. Blots were probed with the indicated antibodies. The HT7 antibody recognizes total human tau, the tau 5 antibody recognizes total mouse tau, the TG3 antibody recognizes tau phosphorylated at Thr231, and the CP13 antibody recognizes tau phosphorylated at Ser202. E–H, Quantitative analyses of the blots obtained by normalizing the quantity of a specific protein with its loading control, β-actin. Data were analyzed by one-way ANOVA followed by a Bonferroni's multiple-comparison test. For HT7: p < 0.0001, F(3,28) = 166. Post hoc tests indicated that all groups were significantly different from each other with the exception of the NonTg with the S6K1+/− mice. For tau 5: p < 0.0001, F(3,28) = 35.83. Post hoc tests indicated that the 3xTg-AD mice have significantly higher tau 5 levels than all the other three groups. Tau 5 levels in 3xTg-AD/S6K1+/− mice were higher than those of S6K1+/− mice, while no differences were observed between NonTg and 3xTg-AD/S6K1+/− and between NonTg and S6K1+/− mice. For TG3: p < 0.0001, F(3,28) = 44.66. Post hoc tests indicated that all groups were significantly different from each other with the exception of the NonTg with the S6K1+/− mice. For CP13: p < 0.0001, F(3,28) = 18.53. Post hoc tests indicated that all groups were significantly different from each other with the exception of the NonTg with the S6K1+/− mice. n = 8 mice/genotype for each of the experiments shown here. Error bars represent mean ± SEM.
In addition to tau pathology, the accumulation of extracellular Aβ plaques is another hallmark of AD. Aβ peptides consist of 36–43 aa; Aβ40 and Aβ42 are the more abundant Aβ species, with the latter being more prone to aggregation and toxicity compared with Aβ40 (Querfurth and LaFerla, 2010). We immunostained sections from 3xTg-AD and 3xTg-AD/S6K1+/− mice with an Aβ42-specific antibody and found that Aβ42 immunoreactivity was significantly reduced in the brains of the 3xTg-AD mice lacking one copy of the S6K1 gene (Fig. 6A–D). Quantitative analysis of the overall Aβ load indicated a significant decrease of 64.32 ± 3.2% in the brain of 3xTg-AD/S6K1+/− compared with 3xTg-AD mice (p < 0.001). We next measured Aβ levels by sandwich ELISA and found that soluble Aβ42 and Aβ40 levels were significantly lower in 3xTg-AD/S6K1+/− mice compared with 3xTg-AD mice (p = 0.01 and p = 0.03, respectively; Fig. 6E). We further found that while insoluble Aβ40 levels were similar between the two groups, insoluble Aβ42 levels were significantly lower in 3xTg-AD/S6K1+/− mice compared with those in 3xTg-AD mice (p = 0.02; Fig. 6F). To determine whether alterations in APP processing could account for the changes in Aβ levels, we measured the levels of full-length APP and its two major C-terminal fragments, C99 and C83, in all four genotypes. We found that full-length APP levels were significantly different among the four groups (p < 0.0001; Fig. 6G,H). A post hoc test with Bonferroni's correction indicated that 3xTg-AD and 3xTg-AD/S6K1+/− mice had higher APP levels than the other two groups, consistent with the presence of the APP transgene. Notably, APP levels were not statistically significant between 3xTg-AD and 3xTg-AD/S6K1+/− mice. For C99 and C83, we also found a significant change among the four groups (p < 0.0001; Fig. 6I,J). A post hoc test with Bonferroni's correction indicated that C99 levels in 3xTg-AD mice were significantly different from those of the other three groups. However, removing one copy of the S6K1 gene was sufficient to reduce C99 levels. To this end, C99 levels were similar between NonTg and 3xTg-AD/S6K1+/− mice. C83 levels were significantly different in the 3xTg-AD mice compared with NonTg and S6K1+/− mice; in contrast, they were similar between 3xTg-AD and 3xTg-AD/S6K1+/− mice. These results suggest that removing one copy of the S6K1 gene is sufficient to reduce C99 levels together with Aβ burden and levels.
Figure 6.
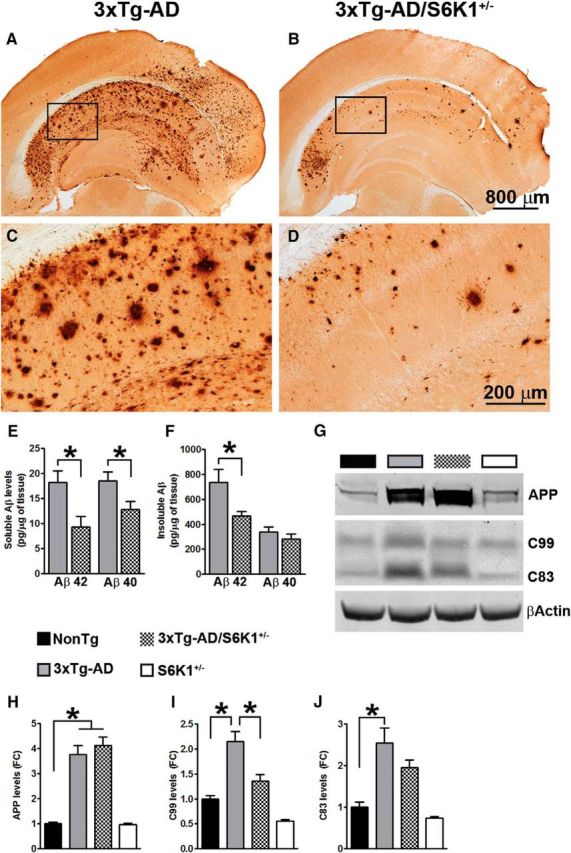
Reduced Aβ pathology in 3xTg-AD/S6K1+/− mice. A–D, Representative microphotographs of brain sections from 3xTg-AD and 3xTg-AD/S6K1+/− mice stained with an anti-Aβ42-specific antibody. C and D are high-magnification images of the boxed areas in A and B, respectively. E, Sandwich ELISA measurements of soluble Aβ42 and Aβ40 levels. The levels of both peptides were significantly lower in mice lacking one copy of the S6K1 gene (Aβ40: t(14) = 2.31, p = 0.03; Aβ42: t(14) = 2.81, p = 0.01; n = 8 mice/genotype). F, Sandwich ELISA measurements of insoluble Aβ42 and Aβ40 levels. While the levels of insoluble Aβ40 were similar between the two groups (t(14) 0.92, p > 0.05), the levels of insoluble Aβ42 were significantly lower in 3xTg-AD/S6K1+/− mice compared with those in 3xTg-AD mice (t(14) = 2.46, p = 0.02; n = 8 mice/genotype). ELISA data were analyzed by Student's t test. G, Representative Western blots of protein extracted from NonTg, 3xTg-AD, 3xTg-AD/S6K1+/−, and S6K1+/− mice. To identify full-length APP, blots were probed with 6E10. To identify C99 and C83, blots were probed with CT20, a C-terminal anti-APP antibody. H–J, Quantitative analyses of the blots obtained by normalizing the quantity of a specific protein with its loading control, β-actin. Data were analyzed by one-way ANOVA followed by a Bonferroni's multiple-comparison test (n = 8 mice/genotype; for APP: p < 0.0001, F(3,28) = 49.05). Post hoc analysis indicated that APP levels were significantly higher in 3xTg-AD and 3xTg-AD/S6K1+/− compared with the other two groups. No differences were observed between 3xTg-AD and 3xTg-AD/S6K1+/− mice and between NonTg and S6K1+/− mice. For C99: p < 0.0001; F(3,28) = 28.44. Post hoc tests indicated that C99 levels were significantly higher in 3xTg-AD mice compared with the other three groups. C99 levels were also higher in 3xTg-AD/S6K1+/− compared with those in S6K1+/− mice. No significant difference was found between NonTg and 3xTg-AD/S6K1+/− mice and between NonTg and S6K1+/− mice. For C83: p < 0.0001, F(3,28) = 15.90. Post hoc tests indicated that C83 levels were significantly higher in 3xTg-AD and 3xTg-AD/S6K1+/− compared with the other two groups. No differences were observed between 3xTg-AD and 3xTg-AD/S6K1+/− mice and between NonTg and S6K1+/− mice. Error bars represent mean ± SEM.
Low S6K1 signaling reduces BACE-1 and tau translation
Our data indicate that removing one copy of the S6K1 gene in 3xTg-AD mice is sufficient to ameliorate spatial learning and memory deficits. These changes were associated with an improvement in synaptic plasticity and a reduction in Aβ and tau pathology. To better understand the mechanisms underlying these changes, we first assessed potential changes in autophagy induction and proteasome function. We focused on these systems as they represent the two major cellular protein degradation systems and are known to be involved in the turnover of Aβ and tau. First, we used the fluorogenic substrates Bz-VGR-AMC, Suc-LLVYAMC, and Z-LLE-AMC to measure trypsin-like, chymotrypsin-like, and caspase-like activities of the proteasome. For all three activities, we found an effect of time (p < 0.0001; Fig. 7A–C) but not genotype, indicating that proteasome function was similar among the four groups. Next, we assessed autophagy induction by measuring the levels of Atg3, Atg5, Atg7, Atg12, and p62. These are key proteins in autophagy induction and are routinely used to monitor it (Mizushima, 2004). We found that the levels of these autophagy-related proteins were similar among the four groups (Fig. 7D–I). Together, these data suggest that proteasome and autophagy are not likely involved in the S6K1-mediated changes in Aβ and tau levels.
Figure 7.

Proteasome activity and autophagy induction are not affected by S6K1 signaling. A–C, Brain homogenates from NonTg, 3xTg-AD, 3xTg-AD/S6K1+/−, and S6K1+/− mice were analyzed for proteasome activity (n = 4 mice/genotype). Data were analyzed by two-way ANOVA, which revealed no genotype effect of any of the three enzymatic activities measured. A: p > 0.05, F(3,12) = 0.77; B: p > 0.05, F(3,12) = 2.56; C: p > 0.05, F(3,12) = 2.87. D, Representative Western blots of protein extracted from the brains of NonTg, 3xTg-AD, 3xTg-AD/S6K1+/−, and S6K1+/− mice (n = 8 mice/genotype). Blots were probed with the indicated antibodies. E–I, Quantitative analyses of the blots were obtained by normalizing the protein of interest to β-actin, used as a loading control. One-way ANOVA analyses indicated that none of these markers was statistically significant among the four groups. B: p > 0.05, F(3,28) = 0.43; C: p > 0.05, F(3,28) = 1.35; D: p > 0.05, F(3,28) = 0.81; E: p > 0.05, F(3,28) = 1.82; F: p > 0.05, F(3,28) = 0.50. Error bars represent mean ± SEM.
We found that C99 levels were significantly lower in 3xTg-AD/S6K1+/− mice compared with those in 3xTg-AD mice. C99 is liberated from APP by a proteolytic cleavage executed by BACE-1, which is then further cleaved by the γ-secretase complex to generate Aβ (Querfurth and LaFerla, 2010). Therefore, we measured PS1 and BACE-1 levels by Western blot. While PS1 levels were similar among the four groups (Fig. 8A,B), we found a significant change in BACE-1 levels (p = 0.0007; Fig. 8A,C). Bonferroni's post hoc tests indicated that BACE-1 levels were significantly different in 3xTg-AD mice when compared with the other three groups. No other pairwise comparisons were statistically significant. To better understand the involvement of BACE-1, we measured BACE-1 enzymatic activity. We found a significant difference among the four groups (p < 0.0001; Fig. 8D). Bonferroni's post hoc tests indicated that all the groups were significantly different from each other with the exception of NonTg and 3xTg-AD/S6K1+/− mice. To better understand the mechanisms underlying the changes in BACE-1 levels and activity, we measured BACE-1 mRNA by qPCR. We found that the mRNA levels of BACE-1 were similar among the four groups (p = 0.08; Fig. 8E). Given the role of S6K1 in protein synthesis and that BACE-1 mRNA levels were similar between 3xTg-AD and 3xTg-AD/S6K1+/− mice while BACE-1 proteins levels were lower in 3xTg-AD/S6K1+/− mice, we hypothesized that changes in translation of the BACE-1 mRNA may account for the reduced BACE-1 levels and activity. To test this hypothesis, we measured the amount of BACE-1 mRNA associated with heavy polysomes (i.e., actively translated). To obtain a ribosome profiling, we used a well established ribosome fractionation protocol on 10–50% linear sucrose gradient (Gandin et al., 2014). To assess the amount of BACE-1 actively translated, we compared the mean BACE-1 mRNA levels in the fractions containing the polysomes. We found that the levels of BACE-1 mRNA associated with polysomes were significantly different among the four groups (p = 0.0027; Fig. 8F). Bonferroni's post hoc tests indicated that BACE-1 mRNA levels actively translated were higher in 3xTg-AD mice compared with all the other groups; however, no difference was found between NonTg and 3xTg-AD/S6K1+/− mice. Together, these data suggest that BACE-1 translation in 3xTg-AD mice is higher than that in NonTg mice but it is similar between NonTg and 3xTg-AD/S6K1+/− mice.
Figure 8.

Removing one copy of the S6K1 gene reduces BACE-1 activity and translation and tau translation. A, Representative Western blot of protein extracted from NonTg, 3xTg-AD, 3xTg-AD/S6K1+/−, and S6K1+/− mice (n = 8 mice/genotype). Blots were probed with the indicated antibodies. B, The graph shows the quantitative analyses of the PS1 blot. The values were similar among the four groups (p = 0.23; F(3,28) = 1.38). C, Quantitative analyses of the BACE-1 blot. BACE-1 protein levels were significantly different among the four groups (p = 0.0007, F(3,28) = 7.62). Post hoc tests revealed that BACE-1 levels were significantly different between NonTg and 3xTg-AD mice (p < 0.05, t = 3.31) but not different from those of 3xTg-AD/S6K1+/− or S6K1+/− mice. In contrast, BACE-1 levels in 3xTg-AD mice were significantly different from those in 3xTg-AD/S6K1+/− (p < 0.05, t = 2.87) and S6K1+/− (p < 0.01, t = 4.63) mice. No difference was found between 3xTg-AD/S6K1+/− or S6K1+/− mice. D, The graph shows BACE-1 enzymatic activity (n = 6 mice/genotype), which was significantly different among the four groups (p < 0.0001, F(3,20) = 7.62). Post hoc analyses revealed that BACE-1 activity in NonTg mice was significantly different from that in 3xTg-AD mice (p < 0.01, t = 6.66) and that in S6K1+/− mice (p < 0.01, t = 4.43), but not from that in 3xTg-AD/S6K1+/− mice (p > 0.05, t = 1.24). BACE-1 activity in 3xTg-AD mice was significantly different compared with that in 3xTg-AD/S6K1+/− mice (p < 0.01, t = 5.42) and that in S6K1+/− mice (p < 0.01, t = 11.09). A significant difference was also found between 3xTg-AD/S6K1+/− and S6K1+/− mice (p < 0.01, t = 5.66). E, The graph shows BACE-1 mRNA levels obtained by qPCR (n = 4 mice/genotype), which were not statistically different among the four groups (p > 0.05, F(3,12) = 2.82). F, The graph shows BACE-1 mRNA levels in the fractions containing heavy polysomes, which are expressed as fold change over NonTg (see Materials and Methods). The levels of BACE-1 mRNA were significantly different among the four groups (p = 0.0027, F(3,20) = 6.66). Post hoc tests indicated that the 3xTg-AD mice were significantly different than the other three groups, while 3xTg-AD/S6K1+/− mice were similar to NonTg mice. G, The levels of tau mRNA were significantly different among the four groups (p = 0.002, F(3,20) = 7.89). Post hoc tests indicated that the 3xTg-AD mice were significantly different than the other three groups, while 3xTg-AD/S6K1+/− mice were similar to NonTg mice. H, The levels of APP mRNA were not significantly different among the four groups (p = 0.78, F(3,20) = 0.35). Quantitative analyses of the blots obtained by normalizing the quantity of a specific protein with its loading control, β-actin. Data were analyzed by one-way ANOVA followed by a Bonferroni's (B–E) or Tukey's (F–I) multiple-comparison tests. Error bars represent mean ± SEM.
Previous data suggested that mTOR signaling is involved in the regulation of tau translation (Khurana et al., 2006). To test this hypothesis, we measured the levels of tau mRNA associated with heavy polysomes. We found a significant difference among the groups (p = 0.0019; Fig. 8G). Bonferroni's post hoc tests indicated that tau mRNA levels associated with the polysome were higher in 3xTg-AD mice compared with the other groups; however, no difference was found between NonTg and 3xTg-AD/S6K1+/− mice. In contrast, APP mRNA levels were similar among the groups (Fig. 8H), suggesting that removing one copy of the S6K1 gene does not alter global protein translation. This observation is consistent with previous reports (Garelick et al., 2013). Together, these data indicate that the lack of one copy of the S6K1 gene reduces BACE-1 activity and tau levels by decreasing translation of their mRNAs.
Discussion
The vast majority of AD cases (>95%) are sporadic and of unknown etiology (Querfurth and LaFerla, 2010). Genetic and epidemiological studies have identified several risk factors that contribute to the pathogenesis of AD (Reitz and Mayeux, 2014). Aging is the single most important risk factor for AD. In fact, even in the rare familial cases of AD, which are caused by autosomal-dominant mutations, the disease develops as a function of age (Querfurth and LaFerla, 2010; Alzheimer's Association, 2014). Despite this wealth of information, little is known about how aging contributes to the pathogenesis of AD. Dissecting pathways that regulate the aging process may highlight new molecular mechanisms at the basis of AD pathogenesis. S6K1 is a protein that regulates cell growth and proliferation via different mechanisms, including protein translation (Fenton and Gout, 2011). Notably, S6K1 knock-out mice show an increased median and maximum lifespan, and a decrease in age-related diseases, including motor and immune dysfunction, insulin resistance, and obesity (Um et al., 2004; Selman et al., 2009). Here we show for the first time that removing one copy of the S6K1 gene in 3xTg-AD mice is sufficient to ameliorate synaptic and spatial memory deficits, as well as reduce Aβ and tau pathology. Our results link S6K1, a protein clearly tied to the aging process, to the pathogenesis of AD.
Increasing evidence suggests that insulin resistance and concomitant elevated blood glucose is a key metabolic dysfunction contributing to AD (Cholerton et al., 2013). As mentioned above, S6K1 plays a key role in metabolic function and insulin resistance (Um et al., 2004). Thus, it is possible that the beneficial effects of S6K1 haploinsufficiency in the 3xTg-AD mice could be the result of reduced S6K1 activity in neurons or could instead be secondary to changes in peripheral energy metabolism. While we cannot directly distinguish between these two possibilities, our recent report argues for a central effect of S6K1 on AD-like pathology (Orr et al., 2014). To this end, we found that high sucrose intake induces obesity with changes in central and peripheral insulin signaling in 3xTg-AD mice. These changes were associated with increase in Aβ production and deposition as well as tau pathology. Notably, we showed that pharmacologically reducing the mTOR/S6K1 pathway with rapamycin prevented the detrimental effects of sucrose in the brain (e.g., central insulin signaling, Aβ and tau pathology), without changes in peripheral insulin resistance (Orr et al., 2014). Furthermore, chronic rapamycin administration ameliorates AD-like phenotype in AD mouse models by reducing the mTOR/S6K1 pathway (Caccamo et al., 2010; Majumder et al., 2011). These findings suggest that 3xTg-AD/S6K1+/− mice would be less responsive to rapamycin. Future studies are needed to directly evaluate this prediction.
Tau is a microtubule-binding protein and a hallmark of several neurodegenerative disorders, collectively known as tauopathies (Querfurth and LaFerla, 2010). Pathological tau is hyperphosphorylated and it aggregates to form neurofibrillary tangles. Recently, there has been a growing appreciation of the role of tau in AD pathogenesis. To this end, reducing tau levels prevents cognitive deficits in transgenic mice characterized by the buildup of Aβ (Roberson et al., 2007). This and other reports support the hypothesis that reducing tau levels may represent a valid therapeutic approach for AD and other tauopathies (Iqbal et al., 2014; Frost et al., 2015). Here we show that removing one copy of the S6K1 gene reduces tau phosphorylation and accumulation at least in part by reducing translation of tau mRNA. Pathological tau is phosphorylated by several kinases, including S6K1, which has been shown to directly phosphorylate tau at serine 214, serine 262, and threonine 212 (Pei et al., 2006). Consistent with a direct interaction between S6K1 and tau are data from Drosophila and mice showing that the target of rapamycin, a protein kinase that activates S6K1, regulates tau levels and phosphorylation (Khurana et al., 2006; Caccamo et al., 2013). These data could explain the reduction in phosphorylated tau detected in 3xTg-AD/S6K1+/− mice. A direct interaction between S6K1 and tau may have profound implications for other tauopathies, such as frontotemporal degeneration, Pick's disease, and corticobasal degeneration. While further studies in models of tau pathology are needed, our data promote S6K1 as a new therapeutic target for tauopathies. The tau pathology in 3xTg-AD mice is highly dependent on Aβ levels. For example, we have shown that genetic or immunological reduction of Aβ pathology significantly reduces tau deposition without altering the tau transgene levels (Oddo et al., 2008). The findings that Aβ can induce tau pathology have been recently showed in vitro as well (Choi et al., 2014). Therefore, it is tempting to speculate that the S6K1-mediated decrease in tau may be linked, at least in part, to the reduced Aβ levels. Consistent with this theory, studies in neuroblastoma cells show that high Aβ levels concomitantly increase S6K1 and tau phosphorylation (Zhou et al., 2008). Overall, while the interaction between tau and S6K1 might be complex, the data presented here unambiguously demonstrate that reducing S6K1 levels ameliorates tau pathology.
Genetic and pharmacological manipulation of general protein synthesis has supported a key role for this process in long-term memory formation (Santini et al., 2014). The translation initiation factor eIF2 is a master regulator of general protein translation; indeed, its phosphorylation suppresses general protein translation (Donnelly et al., 2013). Consistent with the role of protein translation in memory formation, reducing the phosphorylation of eIF2 improves memory in wild-type mice (Costa-Mattioli et al., 2007) and rescues memory deficits in a mouse model of AD (Ma et al., 2013). However, there is growing appreciation that the relationship between protein translation and memory formation is not as linear as originally thought. For example, there are several endogenous inhibitors of learning and memory, such as ATF4, and reducing translation of such proteins has beneficial effects on memory (Pavitt, 2013). Therefore, while the need for de novo protein synthesis during long-term memory formation of key proteins is indisputable, there is also strong evidence that reducing synthesis of selective proteins may benefit learning and memory (Pavitt, 2013). S6K1 controls several steps of protein synthesis. For example, it regulates ribosomal biogenesis by phosphorylating rpS6, which is located in mature ribosomes (Magnuson et al., 2012). The involvement of S6K1 in protein synthesis is further corroborated by studies showing its role in mRNA processing, in translational initiation and elongation, and in protein folding (Magnuson et al., 2012). Early work using postmortem human brains suggested that alterations in protein translations may contribute to the pathogenesis of AD (Sajdel-Sulkowska and Marotta, 1984). Here we provide compelling evidence showing that reducing S6K1 levels decreases the translation of BACE-1, thereby affecting its protein levels and enzymatic activity. In turn, the reduction in BACE-1 activity lowered C99 levels and Aβ production. Together, these findings further highlight a role of protein translation in AD and provide a new mechanisms by which S6K1 may affect AD pathogenesis.
The role of S6K1 in memory appears to be complex. For example, mice lacking both copies of the S6K1 gene show contextual and spatial memory deficits (Antion et al., 2008). In contrast, mice lacking a copy of the tuberous sclerosis complex have high S6K1 signaling (Caccamo et al., 2013) as well as deficits in LTP and cognition (Ehninger et al., 2008). Notably, reducing mTOR/S6K1 signaling rescues LTP and cognitive deficits in these mice (Ehninger et al., 2008). Although the lack of S6K1 does not affect general protein synthesis (Garelick et al., 2013), our experiments were designed to reduce, but not eliminate, S6K1 activity in 3xTg-AD mice. Here we show that removing a single copy of S6K1 ameliorates the synaptic and spatial memory deficits associated with AD pathology. Our results support the notion that removing a single copy of the S6K1 gene decreases the translation of BACE-1 and tau, two key proteins involved in AD pathogenesis.
Overall, our data provide compelling evidence indicating that reducing S6K1 levels improves the AD-like phenotype developed by the 3xTg-AD mice, including spatial memory deficits. Given the role of this protein kinase in aging, S6K1 may represent a molecular link between aging and AD. Aging is the major risk factor for most neurodegenerative diseases; thus, our results may have far-reaching implications into other diseases. Consequently, S6K1 may be a new therapeutic target for AD and other age-dependent diseases.
Footnotes
This work was supported by grants to S.O. by the National Institutes of Health (R01 AG037637). We are grateful to the Banner Sun Health Research Institute Brain and Body Donation Program of Sun City, Arizona, for providing the human tissue. The Brain and Body Donation Program is supported by the National Institute of Neurological Disorders and Stroke (U24 NS072026 National Brain and Tissue Resource for Parkinson's Disease and Related Disorders), the National Institute on Aging (P30 AG19610 Arizona Alzheimer's Disease Core Center), the Arizona Department of Health Services (Contract 211002, Arizona Alzheimer's Research Center), the Arizona Biomedical Research Commission (Contracts 4001, 0011, 05-901, and 1001 to the Arizona Parkinson's Disease Consortium), and the Michael J. Fox Foundation for Parkinson's Research. We thank Dr. Sara Kozma at the University of Cincinnati for providing the S6K1 knock-out mice. We thank Drs. Thomas G. Beach and Geidy E. Serrano at the Banner Sun Health Research Institute for providing the human tissue used in this work. We thank Dr. Peter Davies at the Hofstra North Shore–LIJ School of Medicine for providing the TG3 and CP13 antibodies.
The authors declare no competing financial interests.
References
- Alzheimer's Association. 2014 Alzheimer's disease facts and figures. Alzheimer's Dement. 2014;10:e47–e92. doi: 10.1016/j.jalz.2014.02.001. [DOI] [PubMed] [Google Scholar]
- Antion MD, Merhav M, Hoeffer CA, Reis G, Kozma SC, Thomas G, Schuman EM, Rosenblum K, Klann E. Removal of S6K1 and S6K2 leads to divergent alterations in learning, memory, and synaptic plasticity. Learn Mem. 2008;15:29–38. doi: 10.1101/lm.661908. [DOI] [PMC free article] [PubMed] [Google Scholar]
- Beach TG, Sue LI, Walker DG, Roher AE, Lue L, Vedders L, Connor DJ, Sabbagh MN, Rogers J. The Sun Health Research Institute Brain Donation Program: description and experience, 1987–2007. Cell Tissue Bank. 2008;9:229–245. doi: 10.1007/s10561-008-9067-2. [DOI] [PMC free article] [PubMed] [Google Scholar]
- Caccamo A, Majumder S, Richardson A, Strong R, Oddo S. Molecular interplay between mammalian target of rapamycin (mTOR), amyloid-beta, and tau: effects on cognitive impairments. J Biol Chem. 2010;285:13107–13120. doi: 10.1074/jbc.M110.100420. [DOI] [PMC free article] [PubMed] [Google Scholar]
- Caccamo A, Maldonado MA, Majumder S, Medina DX, Holbein W, Magrí A, Oddo S. Naturally secreted amyloid-beta increases mammalian target of rapamycin (mTOR) activity via a PRAS40-mediated mechanism. J Biol Chem. 2011;286:8924–8932. doi: 10.1074/jbc.M110.180638. [DOI] [PMC free article] [PubMed] [Google Scholar]
- Caccamo A, Magrì A, Medina DX, Wisely EV, López-Aranda MF, Silva AJ, Oddo S. mTOR regulates tau phosphorylation and degradation: implications for Alzheimer's disease and other tauopathies. Aging Cell. 2013;12:370–380. doi: 10.1111/acel.12057. [DOI] [PMC free article] [PubMed] [Google Scholar]
- Caccamo A, De Pinto V, Messina A, Branca C, Oddo S. Genetic reduction of mammalian target of rapamycin ameliorates Alzheimer's disease-like cognitive and pathological deficits by restoring hippocampal gene expression signature. J Neurosci. 2014;34:7988–7998. doi: 10.1523/JNEUROSCI.0777-14.2014. [DOI] [PMC free article] [PubMed] [Google Scholar]
- Choi SH, Kim YH, Hebisch M, Sliwinski C, Lee S, D'Avanzo C, Chen H, Hooli B, Asselin C, Muffat J, Klee JB, Zhang C, Wainger BJ, Peitz M, Kovacs DM, Woolf CJ, Wagner SL, Tanzi RE, Kim DY. A three-dimensional human neural cell culture model of Alzheimer's disease. Nature. 2014;515:274–278. doi: 10.1038/nature13800. [DOI] [PMC free article] [PubMed] [Google Scholar]
- Cholerton B, Baker LD, Craft S. Insulin, cognition, and dementia. Eur J Pharmacol. 2013;719:170–179. doi: 10.1016/j.ejphar.2013.08.008. [DOI] [PMC free article] [PubMed] [Google Scholar]
- Costa-Mattioli M, Gobert D, Stern E, Gamache K, Colina R, Cuello C, Sossin W, Kaufman R, Pelletier J, Rosenblum K, Krnjević K, Lacaille JC, Nader K, Sonenberg N. eIF2alpha phosphorylation bidirectionally regulates the switch from short- to long-term synaptic plasticity and memory. Cell. 2007;129:195–206. doi: 10.1016/j.cell.2007.01.050. [DOI] [PMC free article] [PubMed] [Google Scholar]
- Dineley KT, Jahrling JB, Denner L. Insulin resistance in Alzheimer's disease. Neurobiol Dis. 2014;72:92–103. doi: 10.1016/j.nbd.2014.09.001. [DOI] [PMC free article] [PubMed] [Google Scholar]
- Donnelly N, Gorman AM, Gupta S, Samali A. The eIF2alpha kinases: their structures and functions. Cell Mol Life Sci. 2013;70:3493–3511. doi: 10.1007/s00018-012-1252-6. [DOI] [PMC free article] [PubMed] [Google Scholar]
- Ehninger D, Han S, Shilyansky C, Zhou Y, Li W, Kwiatkowski DJ, Ramesh V, Silva AJ. Reversal of learning deficits in a Tsc2+/− mouse model of tuberous sclerosis. Nat Med. 2008;14:843–848. doi: 10.1038/nm1788. [DOI] [PMC free article] [PubMed] [Google Scholar]
- Fenton TR, Gout IT. Functions and regulation of the 70kDa ribosomal S6 kinases. Int J Biochem Cell Biol. 2011;43:47–59. doi: 10.1016/j.biocel.2010.09.018. [DOI] [PubMed] [Google Scholar]
- Frost B, Götz J, Feany MB. Connecting the dots between tau dysfunction and neurodegeneration. Trends Cell Biol. 2015;25:46–53. doi: 10.1016/j.tcb.2014.07.005. [DOI] [PMC free article] [PubMed] [Google Scholar]
- Gandin V, Sikstrom K, Alain T, Morita M, McLaughlan S, Larsson O, Topisirovic I. Polysome fractionation and analysis of mammalian translatomes on a genome-wide scale. J Vis Exp. 2014:87. doi: 10.3791/51455. [DOI] [PMC free article] [PubMed] [Google Scholar]
- Garelick MG, Mackay VL, Yanagida A, Academia EC, Schreiber KH, Ladiges WC, Kennedy BK. Chronic rapamycin treatment or lack of S6K1 does not reduce ribosome activity in vivo. Cell Cycle. 2013;12:2493–2504. doi: 10.4161/cc.25512. [DOI] [PMC free article] [PubMed] [Google Scholar]
- Iqbal K, Gong CX, Liu F. Microtubule-associated protein tau as a therapeutic target in Alzheimer's disease. Expert Opin Ther Targets. 2014;18:307–318. doi: 10.1517/14728222.2014.870156. [DOI] [PubMed] [Google Scholar]
- Kapahi P, Zid BM, Harper T, Koslover D, Sapin V, Benzer S. Regulation of lifespan in Drosophila by modulation of genes in the TOR signaling pathway. Curr Biol. 2004;14:885–890. doi: 10.1016/j.cub.2004.03.059. [DOI] [PMC free article] [PubMed] [Google Scholar]
- Khurana V, Lu Y, Steinhilb ML, Oldham S, Shulman JM, Feany MB. TOR-mediated cell-cycle activation causes neurodegeneration in a Drosophila tauopathy model. Curr Biol. 2006;16:230–241. doi: 10.1016/j.cub.2005.12.042. [DOI] [PubMed] [Google Scholar]
- Kimura R, Ma LY, Wu C, Turner D, Shen JX, Ellsworth K, Wakui M, Maalouf M, Wu J. Acute exposure to the mitochondrial complex I toxin rotenone impairs synaptic long-term potentiation in rat hippocampal slices. CNS Neurosci Ther. 2012;18:641–646. doi: 10.1111/j.1755-5949.2012.00337.x. [DOI] [PMC free article] [PubMed] [Google Scholar]
- Ma T, Trinh MA, Wexler AJ, Bourbon C, Gatti E, Pierre P, Cavener DR, Klann E. Suppression of eIF2alpha kinases alleviates Alzheimer's disease-related plasticity and memory deficits. Nat Neurosci. 2013;16:1299–1305. doi: 10.1038/nn.3486. [DOI] [PMC free article] [PubMed] [Google Scholar]
- Magnuson B, Ekim B, Fingar DC. Regulation and function of ribosomal protein S6 kinase (S6K) within mTOR signalling networks. Biochem J. 2012;441:1–21. doi: 10.1042/BJ20110892. [DOI] [PubMed] [Google Scholar]
- Majumder S, Richardson A, Strong R, Oddo S. Inducing autophagy by rapamycin before, but not after, the formation of plaques and tangles ameliorates cognitive deficits. PloS One. 2011;6:e25416. doi: 10.1371/journal.pone.0025416. [DOI] [PMC free article] [PubMed] [Google Scholar]
- Masliah E, Mallory M, Alford M, DeTeresa R, Hansen LA, McKeel DW, Jr, Morris JC. Altered expression of synaptic proteins occurs early during progression of Alzheimer's disease. Neurology. 2001;56:127–129. doi: 10.1212/WNL.56.1.127. [DOI] [PubMed] [Google Scholar]
- Mizushima N. Methods for monitoring autophagy. Int J Biochem Cell Biol. 2004;36:2491–2502. doi: 10.1016/j.biocel.2004.02.005. [DOI] [PubMed] [Google Scholar]
- Moll L, El-Ami T, Cohen E. Selective manipulation of aging: a novel strategy for the treatment of neurodegenerative disorders. Swiss Med Wkly. 2014;144:w13917. doi: 10.4414/smw.2014.13917. [DOI] [PubMed] [Google Scholar]
- Oddo S, Caccamo A, Shepherd JD, Murphy MP, Golde TE, Kayed R, Metherate R, Mattson MP, Akbari Y, LaFerla FM. Triple-transgenic model of Alzheimer's disease with plaques and tangles: intracellular Abeta and synaptic dysfunction. Neuron. 2003;39:409–421. doi: 10.1016/S0896-6273(03)00434-3. [DOI] [PubMed] [Google Scholar]
- Oddo S, Caccamo A, Tseng B, Cheng D, Vasilevko V, Cribbs DH, LaFerla FM. Blocking Aβ42 accumulation delays the onset and progression of tau pathology via the C terminus of heat shock protein70-interacting protein: a mechanistic link between Aβ and tau pathology. J Neurosci. 2008;28:12163–12175. doi: 10.1523/JNEUROSCI.2464-08.2008. [DOI] [PMC free article] [PubMed] [Google Scholar]
- Orr ME, Salinas A, Buffenstein R, Oddo S. Mammalian target of rapamycin hyperactivity mediates the detrimental effects of a high sucrose diet on Alzheimer's disease pathology. Neurobiol Aging. 2014;35:1233–1242. doi: 10.1016/j.neurobiolaging.2013.12.006. [DOI] [PMC free article] [PubMed] [Google Scholar]
- Pangman VC, Sloan J, Guse L. An examination of psychometric properties of the mini-mental state examination and the standardized mini-mental state examination: implications for clinical practice. Appl Nurs Res. 2000;13:209–213. doi: 10.1053/apnr.2000.9231. [DOI] [PubMed] [Google Scholar]
- Pavitt GD. Less translational control, more memory. eLife. 2013;2:e00895. doi: 10.7554/eLife.00895. [DOI] [PMC free article] [PubMed] [Google Scholar]
- Pearson RB, Dennis PB, Han JW, Williamson NA, Kozma SC, Wettenhall RE, Thomas G. The principal target of rapamycin-induced p70s6k inactivation is a novel phosphorylation site within a conserved hydrophobic domain. EMBO J. 1995;14:5279–5287. doi: 10.1002/j.1460-2075.1995.tb00212.x. [DOI] [PMC free article] [PubMed] [Google Scholar]
- Pei JJ, An WL, Zhou XW, Nishimura T, Norberg J, Benedikz E, Götz J, Winblad B. P70 S6 kinase mediates tau phosphorylation and synthesis. FEBS Lett. 2006;580:107–114. doi: 10.1016/j.febslet.2005.11.059. [DOI] [PubMed] [Google Scholar]
- Querfurth HW, LaFerla FM. Alzheimer's disease. N Engl J Med. 2010;362:329–344. doi: 10.1056/NEJMra0909142. [DOI] [PubMed] [Google Scholar]
- Rajapakse AG, Yepuri G, Carvas JM, Stein S, Matter CM, Scerri I, Ruffieux J, Montani JP, Ming XF, Yang Z. Hyperactive S6K1 mediates oxidative stress and endothelial dysfunction in aging: inhibition by resveratrol. PloS One. 2011;6:e19237. doi: 10.1371/journal.pone.0019237. [DOI] [PMC free article] [PubMed] [Google Scholar]
- Reinhard C, Thomas G, Kozma SC. A single gene encodes two isoforms of the p70 S6 kinase: activation upon mitogenic stimulation. Proc Natl Acad Sci U S A. 1992;89:4052–4056. doi: 10.1073/pnas.89.9.4052. [DOI] [PMC free article] [PubMed] [Google Scholar]
- Reitz C, Mayeux R. Alzheimer disease: epidemiology, diagnostic criteria, risk factors and biomarkers. Biochem Pharmacol. 2014;88:640–651. doi: 10.1016/j.bcp.2013.12.024. [DOI] [PMC free article] [PubMed] [Google Scholar]
- Roberson ED, Scearce-Levie K, Palop JJ, Yan F, Cheng IH, Wu T, Gerstein H, Yu GQ, Mucke L. Reducing endogenous tau ameliorates amyloid beta-induced deficits in an Alzheimer's disease mouse model. Science. 2007;316:750–754. doi: 10.1126/science.1141736. [DOI] [PubMed] [Google Scholar]
- Sajdel-Sulkowska EM, Marotta CA. Alzheimer's disease brain: alterations in RNA levels and in a ribonuclease-inhibitor complex. Science. 1984;225:947–949. doi: 10.1126/science.6206567. [DOI] [PubMed] [Google Scholar]
- Santini E, Huynh TN, Klann E. Mechanisms of translation control underlying long-lasting synaptic plasticity and the consolidation of long-term memory. Prog Mol Biol Transl Sci. 2014;122:131–167. doi: 10.1016/B978-0-12-420170-5.00005-2. [DOI] [PMC free article] [PubMed] [Google Scholar]
- Selman C, Tullet JM, Wieser D, Irvine E, Lingard SJ, Choudhury AI, Claret M, Al-Qassab H, Carmignac D, Ramadani F, Woods A, Robinson IC, Schuster E, Batterham RL, Kozma SC, Thomas G, Carling D, Okkenhaug K, Thornton JM, Partridge L, et al. Ribosomal protein S6 kinase 1 signaling regulates mammalian life span. Science. 2009;326:140–144. doi: 10.1126/science.1177221. [DOI] [PMC free article] [PubMed] [Google Scholar]
- Sheng M, Sabatini BL, Südhof TC. Synapses and Alzheimer's disease. Cold Spring Harb Perspect Biol. 2012 doi: 10.1101/cshperspect.a005777. 4 pii:a005777. [DOI] [PMC free article] [PubMed] [Google Scholar]
- Shima H, Pende M, Chen Y, Fumagalli S, Thomas G, Kozma SC. Disruption of the p70(s6k)/p85(s6k) gene reveals a small mouse phenotype and a new functional S6 kinase. EMBO J. 1998;17:6649–6659. doi: 10.1093/emboj/17.22.6649. [DOI] [PMC free article] [PubMed] [Google Scholar]
- Song C, Murray TA, Kimura R, Wakui M, Ellsworth K, Javedan SP, Marxer-Miller S, Lukas RJ, Wu J. Role of alpha7-nicotinic acetylcholine receptors in tetanic stimulation-induced gamma oscillations in rat hippocampal slices. Neuropharmacology. 2005;48:869–880. doi: 10.1016/j.neuropharm.2005.01.003. [DOI] [PubMed] [Google Scholar]
- Um SH, Frigerio F, Watanabe M, Picard F, Joaquin M, Sticker M, Fumagalli S, Allegrini PR, Kozma SC, Auwerx J, Thomas G. Absence of S6K1 protects against age- and diet-induced obesity while enhancing insulin sensitivity. Nature. 2004;431:200–205. doi: 10.1038/nature02866. [DOI] [PubMed] [Google Scholar]
- Zhou XW, Tanila H, Pei JJ. Parallel increase in p70 kinase activation and tau phosphorylation (S262) with Abeta overproduction. FEBS Lett. 2008;582:159–164. doi: 10.1016/j.febslet.2007.11.078. [DOI] [PubMed] [Google Scholar]