

Santaguida et al. find that aneuploid cells activate the transcription factor TFEB, a master regulator of autophagic and lysosomal gene expression, thereby increasing the expression of genes needed for autophagy-mediated protein degradation.
Keywords: aneuploidy, autophagy, proteotoxicity, TFEB, cancer
Abstract
An unbalanced karyotype, a condition known as aneuploidy, has a profound impact on cellular physiology and is a hallmark of cancer. Aneuploid cells experience a number of stresses that are caused by aneuploidy-induced proteomic changes. How the aneuploidy-associated stresses affect cells and whether cells respond to them are only beginning to be understood. Here we show that autophagosomal cargo such as protein aggregates accumulate within lysosomes in aneuploid cells. This causes a lysosomal stress response. Aneuploid cells activate the transcription factor TFEB, a master regulator of autophagic and lysosomal gene expression, thereby increasing the expression of genes needed for autophagy-mediated protein degradation. Accumulation of autophagic cargo within the lysosome and activation of TFEB-responsive genes are also observed in cells in which proteasome function is inhibited, suggesting that proteotoxic stress causes TFEB activation. Our results reveal a TFEB-mediated lysosomal stress response as a universal feature of the aneuploid state.
Chromosome missegregation leads to abnormal karyotypes, a condition known as aneuploidy (Holland and Cleveland 2009). Aneuploidy is detrimental in all organisms analyzed to date (Santaguida and Amon 2015). Aneuploidy causes proliferation defects in single-celled organisms and, with few exceptions, embryonic lethality in metazoans (for review, see Torres et al. 2008). Systematic studies of aneuploid cell lines have begun to shed light on the effects of an unbalanced karyotype on cellular physiology (for review, see Gordon et al. 2012). Changes in chromosome number lead to two types of phenotypes: (1) gene-specific effects where changes in copy number of specific genes lead to specific phenotypes and (2) phenotypes caused by simultaneously changing the copy number of many genes that, on their own, have little impact on cellular functions. These mass action effects contribute to a decrease in the fitness of cells with unbalanced karyotypes and are responsible for traits shared by different aneuploidies. We call these pan-aneuploidy phenotypes the aneuploidy-associated stresses (Santaguida and Amon 2015).
In previous studies, we described a number of aneuploidy-associated stresses in budding yeast. Aneuploid yeast cells show proliferation defects, with many aneuploid strains exhibiting a G1 delay (Torres et al. 2007; Thorburn et al. 2013). Yeast cells with an unbalanced karyotype further experience proteotoxic stress caused by aneuploidy-induced proteomic changes (Torres et al. 2010; Oromendia et al. 2012) and show a gene expression profile similar to the environmental stress response (ESR) gene expression signature (Gasch et al. 2000; Torres et al. 2007; Sheltzer and Amon 2011; Sheltzer et al. 2012). Analyses of aneuploid mammalian cells revealed similar pan-aneuploidy phenotypes. Chromosome missegregation causes p53 activation (Thompson and Compton 2010). The resulting aneuploid cells exhibit a gene expression signature reminiscent of the ESR (Sheltzer et al. 2012), metabolic alterations (Williams et al. 2008), a proliferation defect (Williams et al. 2008; Thompson and Compton 2010; Stingele et al. 2012), and proteotoxic stress (Tang et al. 2011; Stingele et al. 2012, 2013; Donnelly et al. 2014).
The detrimental effects of aneuploidy described in primary cells are at odds with the observation that aneuploidy is highly prevalent in cancer, a disease characterized by high proliferative potential (Weaver and Cleveland 2006; Holland and Cleveland 2009; Schvartzman et al. 2010). The aneuploid karyotypes in cancer are driven by tumor suppressor gene losses and oncogene gains, sculpting the genome to generate karyotypes that support and drive the malignant state (Davoli et al. 2013). However, the selective advantage associated with losses and gains of tumor suppressor genes and oncogenes, respectively, is dampened by detrimental effects associated with gains/losses of genes linked to them. Thus, in order to understand the full impact of aneuploidy on tumorigenesis, it is essential to identify and quantify not only the tumorigenesis-promoting effects of aneuploidy but also its anti-tumorigenic properties.
Our previous studies on the origins of proteotoxic stress in aneuploid cells revealed that this stress is triggered by an increase in misfolded proteins caused by aneuploidy-induced proteomic changes (Tang et al. 2011; Oromendia et al. 2012; Oromendia and Amon 2014). Changes in gene copy number generally translate into a corresponding change in gene expression (Torres et al. 2010; Stingele et al. 2012; Dephoure et al. 2014). Thus, gains or losses of entire chromosomes have a profound impact on the cell's protein composition. Alterations in relative abundance of hundreds if not thousands of proteins in turn result in proteotoxic stress because proteins lack their binding partners, causing them to misfold (Oromendia and Amon 2014). How increased protein misfolding affects protein quality control pathways in aneuploid cells is poorly understood. In this study, we investigated the effects of aneuploidy on one protein quality control pathway, autophagy. Autophagy is a catabolic process by which cells degrade their own constituents (for review, see Klionsky 2007). During starvation, the process supplies the cell with nutrients. Autophagy also serves an important quality control function. It eliminates defective organelles and protein aggregates (Tyedmers et al. 2010). During autophagy, a double-membrane structure forms around the cellular component destined for elimination, capturing it in an autophagosome. Once autophagosomes have formed, they fuse with lysosomes, where their content is degraded (Klionsky 2007; Xie and Klionsky 2007; Settembre et al. 2013).
Here we describe an unanticipated effect of aneuploidy on autophagosome-mediated protein degradation: Autophagosomes are not effectively cleared in the lysosomal compartment. Our data further suggest that misfolded/unfolded proteins that accumulate in aneuploid cells are the cause of this lysosomal saturation. Importantly, cells respond to this impasse in lysosomal degradation by activating a lysosomal stress response in which the transcription factor TFEB induces the expression of genes specifically required for autophagic protein degradation. We conclude that the TFEB-mediated lysosomal stress response represents another widespread feature of aneuploidies.
Results
A method to examine the immediate consequences of aneuploidy on autophagy
Autophagosome formation requires that the cytosolic form of microtubule-associated protein light chain 3 (MAP1LC3), referred to as LC3-I, is cleaved and conjugated to phosphatidylethanolamine to generate the lipidated LC3-II form that is incorporated into autophagosome membranes (Kabeya et al. 2000; Mizushima 2004). Thus, LC3-II is an ideal reporter of autophagosome formation. Previous studies showed that mouse embryonic fibroblasts (MEFs) and human cells carrying additional chromosomes harbor an increased number of autophagosomes, as judged by increased levels of LC3-labeled structures (Supplemental Fig. 1A–D; Tang et al. 2011; Stingele et al. 2012). Why LC3-labeled structures accumulate in aneuploid cells and whether and how cells respond to this consequence of an unbalanced karyotype were not understood.
To begin to address these questions, we asked whether the increase in LC3-containing structures is an immediate consequence of chromosome missegregation or the result of a persistent aneuploid karyotype. We induced chromosome missegregation in hTERT immortalized, nontransformed human retinal pigment epithelial (RPE-1) cells by interfering with the function of the spindle assembly checkpoint (SAC), an evolutionarily conserved surveillance mechanism essential for accurate chromosome segregation (Musacchio and Salmon 2007). We either depleted the SAC components Mad2 or Bub1 or inhibited the SAC kinase Mps1 using the small-molecule inhibitor reversine or AZ3146 (Hewitt et al. 2010; Santaguida et al. 2010). These methods of SAC inactivation led to chromosome alignment defects in the vast majority of cells and missegregation of a small number of chromosomes in a high percentage of cells (Supplemental Fig. 1E–G; Hewitt et al. 2010; Santaguida et al. 2010).
Reversine- and AZ3146-induced chromosome missegregation interfered with the proliferation of hTERT immortalized RPE-1 cells especially under conditions of continuous chromosome missegregation (Supplemental Fig. 2A,B). However, while cell death is one probable consequence of chromosome missegregation, we did not detect high levels of dying cells in cells collected following chromosome missegregation, as judged by PARP cleavage, lactate dehydrogenase (LDH) release, and Annexin V staining (Supplemental Fig. 2C–E). We conclude that transient inactivation of the SAC causes chromosome missegregation in the vast majority of cells.
LC3-labeled structures accumulate in cells following chromosome missegregation
Having established a method to investigate the acute consequences of chromosome missegregation, we examined its effects on autophagy. To this end, we synchronized cells at the G1/S transition and induced chromosome missegregation during the first mitosis following release from the G1/S block. LC3-II levels were analyzed during the subsequent two to three cell divisions, after 33, 57, and 81 h (corresponding to 24, 48, and 72 h after the first mitosis, respectively) (Supplemental Fig. 3A). Chromosome missegregation had a significant effect on LC3-II protein levels. LC3-II protein levels started to increase by 57 h and reached high levels 81 h after release from the G1/S block when the majority of cells had undergone two to three cell divisions (Fig. 1A,B; Supplemental Fig. 3B). Concomitantly, LC3 foci accumulated in cells (Fig. 1C–E). This rise in LC3-II protein levels was at least in part due to an increase in LC3 mRNA levels (Fig. 1F). LC3-II levels also increased following chromosome missegregation in diploid immortalized foreskin fibroblast BJ-hTERT cells, diploid lung IMR-90 fibroblasts, and diploid lymphoblastoid cells (Supplemental Fig. 3C–E; Fry et al. 2008). Importantly, LC3 accumulation was a consequence of SAC inactivation and was not due to reversine and AZ3146 targeting other proteins because siRNA-mediated knockdown of the SAC component Mad2 or Bub1 also led to an increase in LC3-II levels (Fig. 1A,B; Supplemental Fig. 3A,B).
Figure 1.
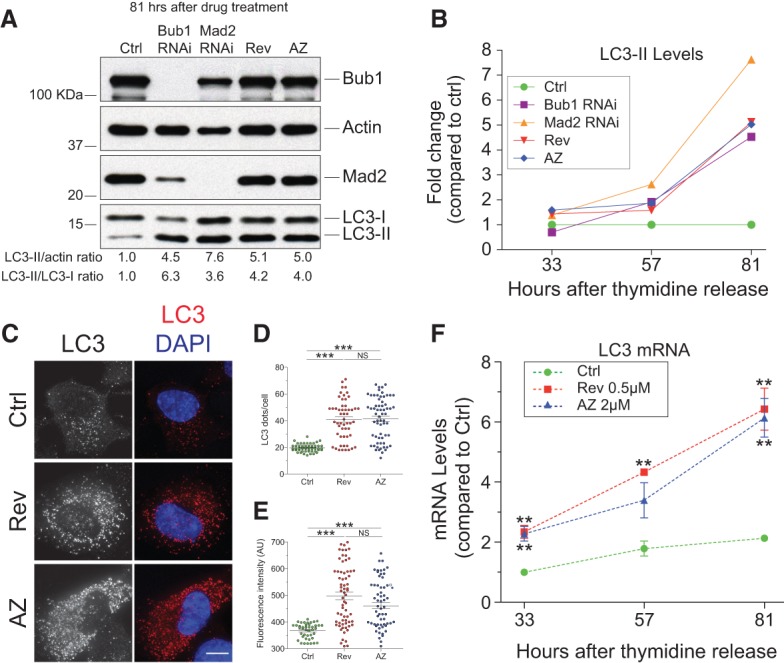
LC3-labeled structures accumulate in aneuploid cells. (A,B) RPE-1 cells were exposed to a double round of siRNA-mediated depletion of either Bub1, Mad2, or control (Ctrl) oligo followed by a double thymidine arrest. After thymidine washout, control-depleted cells were treated with 0.5 μM reversine or 2 μM AZ3146 for 15 h, washed, and grown in fresh medium. Time points were taken 33, 57, and 81 h after release from the thymidine block (a schematic description of the experiment is in Supplemental Fig. 3A). Protein levels 81 h after release are shown; protein levels 33 and 57 h after release are in Supplemental Figure 3B. Quantification of LC3-II levels is shown in B. (C–E) RPE-1 cells were treated with reversine or AZ3146 for 24 h. The drug was then washed out, and cells were analyzed 48 h later for LC3 levels. Quantification of LC3 puncta is shown in D, and fluorescence intensity is shown in E. Mean ± SEM (standard error of the mean); at least 45 cells per condition from three independent experiments were analyzed. Bar, 10 µm. (***) P < 0.001; (NS) not significant, Kruskal-Wallis followed by Dunn's multiple comparison post-test. (F) RPE-1 cells were synchronized by thymidine block–release as in A to analyze LC3 mRNA levels. n = 3 independent experiments; mean ± SEM. (**) P < 0.01, analysis of variance plus Bonferroni's test.
To determine whether the increase in LC3-II levels upon chromosome missegregation was due to the generation of aneuploid cells or was caused by aspects of SAC inhibition unrelated to producing aneuploid cells, we analyzed the effects of inhibiting cytokinesis in cells missegregating chromosomes. Inhibition of cytokinesis does not affect chromosome missegregation caused by SAC inhibition but will prevent the generation of aneuploid cells. To inhibit cytokinesis, we treated cells with the Aurora B inhibitor ZM447439 (Ditchfield et al. 2003) at the time of chromosome missegregation. This prevented the accumulation of LC3-II (Fig. 2A,B; Supplemental Fig. 3D). We noticed that prolonged treatment of cells with ZM447439 caused a slight increase in LC3-II levels (data not shown) but not within the time frame of the experiment.
Figure 2.
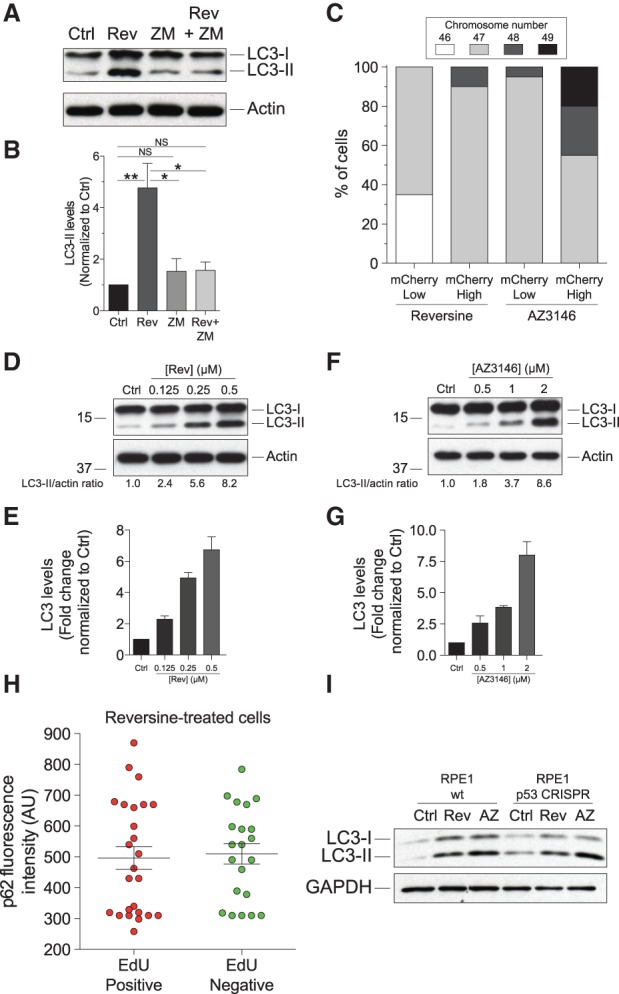
LC3-II accumulation correlates with degree of aneuploidy and is cell cycle-independent. (A,B) RPE-1 cells were treated with 2 µM reversine and the Aurora B inhibitor ZM447439 for 24 h, washed, and grown for another 48 h to analyze LC3-II. n = 3; mean ± SEM. (**) P < 0.01; (*) P < 0.05; (NS) not significant, analysis of variance plus Bonferroni's test. (C) RPE-1 hTERT cells stably expressing mCherry-GFP-LC3 were treated with either reversine or AZ3146 for 24 h. Forty-eight hours after drug removal, cells were sorted according to LC3-mCherry levels (high or low). Cells were then grown for 10 d, and their karyotype was determined. (Note: The fact that cells were grown for 10 d before analysis is likely to be the reason why monosomies and cells with high levels of aneuploidy were not observed. However, these types of aneuploidies were observed 24 h after induction of chromosome missegregation [Supplemental Fig. 1G]). (D–G) RPE-1 cells were treated with the indicated concentrations of reversine (D,E) or AZ3146 (F,G) for 24 h, and LC3-II levels were examined 48 h after. n = 3; mean ± SEM. (H) RPE-1 cells were synchronized by thymidine block/release. Six hours after thymidine washout, cells were treated with 0.5 µM reversine or solvent alone for 9 h. EdU was added to the growth medium 10 h after thymidine release, and EdU incorporation and polyubiquitin-binding protein sequestosome 1 (SQSTM1/p62; henceforth p62) levels were analyzed 72 h later. The graph shows p62 fluorescence intensity values in EdU-positive and EdU-negative cells. (I) Wild-type RPE-1 cells and RPE-1 cells lacking p53 (RPE1 p53 CRISPR) were treated with reversine or AZ3146 for 24 h. Cells were then washed, and LC3-II levels were analyzed 48 h later.
LC3-II levels were significantly higher in cells that experienced chromosome missegregation compared with cells harboring single-chromosome aneuploidies (cf. Supplemental Fig. 1A and Fig. 1A,B). This difference is at least in part due to chromosome missegregation causing higher levels of aneuploidy than is present in trisomic MEFs. When chromosome missegregation was induced in RPE1 cells stably expressing mCherry-LC3, the resulting aneuploid cells harboring high levels of mCherry-LC3 exhibited more variable karyotypes than cells with low levels of mCherry-LC3 (Fig. 2C). Furthermore, LC3-II levels increased with increasing degrees of chromosome missegregation (Fig. 2D–G; Supplemental Fig. 4). We conclude that chromosome missegregation induces LC3-II accumulation in a manner that correlates with the degree of karyotypic abnormalities. Because cells harboring constitutive aneuploidies (trisomic MEFs) also accumulate LC3-II, we further conclude that this increase in LC3-II levels is caused at least in part by aneuploidy and not other cellular events accompanying chromosome missegregation.
Chromosome missegregation-induced LC3-II accumulation is not caused by cell cycle arrest or p53 activation
Aneuploid cells transiently arrest in G1 and, in general, proliferate poorly (i.e., Supplemental Fig. 2A,B). We therefore considered the possibility that LC3-II accumulation was the consequence of aneuploid cells arresting in a cell cycle stage when LC3-II levels are high. To address this possibility, we measured the accumulation of the autophagy adaptor sequestosome 1 (SQSTM1/p62; henceforth p62) in cells that missegregated chromosomes while simultaneously assessing cell cycle stage by EdU incorporation. We found that, following chromosome missegregation, high levels of p62 were observed in EdU-negative (G1) and EdU-positive (S-, G2-, and M-phase) cells with equal likelihood and intensity (Fig. 2H). As previous studies indicated that the aneuploidy-induced G1 arrest is p53-dependent (Thompson and Compton 2010), we also assessed LC3-II accumulation in RPE-1 hTERT cells lacking p53. Upon chromosome missegregation, LC3-II accumulated (Fig. 2I). We conclude that LC3-II accumulation is not a consequence of a specific cell cycle arrest.
Autophagosomes are not effectively cleared in lysosomes in aneuploid cells
What is the fate of the LC3-labeled structures in aneuploid cells? Our localization studies revealed that while autophagosome–lysosome fusion appears normal, LC3 was not efficiently eliminated in aneuploid cells but accumulated within lysosomes (Fig. 3A–C). We observed extensive colocalization between LC3 and the lysosome-associated membrane protein 2 (LAMP-2) in aneuploid but not euploid cells (Fig. 3A–C; in agreement with Stingele et al. 2012). Three-dimensional structured illumination microscopy (3D-SIM) showed LAMP-2 forming ring-like structures around LC3 puncta (Fig. 3D; Supplemental Movie 1). Electron microsopy studies confirmed these results. Autophagolysosomes, defined as single-membrane vesicles, were larger and filled with electron-dense material in aneuploid cells, and their number was increased (Fig. 4A,B; Supplemental Fig. 5A).
Figure 3.
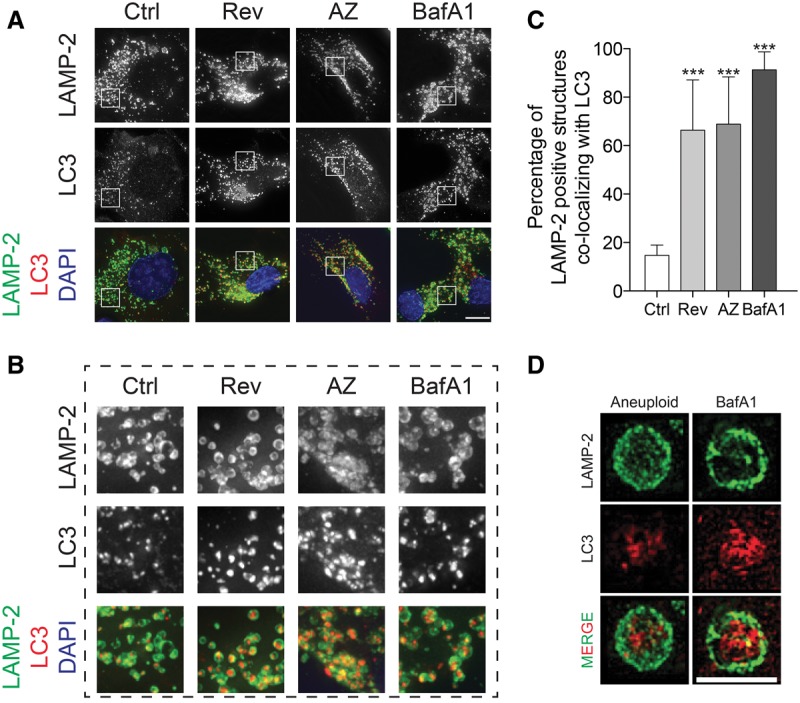
Autophagosomal proteins accumulate within lysosomes. (A–C) RPE-1 cells were grown as in Figure 1C to induce chromosome missegregation or treated with BafA1 for 6 h, and LC3 and LAMP-2 localization was analyzed. Enlargements of selected areas in A are shown in B. (Red) LC3; (green) LAMP-2; (blue) DNA. Quantification of the percentage of LAMP-2-positive structures colocalizing with LC3 is shown in C. Mean ± SEM; n = at least 450 structures per condition analyzed, pooled from three independent experiments; at least 15 structures per cell. Bar, 10 µm. (***) P < 0.001, analysis of variance plus Bonferroni's test. (D) Three-dimensional structured illumination analysis of LAMP-2-positive structures colocalizing with LC3. Bar, 2.5 µm. See also Supplemental Movie 1.
Figure 4.
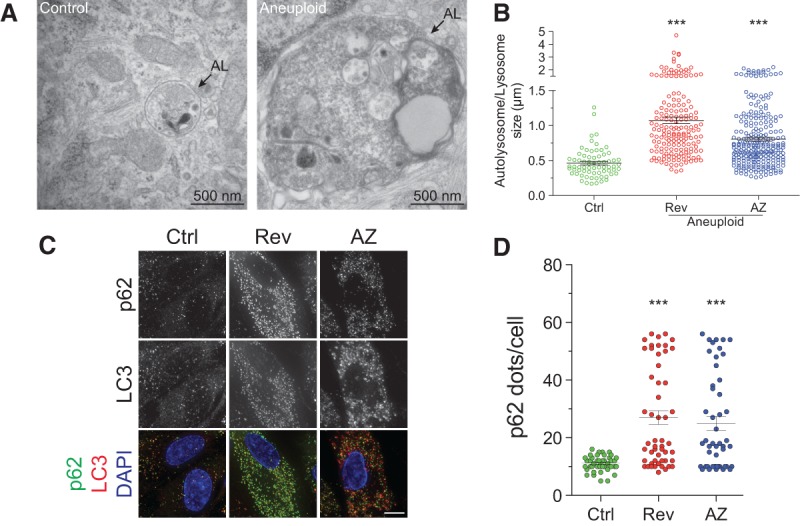
Autophagosomal proteins are not cleared within lysosomes. (A,B) RPE-1 cells were grown as in Figure 1C and analyzed 48 h after chromosome missegregation. Arrows identify lysosomes containing electron-dense material. Mean ± SEM; at least 15 cells per condition from two independent experiments were analyzed. Bar, 500 nm. (***) P < 0.001, Kruskal-Wallis followed by Dunn's multiple comparison post-test. (C,D) RPE-1 cells were grown as described in Figure 1C, and p62 levels were analyzed. Quantification of p62 foci is shown in D. Mean ± SEM; at least 40 cells per condition from two independent experiments were analyzed. Bar, 5 µm. (***) P < 0.001, Kruskal-Wallis followed by Dunn's multiple comparison post-test.
To characterize the autophagosome content that accumulates within lysosomes, we examined the localization of the polyubiquitin-binding protein p62 (Mizushima 2004). p62 functions as an adaptor for ubiquitinylated autophagic cargo, such as misfolded or aggregated proteins (Mizushima 2004; Bjorkoy 2005; Moscat et al. 2007). Immunolocalization studies showed that p62 protein levels and the number of p62 foci colocalizing with LC3 were increased in aneuploid cells (Fig. 4C,D, 6C [below]), indicating that protein aggregate-containing autophagosomes accumulate in lysosomes.
Figure 6.
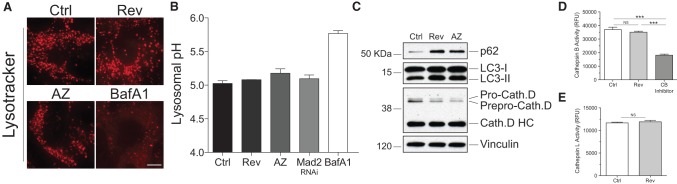
Lysosomal enzymes are functional in aneuploid cells. (A) RPE-1 cells were grown as described in Figure 1C. Lysosomal pH was determined using Lysotracker. Bar, 5 μm. BafA1 was used as positive control for pH alkalization. (B) Cells were grown as described in Figure 1C, and lysosomal pH was measured using the ratiometric probe Lysosensor yellow/blue DND-160. Mean ± SEM. (C) Cells were grown as described in Figure 1C, and the precursor (Pro and Prepro) and mature forms (HC) of cathepsin D were analyzed. (D,E) Cathepsin B and cathepsin L enzymatic activities were analyzed using a fluorimetric assay described in the Materials and Methods in cells grown as in Figure 1C. Mean ± SEM; n = 3. Cathepsin B inhibitor (CB inhibitor) was used as control in cathepsin B activity assays. (***) P < 0.001; (NS) not significant, analysis of variance plus Bonferroni's test.
The accumulation of autophagosomal content within lysosomes that we observed in aneuploid cells is highly reminiscent of the consequences of inhibiting lysosome function. Inactivation of the lysosomal H+ ATPase pump by treating cells with bafilomycin A1 (BafA1) also leads to the accumulation of autophagosomal content in cells (Fig. 3; Supplemental Fig. 5B). This similarity in phenotype suggests that autophagosomal cargo degradation is slowed in aneuploid cells. To test this hypothesis, we measured the levels of the autophagy substrate neomycin phosphotransferase GFP fusion protein (NeoR-GFP) (Nimmerjahn et al. 2003). NeoR-GFP levels dropped to 50% in euploid control cells over the course of the experiment (Fig. 5A,B). This decline is due to autophagy because inhibition of autophagy by treating cells with the type III phosphatidylinositol 3-kinase inhibitor 3-methyladenine (3-MA) prevented the decline in NeoR-GFP levels (Fig. 5A). Similarly, NeoR-GFP levels remained unchanged in cells that had missegregated chromosomes (Fig. 5A,B). The persistence of NeoR-GFP in aneuploid cells was not due to transcriptional up-regulation of the reporter (Fig. 5C). As the NeoR-GFP fusion is not known to be translationally regulated, these findings indicate that the NeoR-GFP fusion protein is stabilized in aneuploid cells.
Figure 5.
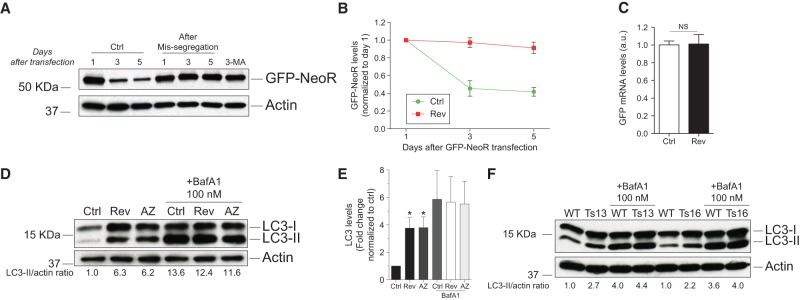
Autophagic degradation is decreased in aneuploid cells. (A–C) RPE-1 cells were treated with reversine or control vehicle for 24 h; the drug was then washed out, and cells were transfected with GFP-NeoR. Time points were taken at the indicated times. Cells treated with 1 mM 3-MA were exposed to the drug for 5 d. (A,B) GFP-NeoR levels examined at the indicated times. Mean ± SEM. (C) GFP mRNA levels were analyzed 3 d after GFP-NeoR transfection. Mean ± SEM. (NS) Not significant, Student's t-test. (D,E) RPE-1 cells were treated with reversine or AZ3146 for 24 h, washed, and grown for another 48 h. Six hours prior to harvesting, cells were treated with 100 nM BafA1 to examine LC3-II levels. n = 5; mean ± SEM. (*) P < 0.05, analysis of variance plus Bonferroni's test. (F) MEFs trisomic for either chromosome 13 or chromosome 16 or euploid littermate controls were treated with 100 nM BafA1, and LC3-II levels were analyzed. Quantifications of two independent experiments are shown in Supplemental Figure 5, D and E.
We also analyzed autophagic flux in aneuploid cells by comparing LC3-II levels between cells in which lysosomal degradation was inhibited by treatment with the lysosomal H+ ATPase pump inhibitor BafA1 and untreated cells (Mizushima 2004; Mizushima and Yoshimori 2007; Klionsky et al. 2012). If autophagic flux is impaired, the differential in LC3-II levels between lysosome-inhibited cells and uninhibited cells will decrease compared with cells in which flux is normal. We induced chromosome missegregation by treating RPE-1 cells with reversine or AZ3146 for 24 h. The drug was then washed out, and cells were analyzed 48 h later. To inhibit lysosomal degradation, we treated cells with BafA1 6 h prior to harvesting. As expected for wild-type cells, the difference in LC3-II levels between BafA1-treated cells and untreated cells was significant in euploid RPE-1 cells (Fig. 5D,E). This difference was decreased in aneuploid cells irrespective of whether chromosome missegregation was induced by drug treatment or knockdown of Mad2 or Bub1 (Fig. 5D,E; data not shown). Similar results were obtained when cells were treated with the lysosome inhibitor chloroquine or NH4Cl (Supplemental Fig. 5C). Trisomic MEFs also exhibited flux defects, although the degree of LC3-II accumulation was not as dramatic as in aneuploid RPE-1 cells (Fig. 5F; Supplemental Fig. 5D,E). We conclude that some autophagosomal content is not effectively degraded in aneuploid cells.
To determine why autophagosome components are not eliminated in aneuploid cells, we analyzed lysosomal functions. Our analysis of multiple lysosomal activities did not reveal any lysosomal defects in aneuploid cells. (1) Lysosomal pH was not affected in aneuploid cells, as judged by the analysis of the pH-sensitive lysosomal dye Lysotracker or the ratiometric probe Lysosensor yellow/blue DND-160 (Fig. 6A,B). (2) Proteolytic maturation of cathepsin D and cathepsin B, which requires an acidic lysosomal pH, was normal (Fig. 6C; data not shown). (3) Catalytic activity of cathepsin B and cathepsin L was not significantly altered in aneuploid cells (Fig. 6D,E). Thus, autophagosomal components accumulate within lysosomes because either they are difficult to degrade or the lysosomal compartment is overloaded. We suspect that both factors contribute. The idea that lysosomes become overloaded with hard to digest cargo in aneuploid cells is supported by the observation that accumulation of autophagosome content within lysosomes is not an immediate consequence of chromosome missegregation but requires two to three cell divisions to establish and then persists in cells, as it is also observed in cells with constitutive aneuploidies such as trisomic MEFs (Fig. 5F; Supplemental Fig. 1A–D).
Aneuploidy induces a lysosomal stress response
Do aneuploid cells respond to lysosomal overload? Starvation or inhibiting lysosomal acidification causes the translocation of the transcription factor TFEB from the cytoplasm into the nucleus, where it activates the expression of genes involved in autophagy such as LC3 and p62 (Settembre et al. 2012). We also observed that inhibition of lysosome function by chloroquine or BafA1 treatment led to the translocation of TFEB into the nucleus (Fig. 7A; Supplemental Fig. 6A). TFEB also accumulated in the nucleus in cells with high levels of LC3 foci following chromosome missegregation (Fig. 7A,B). Entry of TFEB into the nucleus was accompanied by an up-regulation of TFEB-responsive genes. Gene expression analysis showed that genes in the categories “regulation of autophagy” and “TFEB-responsive genes” (as defined in Settembre et al. 2011) were up-regulated following chromosome missegregation (Fig. 7C,D; Supplemental Fig. 6B–D; categories and gene lists are described in Supplemental Table 1).
Figure 7.

Aneuploidy induces a lysosomal stress response. (A,B) RPE-1 cells stably expressing a TFEB-3xFlag fusion were grown as described in Figure 1C (for reversine and AZ3146 treatment) or treated with 50 μM chloroquine or 1 μM MG132 for 24 h to examine TFEB-3xFlag (red) and LC3 (green) localization (A) or the presence of TFEB in the nuclear (N) or cytoplasmic (C) fraction (B). GAPDH and Histone H3 were used as cytoplasmic and nuclear controls, respectively, in B. Bar, 5 μm. (C) Heat map of normalized single-sample gene set enrichment analysis (ssGSEA) projection values for the custom gene sets “regulation of autophagy” and “TFEB-responsive genes.” ssGSEA projects the expression level of a group of genes in a sample to a single value. These projection values are then used to compare the expression level of a group of genes between multiple samples. High numbers (red) indicate a generally higher level of expression for a particular gene set. The “TFEB-responsive genes” gene set separates the BafA1 and control groups from the Rev and MG groups (the difference between two treatments in a given group [e.g. Ctrl vs. BafA1 or Rev vs. MG] is not statistically significant) (see also Supplemental Fig. 6B–D for statistics). Numbers in parenthesis are the number of genes in each group (see Supplemental Table 1 for complete gene lists and raw data). Three replicates per treatment are shown. (D) Heat map of genes in the custom gene list “TFEB-responsive genes.” The values used in the clustering run are averages of row-centered log2 FPKM (fragments per kilobase per million mapped fragments) values for each condition. Individual row-centered log2 FPKM values for control and reversine-treated samples are presented in Supplemental Figure 6C. (E,F) RPE-1 cells stably expressing a TFEB-3xFlag fusion were TFEB-depleted and then treated with reversine for 24 h, and LC3, p62, and TFEB protein (E) and LC3, p62 mRNA (F) levels were determined 48 h later. Mean ± SEM. (G) Euploid and aneuploid RPE-1 cells (generated through a single round of Mad2 depletion) were TFEB-depleted, and cell number was analyzed 72 h later. Data are shown as ratio of surviving aneuploid/euploid control cells. n = 3; mean ± SEM. (***) P < 0.001, Student's t-test. (H) A model for how aneuploidy impacts lysosomal capacity. See the text for details.
Interestingly, within the genes present in the category “TFEB-responsive genes,” the transcriptional response to chromosome missegregation differed from that of cells in which lysosomal function was blocked by BafA1 treatment but was similar to that caused by treatment of cells with the proteasome inhibitor MG132 (Fig. 7C,D; Supplemental Fig. 6B–D). Consistent with the similarity in transcriptional response between aneuploid cells and MG132-treated cells, we found that MG132 treatment also led to accumulation of TFEB in the nucleus and the accumulation of LC3 within lysosomes (Fig. 7A,B; Supplemental Fig. 6E,F). TFEB depletion prevented induction of the genes encoding the autophagosome components LC3 and p62 following chromosome missegregation (Fig. 7E,F), indicating that the up-regulation of autophagosomal genes upon chromosome missegregation was indeed mediated by TFEB. TFEB also appears to promote the survival of aneuploid cells. Knockdown of TFEB inhibited proliferation of aneuploid RPE-1 cells to a greater extent than that of euploid cells (Fig. 7G; Supplemental Fig. 7). Given that aneuploidy and proteasome inhibition cause the formation of protein aggregates (for review, see Siegel and Amon 2012), we propose that hard to degrade protein aggregates accumulate in lysosomes. This elicits a lysosomal stress response pathway that triggers the up-regulation of genes specifically needed for autophagy-mediated clearance of protein aggregates. Protein aggregates themselves and/or a reduction in free amino acids could activate TFEB (Lamark and Johansen 2012; Suraweera et al. 2012).
Discussion
In yeast and mammalian cells, changes in gene copy number largely but not universally lead to a corresponding change in the amount of proteins that they produce (Torres et al. 2007, 2008, 2010; Pavelka et al. 2010; Stingele et al. 2012). Thus, the impact on the cell's proteome is dramatic when the copy number of whole chromosomes is altered. Understanding the consequences of changing the levels of hundreds if not thousands of proteins simultaneously is thus central to understanding how aneuploidy impacts cell physiology. Previous studies have found that aneuploidy-induced proteomic changes cause LC3-labeled structures to accumulate in trisomic and tetrasomic cells (Tang et al. 2011; Stingele et al. 2012), but we lacked a molecular understanding of the basis of this phenotype. We found that autophagosomal content accumulates in the lysosomal compartment. This lysosomal clearance defect of autophagic cargo does not manifest itself immediately following chromosome missegregation, indicating that it is not an immediate consequence of aneuploidy but requires the continuous presence of an aneuploid karyotype to develop.
How does aneuploidy affect lysosomal degradation? Despite intense efforts, we were not able to detect lysosomal defects in aneuploid cells. pH and lysosomal enzyme activities appear normal in cells with aneuploid karyotypes. It is possible that aneuploidy-caused gene dosage imbalances in individual lysosomal components cause lysosomal defects that are too subtle to detect by our methods. We consider this possibility unlikely, as all types of aneuploidies—single-chromosome aneuploidies (trisomy 13 and 16) as well as chromosome missegregation-induced random aneuploidies—cause the accumulation of autophagosomal content within lysosomes. Instead, we favor the idea that lysosomes cannot keep up with the increased degradative load in aneuploid cells. Consistent with this idea is our observation that starvation (which, in addition to causing a decrease in protein synthesis, leads to hyperactivation of lysosomal degradation) suppresses the lysosomal degradation defect of aneuploid cells (S Santaguida, unpubl.). Based on the observations that proteasome inhibition causes a similar phenotype as aneuploidy and that p62 foci are elevated in aneuploid cells, we propose that hard to degrade protein aggregates targeted to lysosomes via autophagy accumulate in lysosomes of aneuploid cells. Proteasome function could be limiting in aneuploid cells, leading to the accumulation of ubiquitinylated proteins that must be eliminated by autophagy. Whether other autophagic cargos persist in lysosomes of aneuploid cells remains to be determined.
Irrespective of which autophagosomal cargo accumulates in lysosomes, the event does not go unnoticed. Cells activate a TFEB-mediated lysosomal stress response. However, despite TFEB activation, autophagosomal content is not cleared from lysosomes in aneuploid or MG132-treated cells. This is perhaps not surprising, as misfolded and/or aggregated proteins are continuously generated in aneuploid or MG132-treated cells. It is also possible that the TFEB response in aneuploid and proteasome-inhibited cells is geared toward up-regulation of autophagosome biogenesis rather than increasing lysosomal activity. High lysosomal activity may not be critical because, once encapsulated by autophagosomes, aggregated/misfolded proteins no longer pose a threat to the cell.
Interestingly, the TFEB response to aneuploidy and MG132 differs from that observed in response to lysosomal H+ ATPase pump inhibition. The mechanisms mediating this differential response remain to be determined. In response to nutritional signals, TFEB localization is controlled by TORC1 (Zoncu et al. 2011; Settembre et al. 2012). Whether TORC1 regulates TFEB activity in response to protein misfolding and aggregation is an important question that remains to be elucidated. Our unpublished observations suggest that this may not be the case. Previous studies also showed that mTOR is not the only regulator of TFEB activity (Settembre et al. 2012).
In summary, based on previous studies and the experiments presented here, we propose that the proteomic imbalances and the ensuing proteotoxic stress present in aneuploid and proteasome-inhibited cells induce autophagy of protein aggregates. Protein aggregates themselves and/or a reduction in free amino acids could be the trigger (Fig. 7H; Lamark and Johansen 2012; Suraweera et al. 2012). We further propose that, because misfolded and/or aggregated proteins are continuously generated in aneuploid cells and under conditions of continuous proteasome inhibition, autophagosomal content accumulates in the lysosomal compartment. When lysosome capacity is surpassed, a lysosomal stress response ensues that is aimed at producing more autophagosomes and increasing lysosomal capacity (Fig. 7H). Importantly, increased lysosomal load contributes to the reduction in fitness of primary aneuploid cells. MEFs trisomic for either chromosome 1, 13, 16, or 19 exhibit a higher degree of sensitivity to the lysosome inhibitor chloroquine than euploid cells (Tang et al. 2011). Whether increased lysosomal load affects the fitness of aneuploid cancer cells remains to be determined. Our initial efforts to address this question led to the remarkable finding that many cancer cell lines do not experience LC3-II clearance defects following chromosome missegregation (S Santaguida, unpubl.). This observation raises the interesting possibility that some cancer cells have evolved mechanisms to increase lysosomal capacity or compensate for this lysosome limitation in other ways. Examples exist for both scenarios. Ras-driven, Braf-driven, and other cancers up-regulate autophagy and are dependent on autophagic degradation for survival and tumorigenesis (White 2012; Guo et al. 2013). Other aneuploid cancer cell lines exhibit an increased reliance on chaperone activity (Bagatell and Whitesell 2004; Murphy 2013; Santagata et al. 2013). Identifying and understanding the mechanisms by which proteotoxicity associated with aneuploidy is suppressed in cancer will provide key insights into tumorigenesis and may represent new avenues for the development of novel cancer therapeutics.
Materials and methods
Cell culture conditions and drug treatments
Cell lines were cultured in DMEM (Invitrogen) supplemented with 10% FBS, 2 mM L-glutamine, and 100 U/mL penicillin/streptomycin. Cells were grown at 37°C with 5% CO2 in a humidified environment. For experiments involving drug treatments, controls represent cells treated with vehicle alone. RPE1-hTERT cells were kindly provided by Iain Cheeseman. RPE1-hTERT p53 CRISPR cells were kindly provided by Prasad Jallepalli through David Pellman. The lymphoblastoid cell line used in Supplemental Figure 3C has been previously characterized (Fry et al. 2008) and was kindly provided by Leona Samson through Mike Hemann. The BJ-hTERT and IMR-90 cell lines were obtained from American Type Culture Collection.
Reversine was obtained from Cayman Chemical, and AZ3146 was obtained from Tocris. BafA1, chloroquine, ammonium chloride, 3-MA, staurosporine, and thymidine were obtained from Sigma-Aldrich. MG132 was purchased from EMD Biosciences.
Protein detection by Western blots
For protein analyses, cells were lysed in lysis buffer (50 mM Tris-HCl at pH 7.4, 150 mM NaCl, 5 mM MgCl2, 1% Triton X-100, 0.5% NP-40, 10% glycerol, protease inhibitor cocktail [Roche], phosphatase inhibitor cocktail [Roche]) and resolved on 15% SDS-PAGE gels. The following primary antibodies were used: anti-LC3 (1:1000; Sigma-Aldrich), anti-Flag (1:1000; Sigma-Aldrich), anti-actin (1:10,000; Sigma-Aldrich), anti-GAPDH (1:2000; Cell Signaling), anti-Mad2 (1:1000; Bethyl Laboratories), anti-Bub1 (1:2000; Abcam), anti-vinculin (1:5000; Sigma-Aldrich), anti-cathepsin D (1:2000; Abcam), anti-GFP (1:5000; Roche), anti-Histone H3 (1:1000; Cell Signaling), and anti-p62 (1:500; Santa Cruz Biotechnology).
RNAi
siRNA primers to knock down BUB1, MAD2, and TFEB are described in the Supplemental Material and were transfected using Lipofectamine 2000 or RNAiMAX (Invitrogen). For BUB1 and MAD2 depletion, cells were transfected twice with siRNAs (unless otherwise stated); for TFEB, cells were transfected only once.
Quantitative RT–PCR
Total RNA was isolated using the RNeasy minikit (Qiagen). RNA (750 ng) was used to generate cDNAs using the SuperScript III first strand synthesis system (Life Technologies). Quantitative PCR was performed by mixing SYBR Green supermix (Bio-Rad) with the primers described in Supplemental Table 1 and amplified using a LightCycler 480 II (Roche) with TBP as a normalization control.
Cell death assays
Cell death was monitored by LDH release (Roche) following the manufacturer's instructions. Briefly, cells were treated for 24 h with 0.5 µM reversine or 2 µM AZ3146. Cells were then washed with PBS, and LDH release was measured 48 h later. Staurosporine (1 µM) was used as a positive control. Annexin V (BD Pharmigen) detection was performed as described previously (Tang et al. 2011).
Cell imaging methods
For fluorescence imaging, RPE-1 cells were plated onto coverslips coated with 10 μg/mL fibronectin (Sigma-Aldrich). Cells were fixed using a methanol/acetone mix for 5 min at −20°C, treated with 4% BSA-PBS, and incubated with the appropriate antibodies diluted in BSA-PBS. The following antibodies were used for immunofluorescence: rabbit anti-LC3 (1:50; Sigma-Aldrich), mouse anti-LAMP-2 (1:200; Abcam), mouse anti-Flag (1:1000; Sigma-Aldrich), anti-centromeric antibody (1:100; Antibodies), and mouse anti-tubulin (1:2000; Sigma-Aldrich). Alexa 488- and Alexa 546-labeled secondary antibodies were from Invitrogen. DyLigth649-conjugated secondary antibody was purchased from Jackson ImmunoResearch Laboratories. DNA was stained with Hoechst. The coverslips were mounted using Prolong Gold anti-fade reagent (Life Technologies).
EdU incorporation into DNA was visualized using the Click-iT EdU Alexa fluor 647 imaging kit (Invitrogen) following the manufacturer's instructions. Briefly, RPE-1 cells were synchronized by thymidine block/release. Six hours after thymidine washout, cells were treated with 0.5 µM reversine or solvent alone for 9 h. EdU was added to the growth medium 10 h after thymidine release, and cells were fixed using 4% paraformaldehyde 72 h later.
Cells were imaged at 25°C using a DeltaVision Elite imaging system (Applied Precision), a microscope (model IX-71, Olympus) controlled by SoftWoRx software (Applied Precision) with a 60× objective lens, and a CoolSNAP HQ2 camera (Photometrics) or using a Nikon digital sight DS-Qi1 MC camera on a Nikon Eclipse Ti inverted microscope. Images were acquired as Z-sections at 0.3 μm (DeltaVision) and converted into maximal intensity projections using SoftWoRx (Applied Precision) software. Deconvolution was performed using a constrained iterative algorithm in SoftWoRx. Quantification of fluorescence intensity as well as of LC3, p62, and LAMP-2 staining was conducted using SoftWoRx (Applied Precision) or the NIS-Element AR 3.0 (Nikon) software. Images were imported in Photoshop CS5.1 (Adobe Systems, Inc.), and levels were adjusted. Figures were assembled in Illustrator CS5.1 (Adobe Systems, Inc.).
For 3D superresolution microscopy, fixed cells were imaged with an OMX-3D superresolution microscope, V3 type (Applied Precision, GE), equipped with 405-, 488-, and 594-nm lasers and three Photometrics Cascade II EMCCD cameras. Images were acquired with a 100×, NA 1.4 oil objective at 0.125-µm Z steps using 1.512 immersion oil at room temperature. The images were acquired under the same illumination settings (405-nm laser at 10% strength for 150 msec, 488-nm laser at 31.3% strength for 300 msec, and 593-nm laser at 31.3% strength for 200 msec) and then processed with OMX SoftWoRx software (Applied Precision, GE). Images were saved in the TIFF format of maximum projections of 12 × 0.125-µm Z-section stack. Movie files were generated from the DV files using the SoftWoRx software and saved as QuickTime movies.
For Lysotracker (Invitrogen) fluorescence imaging, RPE-1 cells were exposed to the indicated drug treatments in phenol red-free DMEM. Fluorescence images were acquired using a Nikon digital sight DS-Qi1 MC camera on a Nikon Eclipse Ti inverted microscope. Images were acquired and processed using the NIS-Element AR 3.0 software.
All electron microscopy reagents were from Ted Pella, Inc. Cell monolayers were fixed with 2.5% glutaraldehyde and 2.5% formaldehyde in 0.1 M sodium cacodylate-HCl (pH 7.2) for 60 min and post-fixed with 2% osmium tetroxide for 60 min at 4°C followed by dehydration in graded alcohol up to 70% and en bloc staining with 0.2% uranyl acetate in 70% alcohol for 60 min at 4°C. Samples were then processed for epon embedding. Thin epon sections (∼400 nm) were cut with a diamond knife and post-stained with uranyl acetate and Reynold's lead citrate and viewed with a FEI-Tecnai G2 Spirit BioTwin operated at 80 kV. Digital images were taken with an AMT 2k CCD camera (Harvard Medical School Electron Microscopy Facility). Multiple fields were imaged at low magnification (2400× and 4800×) and high magnification (11,000× and 13,000×) for each sample. The sizes of lysosomes and autophagosomes were measured on low-magnification fields in control and drug-treated cells using ImageJ.
Lysosomal pH measurement
Lysosomal pH was determined using Lysosensor yellow/blue DND-160 (Invitrogen). RPE-1 cells were seeded into a black 96-well plate and exposed to 10 μM Lysosensor yellow/blue DND-160 for 10 min. The samples were then washed with PBS, placed in MES buffer (5 mM NaCl, 115 mM KCl, 1.3 mM MgSO4, 25 mM MES at pH 7.2), and read in a Tecan Infinite 200Pro fluorometer (Tecan) with excitation at 340 and 380 nm. Fluorescence emission intensity was recorded at 530 nm. The ratio of light excited at 340/380 nm was calculated, and pH values were determined from a calibration curve obtained by exposing cells to MES buffer with the pH adjusted to a range from 4.0 to 6.5 in the presence of 10 μM H+/Na+ ionophore monensin and 10 μM H+/K+ ionophore nigericin.
Cathepsin B and cathepsin L enzymatic assays
Enzymatic activities of cathepsin B and cathepsin L were determine using the fluorometric cathepsin B activity kit (Abcam) and magic red cathepsin L assay kit (Immunochemistry Technologies), respectively, following the manufacturer's instructions. Briefly, RPE-1 cells were treated with 0.5 μM reversine for 24 h and then washed and assayed 48 h later. Samples were seeded into a black 96-well plate and read in a Tecan Infinite 200Pro fluorometer (Tecan). Cathepsin B inhibitor (Abcam) was used as positive control in cathepsin B assays.
RNA sequencing (RNA-seq) data processing and analysis
For RNA-seq analysis, cells were treated with either 0.5 μM reversine for 24 h and then washed and harvested 48 h later or 0.1 μM BafA1 or 1 μM MG132 for 6 and 24 h, respectively. Total RNA was isolated using the RNeasy minikit (Qiagen).
Quality control of single-ended reads was performed by aligning reads to the human genome (hg19) with TopHat 2.0.9. Alignment rates to various genomic features were counted and summarized using Bedtools 2.17.0 and a series of custom scripts. The quality control results were all within acceptable ranges.
To quantify expression, reads were aligned using RSEM 1.2.6 with Bowtie 1.0.0 to a reference transcriptome based on ensemble hg19 assembly GRCh37 release 68. The arguments fragment-length-mean and fragment-length-sd were specified according to presequencing bioanalyzer data. Differential expression testing was conducted using pme_expected_count data and R 2.15.3 and DESeq 1.10.1. FPKM (fragments per kilobase per million mapped fragments) values in log2 space were used as input data for a single-sample gene set enrichment analysis (ssGSEA) (Barbie et al. 2009) run using default parameters on the Broad Institute public genePattern server (http://genepattern.broadinstitute.org/gp/pages/index.jsf) on the custom gene sets “regulation of autophagy” and “TFEB-responsive genes” (categories and gene lists are described in Supplemental Table 1). ssGSEA projections were then normalized by subtracting the average value of all projections for each gene set from each individual projection value. Normalized ssGSEA projections were then clustered using Ward's method as implemented by Tibco Spotfire 6.5.2. Count, FPKM, and log2 FPKM data as well as differential expression results are in Supplemental Table 1.
Statistical analysis
The statistical significance of the difference between groups was determined using the statistical tests indicated in the figure legends. Differences were considered significant for P < 0.05 (noted in figures as * for P < 0.05, ** for P < 0.01, and *** for P < 0.001). All statistical tests were performed using GraphPad Prism version 5.0 for Mac OS X (GraphPad Software). Each experiment was repeated twice or more. Data are presented as the average of independent experiments ± SEM (standard error of the mean) unless otherwise noted.
Deposited data
The RNA-seq data sets generated for this study can be accessed at Gene Expression Omnibus (GEO) database with the accession number GSE60570.
Supplementary Material
Acknowledgments
We tare grateful to Hilla Weidberg for her suggestions, insights, and expertise. We thank Josef Mautner, Iain Cheeseman, Roberto Zoncu, Prasad Jallepalli, David Pellman, Leona Samson, and Mike Hemann for reagents. We are grateful to Andrea Ballabio, Iain Cheeseman, Frank Solomon, Roberto Zoncu, and members of the Amon laboratory for discussions and reading of the manuscript. We thank Duan Ma and Charlie Whittaker of the Barbara K. Ostrom (1978) Bioinformatics and Computing Facility Koch Institute in the Swanson Biotechnology Center for help with the gene expression analysis. This work was supported by the National Institutes of Health (GM056800 to A.A.) and the Kathy and Curt Marble Cancer Research Fund. A.A is also an investigator of the Howard Hughes Medical Institute and the Glenn Foundation for Biomedical Research. S.S. was supported by the American Italian Cancer Foundation (AICF) and by a Fellowship in Cancer Research from Marie Curie Actions and the Italian Association for Cancer Research (AIRC). E.W. acknowledges support from the National Institutes of Health (grants R01 CA163591 and R01 CA130893).
Footnotes
Supplemental material is available for this article.
Article published online ahead of print. Article and publication date are online at http://www.genesdev.org/cgi/doi/10.1101/gad.269118.115.
References
- Bagatell R, Whitesell L. 2004. Altered Hsp90 function in cancer: a unique therapeutic opportunity. Mol Cancer Ther 3: 1021–1030. [PubMed] [Google Scholar]
- Barbie DA, Tamayo P, Boehm JS, Kim SY, Moody SE, Dunn IF, Schinzel AC, Sandy P, Meylan E, Scholl C, et al. 2009. Systematic RNA interference reveals that oncogenic KRAS-driven cancers require TBK1. Nature 461: 108–112. [DOI] [PMC free article] [PubMed] [Google Scholar]
- Bjorkoy G. 2005. p62/SQSTM1 forms protein aggregates degraded by autophagy and has a protective effect on huntingtin-induced cell death. J Cell Biol 171: 603–614. [DOI] [PMC free article] [PubMed] [Google Scholar]
- Davoli T, Xu AW, Mengwasser KE, Sack LM, Yoon JC, Park PJ, Elledge SJ. 2013. Cumulative haploinsufficiency and triplosensitivity drive aneuploidy patterns and shape the cancer genome. Cell 155: 948–962. [DOI] [PMC free article] [PubMed] [Google Scholar]
- Dephoure N, Hwang S, O'Sullivan C, Dodgson SE, Gygi SP, Amon A, Torres EM. 2014. Quantitative proteomic analysis reveals posttranslational responses to aneuploidy in yeast. eLife 3: e03023. [DOI] [PMC free article] [PubMed] [Google Scholar]
- Ditchfield C, Johnson VL, Tighe A, Ellston R, Haworth C, Johnson T, Mortlock A, Keen N, Taylor SS. 2003. Aurora B couples chromosome alignment with anaphase by targeting BubR1, Mad2, and Cenp-E to kinetochores. J Cell Biol 161: 267–280. [DOI] [PMC free article] [PubMed] [Google Scholar]
- Donnelly N, Passerini V, Dürrbaum M, Stingele S, Storchova Z. 2014. HSF1 deficiency and impaired HSP90-dependent protein folding are hallmarks of aneuploid human cells. EMBO J 33: 2374–2387. [DOI] [PMC free article] [PubMed] [Google Scholar]
- Fry RC, Svensson JP, Valiathan C, Wang E, Hogan BJ, Bhattacharya S, Bugni JM, Whittaker CA, Samson LD. 2008. Genomic predictors of interindividual differences in response to DNA damaging agents. Genes Dev 22: 2621–2626. [DOI] [PMC free article] [PubMed] [Google Scholar]
- Gasch AP, Spellman PT, Kao CM, Carmel-Harel O, Eisen MB, Storz G, Botstein D, Brown PO. 2000. Genomic expression programs in the response of yeast cells to environmental changes. Mol Biol Cell 11: 4241–4257. [DOI] [PMC free article] [PubMed] [Google Scholar]
- Gordon DJ, Resio B, Pellman D. 2012. Causes and consequences of aneuploidy in cancer. Nat Rev Genet 13: 189–203. [DOI] [PubMed] [Google Scholar]
- Guo JY, Xia B, White E. 2013. Autophagy-mediated tumor promotion. Cell 155: 1216–1219. [DOI] [PMC free article] [PubMed] [Google Scholar]
- Hewitt L, Tighe A, Santaguida S, White AM, Jones CD, Musacchio A, Green S, Taylor SS. 2010. Sustained Mps1 activity is required in mitosis to recruit O-Mad2 to the Mad1-C-Mad2 core complex. J Cell Biol 190: 25–34. [DOI] [PMC free article] [PubMed] [Google Scholar]
- Holland AJ, Cleveland DW. 2009. Boveri revisited: chromosomal instability, aneuploidy and tumorigenesis. Nat Rev Mol Cell Biol 10: 478–487. [DOI] [PMC free article] [PubMed] [Google Scholar]
- Kabeya Y, Mizushima N, Ueno T, Yamamoto A, Kirisako T, Noda T, Kominami E, Ohsumi Y, Yoshimori T. 2000. LC3, a mammalian homologue of yeast Apg8p, is localized in autophagosome membranes after processing. EMBO J 19: 5720–5728. [DOI] [PMC free article] [PubMed] [Google Scholar]
- Klionsky DJ. 2007. Autophagy: from phenomenology to molecular understanding in less than a decade. Nat Rev Mol Cell Biol 8: 931–937. [DOI] [PubMed] [Google Scholar]
- Klionsky DJ, Abdalla FC, Abeliovich H, Abraham RT, Acevedo-Arozena A, Adeli K, Agholme L, Agnello M, Agostinis P, Aguirre-Ghiso JA, et al. 2012. Guidelines for the use and interpretation of assays for monitoring autophagy. Autophagy 8: 445–544. [DOI] [PMC free article] [PubMed] [Google Scholar]
- Lamark T, Johansen T. 2012. Aggrephagy: selective disposal of protein aggregates by macroautophagy. Int J Cell Biol 2012: 1–21. [DOI] [PMC free article] [PubMed] [Google Scholar]
- Mizushima N. 2004. Methods for monitoring autophagy. Int J Biochem Cell Biol 36: 2491–2502. [DOI] [PubMed] [Google Scholar]
- Mizushima N, Yoshimori T. 2007. How to interpret LC3 immunoblotting. Autophagy 3: 542–545. [DOI] [PubMed] [Google Scholar]
- Moscat J, Diaz-Meco MT, Wooten MW. 2007. Signal integration and diversification through the p62 scaffold protein. Trends Biochem Sci 32: 95–100. [DOI] [PubMed] [Google Scholar]
- Murphy ME. 2013. The HSP70 family and cancer. Carcinogenesis 34: 1181–1188. [DOI] [PMC free article] [PubMed] [Google Scholar]
- Musacchio A, Salmon ED. 2007. The spindle-assembly checkpoint in space and time. Nat Rev Mol Cell Biol 8: 379–393. [DOI] [PubMed] [Google Scholar]
- Nimmerjahn F, Milosevic S, Behrends U, Jaffee EM, Pardoll DM, Bornkamm GW, Mautner J. 2003. Major histocompatibility complex class II-restricted presentation of a cytosolic antigen by autophagy. Eur J Immunol 33: 1250–1259. [DOI] [PubMed] [Google Scholar]
- Oromendia AB, Amon A. 2014. Aneuploidy: implications for protein homeostasis and disease. Dis Model Mech 7: 15–20. [DOI] [PMC free article] [PubMed] [Google Scholar]
- Oromendia AB, Dodgson SE, Amon A. 2012. Aneuploidy causes proteotoxic stress in yeast. Genes Dev 26: 2696–2708. [DOI] [PMC free article] [PubMed] [Google Scholar]
- Pavelka N, Rancati G, Zhu J, Bradford WD, Saraf A, Florens L, Sanderson BW, Hattem GL, Li R. 2010. Aneuploidy confers quantitative proteome changes and phenotypic variation in budding yeast. Nature 468: 321–325. [DOI] [PMC free article] [PubMed] [Google Scholar]
- Santagata S, Mendillo ML, Tang YC, Subramanian A, Perley CC, Roche SP, Wong B, Narayan R, Kwon H, Koeva M, et al. 2013. Tight coordination of protein translation and HSF1 activation supports the anabolic malignant state. Science 341: 1238303. [DOI] [PMC free article] [PubMed] [Google Scholar]
- Santaguida S, Amon A. 2015. Short- and long-term effects of chromosome mis-segregation and aneuploidy. Nat Rev Mol Cell Biol 16: 473–485. [DOI] [PubMed] [Google Scholar]
- Santaguida S, Tighe A, D'Alise AM, Taylor SS, Musacchio A. 2010. Dissecting the role of MPS1 in chromosome biorientation and the spindle checkpoint through the small molecule inhibitor reversine. J Cell Biol 190: 73–87. [DOI] [PMC free article] [PubMed] [Google Scholar]
- Schvartzman J-M, Sotillo R, Benezra R. 2010. Mitotic chromosomal instability and cancer: mouse modelling of the human disease. Nat Rev Cancer 10: 102–115. [DOI] [PMC free article] [PubMed] [Google Scholar]
- Settembre C, Di Malta C, Polito VA, Arencibia MG, Vetrini F, Erdin S, Erdin SU, Huynh T, Medina D, Colella P, et al. 2011. TFEB links autophagy to lysosomal biogenesis. Science 332: 1429–1433. [DOI] [PMC free article] [PubMed] [Google Scholar]
- Settembre C, Zoncu R, Medina DL, Vetrini F, Erdin S, Erdin S, Huynh T, Ferron M, Karsenty G, Vellard MC, et al. 2012. A lysosome-to-nucleus signalling mechanism senses and regulates the lysosome via mTOR and TFEB. EMBO J 31: 1095–1108. [DOI] [PMC free article] [PubMed] [Google Scholar]
- Settembre C, Fraldi A, Medina DL, Ballabio A. 2013. Signals from the lysosome: a control centre for cellular clearance and energy metabolism. Nat Rev Mol Cell Biol 14: 283–296. [DOI] [PMC free article] [PubMed] [Google Scholar]
- Sheltzer JM, Amon A. 2011. The aneuploidy paradox: costs and benefits of an incorrect karyotype. Trends Genet 27: 446–453. [DOI] [PMC free article] [PubMed] [Google Scholar]
- Sheltzer JM, Torres EM, Dunham MJ, Amon A. 2012. Transcriptional consequences of aneuploidy. Proc Natl Acad Sci 109: 12644–12649. [DOI] [PMC free article] [PubMed] [Google Scholar]
- Siegel JJ, Amon A. 2012. New insights into the troubles of aneuploidy. Annu Rev Cell Dev Biol 28: 189–214. [DOI] [PMC free article] [PubMed] [Google Scholar]
- Stingele S, Stoehr G, Peplowska K, Cox J, Mann M, Storchova Z. 2012. Global analysis of genome, transcriptome and proteome reveals the response to aneuploidy in human cells. Mol Syst Biol 8: 608. [DOI] [PMC free article] [PubMed] [Google Scholar]
- Stingele S, Stoehr G, Storchova Z. 2013. Activation of autophagy in cells with abnormal karyotype. Autophagy 9: 246–248. [DOI] [PMC free article] [PubMed] [Google Scholar]
- Suraweera A, Münch C, Hanssum A, Bertolotti A. 2012. Failure of amino acid homeostasis causes cell death following proteasome inhibition. Mol Cell 48: 242–253. [DOI] [PMC free article] [PubMed] [Google Scholar]
- Tang Y-C, Williams BR, Siegel JJ, Amon A. 2011. Identification of aneuploidy-selective antiproliferation compounds. Cell 144: 499–512. [DOI] [PMC free article] [PubMed] [Google Scholar]
- Thompson SL, Compton DA. 2010. Proliferation of aneuploid human cells is limited by a p53-dependent mechanism. J Cell Biol 188: 369–381. [DOI] [PMC free article] [PubMed] [Google Scholar]
- Thorburn RR, Gonzalez C, Brar GA, Christen S, Carlile TM, Ingolia NT, Sauer U, Weissman JS, Amon A. 2013. Aneuploid yeast strains exhibit defects in cell growth and passage through START. Mol Biol Cell 24: 1274–1289. [DOI] [PMC free article] [PubMed] [Google Scholar]
- Torres EM, Sokolsky T, Tucker CM, Chan LY, Boselli M, Dunham MJ, Amon A. 2007. Effects of aneuploidy on cellular physiology and cell division in haploid yeast. Science 317: 916–924. [DOI] [PubMed] [Google Scholar]
- Torres EM, Williams BR, Amon A. 2008. Aneuploidy: cells losing their balance. Genetics 179: 737–746. [DOI] [PMC free article] [PubMed] [Google Scholar]
- Torres EM, Dephoure N, Panneerselvam A, Tucker CM, Whittaker CA, Gygi SP, Dunham MJ, Amon A. 2010. Identification of aneuploidy-tolerating mutations. Cell 143: 71–83. [DOI] [PMC free article] [PubMed] [Google Scholar]
- Tyedmers J, Mogk A, Bukau B. 2010. Cellular strategies for controlling protein aggregation. Nat Rev Mol Cell Biol 11: 777–788. [DOI] [PubMed] [Google Scholar]
- Weaver BAA, Cleveland DW. 2006. Does aneuploidy cause cancer? Curr Opin Cell Biol 18: 658–667. [DOI] [PubMed] [Google Scholar]
- White E. 2012. Deconvoluting the context-dependent role for autophagy in cancer. Nat Rev Cancer 12: 401–410. [DOI] [PMC free article] [PubMed] [Google Scholar]
- Williams BR, Prabhu VR, Hunter KE, Glazier CM, Whittaker CA, Housman DE, Amon A. 2008. Aneuploidy affects proliferation and spontaneous immortalization in mammalian cells. Science 322: 703–709. [DOI] [PMC free article] [PubMed] [Google Scholar]
- Xie Z, Klionsky DJ. 2007. Autophagosome formation: core machinery and adaptations. Nat Cell Biol 9: 1102–1109. [DOI] [PubMed] [Google Scholar]
- Zoncu R, Bar-Peled L, Efeyan A, Wang S, Sancak Y, Sabatini DM. 2011. mTORC1 senses lysosomal amino acids through an inside-out mechanism that requires the vacuolar H+-ATPase. Science 334: 678–683. [DOI] [PMC free article] [PubMed] [Google Scholar]
Associated Data
This section collects any data citations, data availability statements, or supplementary materials included in this article.