Abstract
Background: Imprecise carbohydrate counting as a measure to guide the treatment of diabetes may be a source of errors resulting in problems in glycemic control. Exact measurements can be tedious, leading most patients to estimate their carbohydrate intake. In the presented pilot study a smartphone application (BEAR), that guides the estimation of the amounts of carbohydrates, was used by a group of diabetic patients. Methods: Eight adult patients with diabetes mellitus type 1 were recruited for the study. At the beginning of the study patients were introduced to BEAR in sessions lasting 45 minutes per patient. Patients redraw the real food in 3D on the smartphone screen. Based on a selected food type and the 3D form created using BEAR an estimation of carbohydrate content is calculated. Patients were supplied with the application on their personal smartphone or a loaner device and were instructed to use the application in real-world context during the study period. For evaluation purpose a test measuring carbohydrate estimation quality was designed and performed at the beginning and the end of the study. Results: In 44% of the estimations performed at the end of the study the error reduced by at least 6 grams of carbohydrate. This improvement occurred albeit several problems with the usage of BEAR were reported. Conclusions: Despite user interaction problems in this group of patients the provided intervention resulted in a reduction in the absolute error of carbohydrate estimation. Intervention with smartphone applications to assist carbohydrate counting apparently results in more accurate estimations.
Keywords: diabetes education, mHealth, augmented reality, carbohydrate counting
Carbohydrate-counting has a long history in aiding the treatment of diabetes. Especially for insulin-dependent diabetics carbohydrate-counting is an essential tool to estimate the amount of insulin necessary to account for a given meal. However, carbohydrate-counting is also known to be a difficult task in a real-life setting and associated errors can lead to problems in glycemic control.1 Currently, the most exact method for most foods is to use a scale and associated nutrition facts to calculate the amount of carbohydrates in a given meal. As weighting parts of a meal is not feasible in general, estimation techniques have been developed to be able to judge the amount of carbohydrate by plain sight. This corresponds to translating an estimated volume to grams of carbohydrates. From clinical practice it is known that especially for food with no predefined portion sizes this can be a difficult task. Therefore, most clinics provide carbohydrate-counting education, which has been shown to result in improved glycemic control.2-6 However, according to the American Association of Diabetes Educators (AADE) Diabetes Education Fact Sheet7 in a Roper US Diabetes Patient Market Study conducted from July to September, 2007, of over 16 million diabetes patients in the United States only 26% have seen a diabetes educator in the past 12 months. The results presented by Norris et al8 show that the benefit of self-management education declines 1-3 months after the intervention ceases. Based on these data, it is concluded that, even though most diabetics receive self-management education including a training in carbohydrate-counting when the diabetes is first diagnosed, more regular interventions might be necessary (see also Spiegel et al9).
To give the patient an ubiquitous tool to support training in visual estimation of carbohydrates from meals we designed a mobile augmented reality application (BEAR), which calculates Broteinheiten (BE), an equivalent to carbohydrates commonly used in Austria (1 BE = 12 grams of carbohydrates), for given meals using state-of-the-art smartphone technology for measurement. In mobile augmented reality the camera image is displayed on the smartphone screen and overlaid (augmented) with additional information. In contrast to approaches trying to provide an automated measurement tool to calculate nutritional data from pictures of meals,10-13 we support the intellectual engagement of the patient with the estimation of carbohydrates as the patient rebuilds the shape of her or his food in the augmented reality. As a side effect we calculated conversion factors from volume to weight for several commonly occurring foods, which are given in Table 1. The usability and accuracy of BEAR as well as the potential effects on carbohydrate-counting accuracy were evaluated in a user study with 8 diabetics.
Table 1.
Translation Factors From Gram to Cubic Centimeters for Foods, Which Are Hard to Estimate.
| Food | g/ccm (measured) | g/ccm (USDA sr-27) | USDA sr-27 descriptions |
|---|---|---|---|
| Corn, sweet, canned, cooked | 0.757 | 0.683 | Corn, sweet, yellow, canned, whole kernel, drained solids |
| Bread cubes, dry | 0.687 | 0.833 | Bread stuffing, bread, dry mix, prepared |
| Bread crumbs | 0.218 | 0.450 | Bread crumbs, dry, grated, plain |
| Spaetzle, fresh, cooked | 0.526 | NA | |
| Polenta, cooked | 0.937 | NA | |
| Bread dumplings, cooked | 1.225 | NA | |
| Potato croquettes | 0.474 | NA | |
| Mashed potatoes | 1.048 | 1.008 | Fast foods, potato, mashed |
| Quaker oats, dry | 0.537 | 0.617 | Cereals, Quaker, hominy grits, white, quick, dry |
| Cornflakes, dry | 0.147 | 0.175 | Cereals ready-to-eat, Kellogg, Kellogg’s Frosted Flakes |
| Soup Pearls (“backerbsen”), dry | 0.294 | NA | |
| Chips | 0.094 | 0.142 | Snacks, potato chips, white, restructured, baked |
| Peanut curls (snack) | 0.140 | NA | |
| Spaghetti, cooked | 0.431 | 0.583 | Spaghetti, cooked, unenriched, without added salt |
| Farfalle, cooked | 0.413 | 0.667 | Noodles, egg, cooked, unenriched, without added salt |
| Penne, cooked | 0.380 | 0.667 | Noodles, egg, cooked, unenriched, without added salt |
| Spaetzle, dry, cooked | 0.463 | NA | |
| Fusilli, cooked | 0.433 | 0.667 | Noodles, egg, cooked, unenriched, without added salt |
| Cramignone rigato, cooked | 0.384 | 0.667 | Noodles, egg, cooked, unenriched, without added salt |
| Pretzel sticks (snack) | 0.301 | NA | |
| Salt pretzels (snack) | 0.187 | NA | |
| Rice, white, cooked | 0.557 | 0.658 | Rice, white, long-grain, regular, cooked, unenriched, without salt |
The entry for “rice, white, cooked” was measured in a previous study using an analogous approach.
Methods
The Smartphone Application
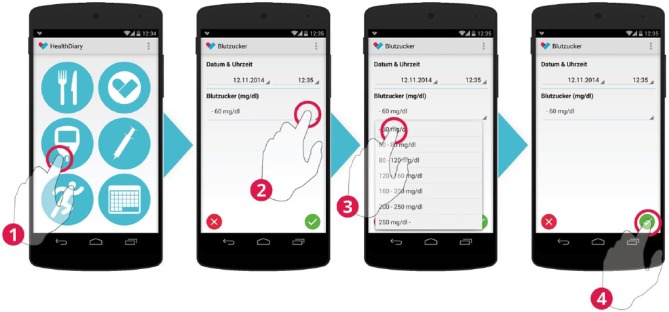
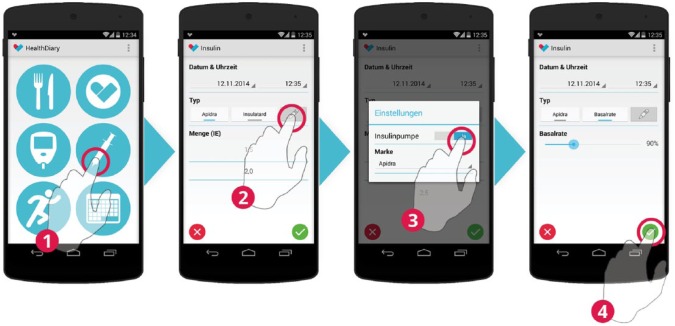
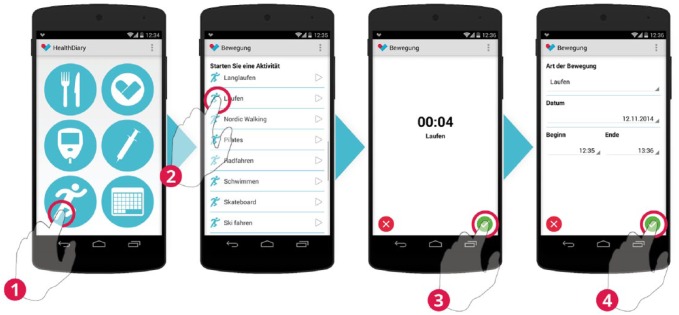
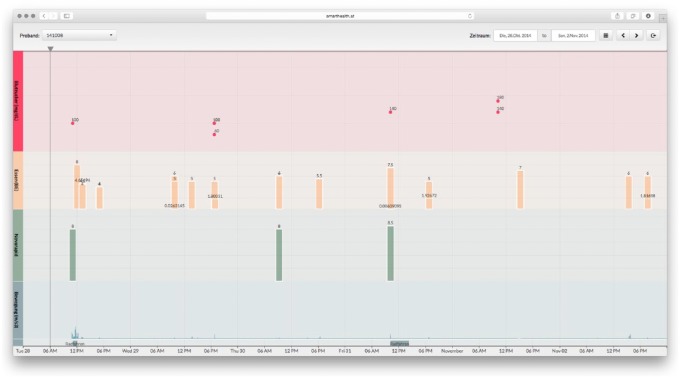
For the study we integrated BEAR into a smartphone-based diabetes diary enabling diabetics to log parameters relevant to glycemic control. The diary helps to keep track of food intake (see Figure 1), blood glucose levels (see Figure 2), insulin injections (see Figure 3), and physical activities (see Figure 4). The user-entered data are transmitted to a server, thereby allowing the information to be accessible for the attending physicians (see Figure 5 for a sample view of the associated web-interface). To log the above-mentioned parameters the app consists of different modules (see Figures 1-4). In contrast to the other modules, BEAR is an augmented reality approach where the shape of different foods on the plate is retraced by the user and the associated amount of carbohydrates is calculated (see Figure 1). For technical details on how to measure volume in augmented reality, see Stütz et al.14 The BE of the retraced foods were calculated based on the volume of the shape of the food in the virtual environment. Therefore, translation factors from food volume to food weight had to be derived.
Figure 1.
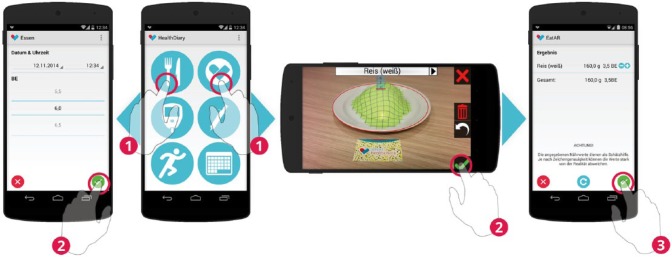
Food intake can be recorded conventionally by counting carbohydrates (left). BEAR provides an alternative to assess the carbohydrates of a meal (right).
Figure 2.
Blood glucose measurements are entered by selecting 1 of 7 blood glucose classes.
Figure 3.
The insulin type is selected and the associated doses are entered in the accuracy of 0.5 IU. For patients treated with CSII, temporal changes to the basal rate may be recorded.
Figure 4.
Physical activities are tracked by selecting an activity. After the selection a clock starts measuring the time. After the activity is finished start and end time may be adjusted before saving the activity.
Figure 5.
The attending physician can access the data entered by the patients online.
Volume-to-Weight Ratios
A set of common foods that tend to be hard to estimate was selected. All foods which require preparation were prepared 1 day in advance according to the guidelines provided on the packaging, placed in an airtight packaging and refrigerated. Foods, which did not require preparation, were stored in the original packaging until the measurements were performed. All measurements were performed during 1 day. Weight was measured using a household scale (Siena, Soehnle) and a measurement cup (measuring cup 1L, plastic, Leifheit). Three measurements were performed for each selected food using different portion sizes. Granular foods were poured into the measurement cup without applying additional force. Solid foods were weighted and subsequently put into watertight plastic bags and submerged in the measurement cup partly filled with water. The associated expulsion was listed as volume. The latter approach was necessary as many solid foods absorb water. Finally, the average of the three weight-to-volume ratios was calculated which is presented in Table 1. As a reference we also calculated weight-to-volume ratios based on the USDA National Nutrient Database for Standard Reference (USDA-NNDSR) where possible. The data in the USDA-NNDSR are collected by the US Department of Agriculture.15 In its latest release (27) it contains data for 8618 different foods. The analysis presented here relies on nutritional information per volume. Therefore, all foods measured in cups were extracted from the database. The definition in the Electronic Code of Federal Regulations (e-CFR) was used to assess the volume of 1 cup, which is defined as 240 ml.16 The weight-to-volume translation factor was calculated by dividing the weight per cup in grams by 240 ml. This resulted in 1718 foods with associated weight-to-volume ratios. We performed an identifier-based search in this list and from the resulting foods in the USDA-NNDSR we selected the 1 with the most similar weight-to-volume ratio to our measurement.
Study Design
Eight participants were recruited at the Diakonissen Hospital Salzburg and the University Hospital Salzburg among patients treated by Raimund Weitgasser and Lars Stechemesser. Only patients treated for diabetes type I were included in the study. Recently diagnosed patients were excluded from the study. The participation was voluntarily and all patients were able to attend the study.
The Diakonissen Hospital Salzburg provided the location for the start and end session of the study. The study duration was set to three weeks. The study started with a guided introduction, an initial questionnaire and the initial experiment in mid-October. The duration of this first session was 45 Minutes per participant. The sessions started with a welcoming of the patients and the reading and signing of the participant information sheet. The participant information sheet included an advice not to use the estimations performed using BEAR for calculation of insulin dosing without additional checks. This was followed by the installation of the smartphone app on the participant’s smartphone. In case the participant did not own a suitable smartphone a prepared loan unit (LG Nexus 5 with Android 4.4) was handed over. The third step included the visual estimation of the carbohydrates of the side dishes of 3 prepared meals. Each plate was covered with a cloche to prevent manual comparisons during the estimation and measurement tasks. The following convenience foods were served on porcelain plates (see Figure 6):
Figure 6.

Three reference meals with different side dishes (spaetzle noodles—meal 1, rice—meal 2, spiral pasta—meal 3).
Meal 1: chicken ragout with spaetzle noodles (“Inzersdorfer Paprikahendl-Ragout mit Nockerln,” EAN 9 002600 638196)
Meal 2: meat patties with rice (“Inzersdorfer Faschierte Laibchen mit Reis,” EAN 9 002600 636994)
Meal 3: onion roast beef with spiral pasta (“Inzersdorfer Zwiebel-Rindsbraten mit Spiralen,” EAN 9 017100 006581)
The carbohydrate content as well as the brand name of the meals was kept disclosed. After the manual estimation task the first questionnaire was completed by the participant. Finally, the interaction with BEAR was practiced. Three different servings of rice (mass of the servings: 100 grams, 200 grams, and 300 grams) were used for the training. Bread unit estimation using BEAR is performed as follows (see Figure 1 for a sample screen):
First, the participant chooses the food on the plate (in our example “rice”) from a list of available foods. The reference marker has to be placed in front of the plate and the marker and the plate have to be in the field of view of the smartphone’s camera. As soon as BEAR recognizes the marker, a red circle marks the drawing area in three dimensions. The participant redraws the shape of the food by touching the smartphones screen (called “mesh deformation” in Stütz et al14). Finally, if satisfied with the drawing, the participant selects the green check mark. The associated BE are transferred to the diabetes diary. The user can apply corrections to the estimated values.
The measurement of each serving was repeated until the deviation between the measurement result and the actual value was less than 0.5 BE (equals 6 grams of carbohydrate).
The study ended in mid-November with a session that took approximately 30 minutes per participant. The participant estimated the side dishes of the same convenience foods as used at the beginning of the study (see Figure 6). In the beginning an unsupported estimation was performed. Afterward the participants were asked to estimate the carbohydrate content of each meal three times in a row using BEAR without any support. The carbohydrate content and the brand name were still kept disclosed. Finally, the second questionnaire was answered by the participant. After the session the participants were informed about their personal estimation accuracy.
A high level of standardization should ensure equal treatment of the participants and reliable results.17 The smartphone apps were introduced with an experiential learning approach:18 the participants explored the applications by themselves and the supervisors were available to answer questions and helped if required. In the questionnaires a combination of closed questions with unipolar scales19 and some open questions were used20 to gather data about our sample of diabetes patients and get information about the satisfaction and perceived usefulness of the smartphone application. The open questions were aimed at obtaining information about problems experienced during the usage and suggestions for improvement. Based on a test in carbohydrate estimation the individual estimation skills of each participant before and after the intervention was measured. All data gathered by the smartphone applications was anonymized. Scheduling and supervision of the participants were strictly separated, such that the supervisors had no names or contact information.
Results
Participants
Eight participants attended the study and 6 participants finished it. Health problems and time constraints were the reason for 2 participants not to finish the study. They were not able to participate in a final session. All subsequent results are given based on the 6 participants who finished the study. The gender distribution showed 5 male participants and 1 female participant. The age distribution is shown in Table 2. The initial diagnosis of each participant with diabetes type I was made from 5 to 47 years ago (mean 29.2 ± 16.0 years). One participant is treated using MDII and all others are treated using CSII. All participants attended at least 1 training course for conventional carbohydrate estimation. Five out of 6 participants owned a smartphone that was mostly used for less than 15 minutes a day (3 out of 5). The other 2 participants used their smartphone up to 2 hours a day. Participant P8 is the only participant who did not have smartphone experience before the study. Three out of 6 participants had experience using tables with nutrition facts as estimations aids and were satisfied using those tables.
Table 2.
Age Distribution in the Sample.
| Age | Frequency |
|---|---|
| 18-39 years | 1 |
| 40-59 years | 3 |
| Older than 60 years | 2 |
Accuracy of Estimations Based on BEAR
The mean duration of the ambulatory assessment was 21.8 ± 4.2 days. During the study 26 estimations using BEAR were performed and saved to the diabetes diary by 4 participants (P2, P4, P5, P8). Of those 26 estimations 24 were accepted as calculated and only 2 estimations were corrected by an amount of less than 0.5 BE = 6 grams of carbohydrates. In general, estimation accuracy using BEAR varied significantly between different participants as seen in Table 3.
Table 3.
Absolute Error for 3 Subsequent Estimations with BEAR on the 3 Reference Meals at the End of the Study.
| Meal 1 | Meal 2 | Meal 3 | |||||||
|---|---|---|---|---|---|---|---|---|---|
| P2 | 0.6 | 0.1 | 0.6 | 1.9 | 1.4 | 1.4 | 1.7 | 1.7 | 2.2 |
| P3 | 0.1 | 0.1 | 0.4 | 0.1 | 0.1 | 0.1 | 0.7 | 0.7 | 1.2 |
| P4 | 0.1 | 0.6 | 1.1 | 0.4 | 0.4 | 0.9 | 0.3 | 0.2 | 0.2 |
| P5 | 0.1 | 1.1 | 0.6 | 1.9 | 0.1 | 0.1 | 1.2 | 0.7 | 0.7 |
| P6 | 0.4 | 0.6 | 0.6 | 0.4 | 0.1 | 0.4 | 2.2 | 1.2 | 1.2 |
| P8 | 2.4 | 2.1 | 2.1 | 2.4 | 2.4 | 2.9 | 2.7 | 2.7 | 2.7 |
Accuracy of Visual Estimations
The comparison of the visual (without technical support) estimation performance for the 3 reference meals before and after the study is presented in Table 4. For most participants and most estimation the absolute error decreased (11 out of 18 estimations). In 44% of the estimations (8 out of 18) the absolute error decreased by at least 0.5 BE = 6 grams of carbohydrates. Only 4 estimations showed a worse absolute error than before the study. The absolute error of the estimations after the study showed the overall good performance of the patients. The average error over all estimations before and after the intervention is given as a box plot21 in Figure 7. In Figure 8 the same data are plotted split by meal. Finally, the statistical analysis of the significance of the difference in estimation accuracy before and after the study was performed on the absolute relative error in estimation accuracy (see Figure 9) to account for the differences in carbohydrate content in each meal. We performed a 1-sided Wilcoxon signed rank test with the following hypotheses:
Table 4.
Visual Estimation Performance on the 3 Reference Meals.
| Δ absolute error |
Absolute error after intervention |
|||||
|---|---|---|---|---|---|---|
| Meal 1 | Meal 2 | Meal 3 | Meal 1 | Meal 2 | Meal 3 | |
| P2 | −0.50 | 1.20 | −0.90 | 0.10 | 1.60 | 0.30 |
| P3 | −0.50 | −1.50 | −0.50 | 0.10 | 0.40 | 0.70 |
| P4 | 0.50 | −0.30 | 0.00 | 0.60 | 0.10 | 1.20 |
| P5 | 0.00 | −0.75 | −1.10 | 0.40 | 0.60 | 0.20 |
| P6 | 0.00 | 0.50 | −0.25 | 0.10 | 0.60 | 0.70 |
| P8 | −0.05 | −0.80 | 0.50 | 0.10 | 0.10 | 0.70 |
Figure 7.
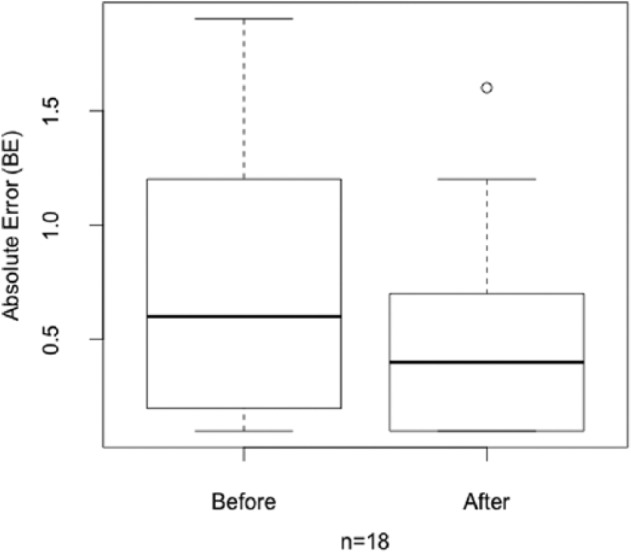
Absolute estimation error before and after the intervention.
Figure 8.
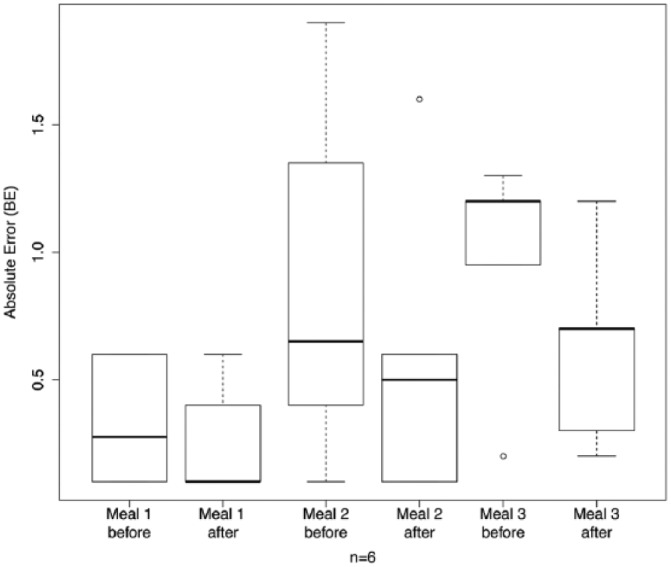
Absolute estimation error per meal before and after the intervention.
Figure 9.
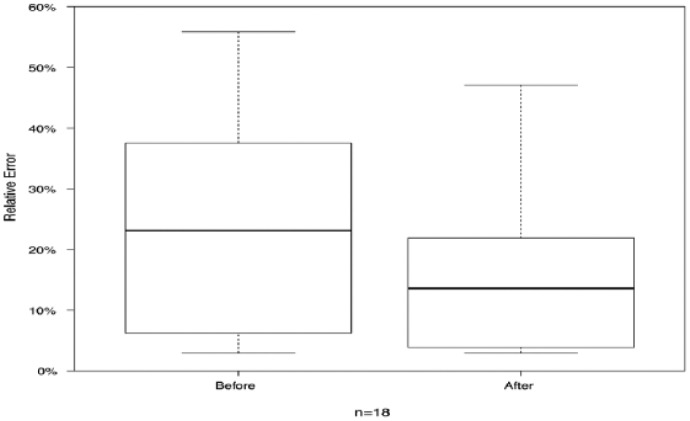
Absolute relative estimation error before and after the intervention.
Hypothesis 0: The absolute relative error after the study is greater or equal than the average absolute relative error before the study.
Hypothesis 1: The absolute relative error after the study is less than the average absolute relative error before the study.
Δ absolute error is calculated as the absolute error after the study minus the absolute error before the study. All numbers refer to bread unit differences. The p-value for hypothesis 1 resulted to .9483.
App Usage
A content analysis according to Mayring22 was performed on the qualitative data. All statements of the participants were categorized manually and the resulting categories were ranked according the number of corresponding statements. This analysis of the qualitative data resulted in 7 problems related to interaction with BEAR, where the number of statements is given in parentheses: the orientation and positioning of the reference marker to the plate is awkward (3), the drawing of the food is too complex (3), the duration of a measurement performed with BEAR is too long (3), the precision of a measurement performed with BEAR is too imprecise (3), food on the plate is missing in the predefined selection within BEAR (2), the use of smartphones is culturally unacceptable at the dining table (1), it is not possible to use BEAR for a dish of several mixed foods (1).
Unexpected Observations
The unexpected observations of the study included problems with smartphone interaction in general as well as individual habits of the participants. The interaction with the smartphone touch screen was difficult with dry fingers. Especially older diabetes patients often suffer from this condition due to frequent hand washing and disinfection prior to blood glucose measurements. In addition, the interaction with BEAR required an unusual hand posture: The smartphone is held with one hand while the other hand has to perform the drawing task. In most cases the elbows were not placed on an armrest or on the table such that the whole hand-arm system (including shoulders) influenced the precision of the drawing. Due to the small size of the plastic frames surrounding the smartphone’s touch screen, in many cases fingers involuntarily touched the touch screen such that all other touch screen interaction was blocked. In addition, the camera on most smartphones is placed in a corner, where it can be obscured by a finger when the smartphone is held in landscape orientation.
Discussion
In this work a pilot study analyzing the effect of a mobile augmented reality application (BEAR) on the carbohydrate estimation accuracy of diabetic patients has been presented. Based on the minor corrections of the values estimated using BEAR in daily life together with the evaluation of the performance when using BEAR on the 3 reference meals it is concluded that the daily life estimations of the more experienced users (P4, P5) had sufficient accuracy. Despite the fairly low usage of BEAR, this time efficient intervention resulted in improved estimation accuracy as shown by tests performed at the beginning and the end of the study. BEAR provides a possibility to refresh memory on former diabetes education and the sketching of the food in 3 dimensions promotes the intellectual engagement with accurate visual estimation of carbohydrates. We assume that this improvement in carbohydrate counting will also result in improved glycemic control and thereby benefits the patients participating. Improvements in glycemic control during the study could not be evaluated properly as only 13 postprandial blood glucose measurements were recorded (1 to 3 hours after a meal). Based on the interviews with the patients it seems that most patients to date have their personal (electronic) way of logging data relevant to glycemic control and therefore using the diabetes diary represents additional work with little benefit. In further studies, we will try to integrate the individual ways to log relevant parameters (blood glucose measurements, insulin doses, carbohydrate intake, etc) into our study.
Conclusion
This study was designed as a pilot study to evaluate the meaningfulness of further exploring this topic. Our results suggest that supporting diabetes education on carbohydrate counting by state-of-the-art mobile technology represents a promising research topic.
Acknowledgments
We thank Hannelore Schlager, dietologist and diabetic therapist at the Diakonissen hospital Salzburg, for her help in selecting the participants and organizing the start- and end-study meetings.
Footnotes
Abbreviations: AADE, American Association of Diabetes Educators; BE, Broteinheiten, German for bread units, equivalent of 12 grams of carbohydrates; USDA-NNDSR, USDA National Nutrient Database for Standard Reference.
Declaration of Conflicting Interests: The author(s) declared no potential conflicts of interest with respect to the research, authorship, and/or publication of this article.
Funding: The author(s) disclosed receipt of the following financial support for the research, authorship, and/or publication of this article: This work was funded by the Austrian research promotion agency (FFG), project number 839076.
References
- 1. Brazeau AS, Mircescu H, Desjardins K, et al. Carbohydrate counting accuracy and blood glucose variability in adults with type 1 diabetes. Diabetes Res Clin Pract. 2013;99(1):19-23. doi: 10.1016/j.diabres.2012.10.024. [DOI] [PubMed] [Google Scholar]
- 2. Gökşen D, Atik Altınok Y, Özen S, Demir G, Darcan Ş. Effects of carbohydrate counting method on metabolic control in children with type 1 diabetes mellitus. J Clin Res Pediatr Endocrinol. 2014;6(2):74-78. doi: 10.4274/jcrpe.1191. [DOI] [PMC free article] [PubMed] [Google Scholar]
- 3. Marigliano M, Morandi A, Maschio M, et al. Nutritional education and carbohydrate counting in children with type 1 diabetes treated with continuous subcutaneous insulin infusion: the effects on dietary habits, body composition and glycometabolic control. Acta Diabetol. 2013;50(6):959-964. doi: 10.1007/s00592-013-0491-9. [DOI] [PubMed] [Google Scholar]
- 4. Martins MR, Ambrosio AC, Nery M, Aquino Rde C, Queiroz MS. Assessment guidance of carbohydrate counting method in patients with type 2 diabetes mellitus. Prim Care Diabetes. 2014;8(1):39-42. doi: 10.1016/j.pcd.2013.04.009. [DOI] [PubMed] [Google Scholar]
- 5. Laurenzi A, Bolla AM, Panigoni G, et al. Effects of carbohydrate counting on glucose control and quality of life over 24 weeks in adult patients with type 1 diabetes on continuous subcutaneous insulin infusion: a randomized, prospective clinical trial (GIOCAR). Diabetes Care. 2011;34(4):823-827. doi: 10.2337/dc10-1490. [DOI] [PMC free article] [PubMed] [Google Scholar]
- 6. Weitgasser R, Clodi M, Kacerovsky-Bielesz G, et al. Diabetes education in adult diabetic patients. Wien Klin Wochenschr. 2012;124(2):87-90. doi: 10.1007/s00508-012-0289-8. [DOI] [PubMed] [Google Scholar]
- 7. American Association of Diabetes Educators (AADE). Roper US Diabetes Patient Market Study; Jul-Sep, 2007: http://www.diabeteseducator.org/export/sites/aade/_resources/pdf/research/Diabetes_Education_Fact_Sheet_09-10.pdf
- 8. Norris SL, Lau J, Smith SJ, Schmid CH, Engelgau MM. Self-management education for adults with type 2 diabetes: a meta-analysis of the effect on glycemic control. Diabetes Care. 2002;25(7):1159-1171. [DOI] [PubMed] [Google Scholar]
- 9. Spiegel G, Bortsov A, Bishop FK, et al. Randomized nutrition education intervention to improve carbohydrate counting in adolescents with type 1 diabetes study: is more intensive education needed? J Acad Nutr Diet. 2012;112(11):1736-1746. doi: 10.1016/j.pcd.2013.04.009. [DOI] [PMC free article] [PubMed] [Google Scholar]
- 10. Anthimopoulos MM, Gianola L, Scarnato L, Diem P, Mougiakakou SG. A food recognition system for diabetic patients based on an optimized bag-of-features model. IEEE J Biomed Health Inform. 2014;18(4):1261-1271. doi: 10.1109/JBHI.2014.2308928. [DOI] [PubMed] [Google Scholar]
- 11. Kitamura C, de Silva T, Yamasaki K. Aizawa. Image processing based approach to food balance analysis for personal food logging. Int Conf Multimedia Expo. 2010:625-630. doi: 10.1109/ICME.2010.5583021. [DOI] [Google Scholar]
- 12. Zhu F, Bosch M, Woo I, et al. The use of mobile devices in aiding dietary assessment and evaluation. IEEE J Sel Top Signal Process. 2010;4(4):756-766. doi: 10.1109/JSTSP.2010.2051471. [DOI] [PMC free article] [PubMed] [Google Scholar]
- 13. Noronha J, Hysen E, Zhang H, Gajos KZ. Platemate: crowdsourcing nutritional analysis from food photographs. In: Proceedings of the 24th Annual ACM Symposium on User Interface Software and Technology 2011:1-12. doi: 10.1145/2047196.2047198. [DOI] [Google Scholar]
- 14. Stütz T, Dinic R, Domhardt M, Ginzinger S. Can mobile augmented reality systems assist in portion estimation? A user study. Mixed Augmented Reality. 2014:51-57. doi: 10.1109/ISMAR-AMH.2014.6935438. [DOI] [Google Scholar]
- 15. US Department of Agriculture. Composition of foods raw, processed, prepared, USDA national nutrient database for standard reference, release 27, documentation and user guide. 2014. http://www.ars.usda.gov/sp2UserFiles/Place/12354500/Data/SR27/sr27_doc.pdf.
- 16. US Government Printing Office. Electronic code of federal regulations: §101.9 nutrition labeling of food. 2014. http://www.ecfr.gov/cgi-bin/retrieveECFR?gp=1&SID=37b578dfb011937448ffadb559118b6f&ty=HTML&h=L&r=SECTION&n=se21.2.101_19.
- 17. Eid M, Gollwitzer M, Schmitt M. Statistik und Forschungsmethoden. Weinheim, Germany: Betz; 2010. [Google Scholar]
- 18. Moon JA. A Handbook of Reflective and Experiential Learning—Theory and Practice. London, UK: Routledge Falmer; 2004. [Google Scholar]
- 19. Borg I, Staufenbiel T. Lehrbuch Theorien und Methoden der Skalierung. 4th ed. Bern, Switzerland: Hans Huber; 2007. [Google Scholar]
- 20. Van de Loo K. Befragung—questionnaire survey. In: Holling H, Schmitz B, eds. Handbuch Statistik, Methoden und Evaluation. Handbuch der Psychologie. Vol. 13 Göttingen, Germany: Hogrefe; 2010:131-138. [Google Scholar]
- 21. Chambers JM, Cleveland WS, Kleiner B, Tukey PA. Graphical Methods for Data Analysis. Pacific Grove, CA: Wadsworth & Brooks/Cole; 1983. [Google Scholar]
- 22. Mayring P. Qualitative Inhaltsanalyse—Grundlagen und Techniken. 11th ed. Weinheim, Germany: Beltz; 2010. [Google Scholar]


