

Abstract
Background: Individuals with type 1 diabetes (T1D) have to count the carbohydrates (CHOs) of their meal to estimate the prandial insulin dose needed to compensate for the meal’s effect on blood glucose levels. CHO counting is very challenging but also crucial, since an error of 20 grams can substantially impair postprandial control. Method: The GoCARB system is a smartphone application designed to support T1D patients with CHO counting of nonpacked foods. In a typical scenario, the user places a reference card next to the dish and acquires 2 images with his/her smartphone. From these images, the plate is detected and the different food items on the plate are automatically segmented and recognized, while their 3D shape is reconstructed. Finally, the food volumes are calculated and the CHO content is estimated by combining the previous results and using the USDA nutritional database. Results: To evaluate the proposed system, a set of 24 multi-food dishes was used. For each dish, 3 pairs of images were taken and for each pair, the system was applied 4 times. The mean absolute percentage error in CHO estimation was 10 ± 12%, which led to a mean absolute error of 6 ± 8 CHO grams for normal-sized dishes. Conclusion: The laboratory experiments demonstrated the feasibility of the GoCARB prototype system since the error was below the initial goal of 20 grams. However, further improvements and evaluation are needed prior launching a system able to meet the inter- and intracultural eating habits.
Keywords: type 1 diabetes, carbohydrate counting, computer vision, smartphone
Individuals with type 1 diabetes (T1D) use prandial insulin doses to balance the effects of a meal.1 The meal’s carbohydrate (CHO) content is a key factor in determining the optimal dose and maintaining normal blood glucose levels. According to clinical studies in insulin-depended children and adolescents, an error of ± 10 grams in CHO counting does not affect postprandial glycemia,2 yet an error of ± 20 grams substantially impairs the postprandial control.3 Diabetics have to attend courses on CHO counting based on empirical rules; however even well trained patients face difficulties, according to studies.4-6 In Brazeau et al,4 the average error in CHO counting by 50 T1D adults was 15.4 ± 7.8 grams, while in Bishop et al5 only 11 of 48 adolescent T1D patients estimated daily CHO with an error less than 10 grams. In a study involving children with T1D and their caregivers, CHO estimations were inaccurate by at least ± 15 grams for 27% of the meals.6
The global spread of diabetes—together with the proven inability of diabetics to accurately assess their diet—raised the urgent need for automated tools and services that will support T1D patients with CHO counting. Recently, the ubiquity of smartphones with enhanced capabilities, along with recent advances in computer vision, has permitted the development of image analysis applications for automatic assessment of food intake.7 The input of such a system consists of a few images or a short video of the upcoming meal, as captured by the user’s smartphone. The data are then processed—either locally or on a remote server—to automatically assess the corresponding nutritional profile by recognizing the types and quantities of foods present.
The first attempt at food recognition was the DiaWear system.8 This system aims to provide calorie information to diabetic patients and considers 4 fast-food products. One photo of the meal is used with the different items separated, the background lighter than the food and a reference object placed next to the food. The nutritional content is directly estimated via reference tables for the specific foods and without attempting to estimate the volume. In Chen et al,9 a panoramic video of a dish is captured and matched with a meal from the database to estimate the calorie content assuming that meals have a fixed size. The Pittsburgh fast food image data set10,11 contained 7 classes of fast food products and it was created to test food recognition algorithms; once again the food portion was not considered. Zhu et al proposed a dietary assessment system in the framework of the TADA project.12 The system uses 1 meal image and considers 19 food classes. Food volume is estimated by fitting spherical or prismatic 3D models on the detected food areas, while the nutritional information is obtained from public databases. However, the use of a single image to estimate the food’s volume inevitably depends on weak assumptions about its 3D shape.
Having multiple food images permitted the utilization of more advanced image analysis methods, especially for the volume estimation. Kong et al13 proposed DietCam, an application for obesity prevention which requires 3 images or a video of a meal to estimate its calories. To this end, each food item is segmented and recognized after being matched to an image database and the volume is estimated by sparsely reconstructing its 3D shape and fitting an appropriate model. However, critical system characteristics, like the food classes considered are not specified, while the proposed matching method is typically used for detection of known objects rather than object classes. Puri et al14 proposed the Food Intake Visual and Voice Recognizer, a system that requires a sequence of images as an input, 3 of which are used to perform dense stereo reconstruction and estimate the volume. Food segmentation and recognition relies on the classification of local image patches and, although 26 food types are supported, the system asks the user to list the existing food types through speech, to enhance classification accuracy. In Pouladzadeh et al,15 a system for calorie measurement was proposed. This system considers 30 food classes and requires 2 images, with the user’s thumb as a reference object. One image is taken from the top to estimate the food area, another from the side to estimate height and then the 2 values are multiplied to obtain the volume. However, capturing the dish from the side obviously causes occlusions, while assuming constant height for all the food items will introduce large errors, as will any misplacement of the thumb.
Although several systems have been proposed for dietary assessment on mobile devices in the past decade, they rely on strong assumptions, which often do not hold in real life, or require too much user input. In the current study, we present the GoCARB system, a smartphone application especially designed to provide CHO estimations to individuals with T1D, by using 2 meal images from different viewing angles with a reference card placed next to the dish. The system is fully automatic with integrated guiding tools for the acquisition of the images, while there are no assumptions about the shape of the food items. The prototype is designed to deal with
Elliptical plates with a flat base
Single-dish images
Fully visible food items
There are 9 broad food classes considered which were defined in collaboration with the Department of Endocrinology, Diabetology and Clinical Nutrition at Bern University Hospital, “Inselspital” (Inselspital). The classes were defined to be consistent both visually and in their CHO density: pasta, potatoes, meat, breaded food, rice, green salad, mashed potatoes, carrots, and red beans.
In the remainder of this article, the system’s outline is briefly presented, followed by the results of the technical evaluation and finally some concluding remarks.
System Outline
The GoCARB system is a smartphone application designed to support T1D patients with CHO counting by providing automatic, accurate and near real-time CHO estimation for non-packed foods. In a typical scenario, the user places a credit card-sized reference object next to the meal and acquires 2 images using his or her smartphone. The first image is acquired above the dish at a distance of 30-40 cm, and the second at 20-30 degrees from the vertical axis crossing the center of the dish. A graphical user interface guides the user in choosing the optimal angles for image acquisition based on the smartphone’s built-in sensors (accelerometer and gravity sensor). The images are then transmitted to a dedicated server via Wi-Fi or the mobile network, where a series of computer vision modules are activated. Specifically, the plate is detected and the different food items on the plate are automatically segmented and recognized, while their 3D shape is reconstructed. On the basis of the shape, the segmentation results and the reference card, the volume of each item is then estimated. The CHO content is calculated by combining the food type with its volume, and by using the USDA nutritional database. Finally, the results are transmitted back to the smartphone and displayed to the user. The conceptual diagram of the developed system is presented in Figure 1. The basic modules of the system are described in the following paragraphs.
Figure 1.
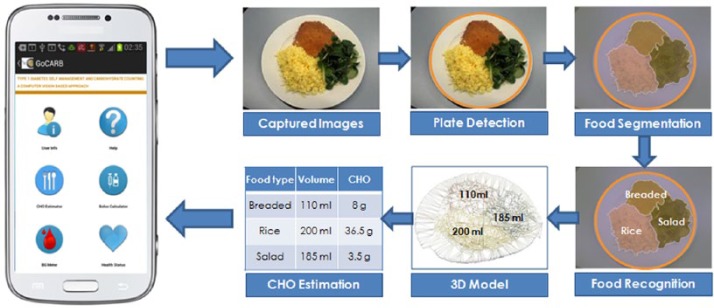
Conceptual diagram of GoCARB.
Visual Database
For the design, development and testing of the system, 2 visual data sets were created, including a broad spectrum of non-packed European foods with arbitrary 3D shapes:
Web data set: 3800 food images downloaded from the Internet. The images are characterized by high visual diversity due to different shooting conditions (background, lighting conditions, angle, arbitrary serving, etc), and they were used for experimenting with the food recognition module.
Inselspital data set: 1620 images from 248 multi-food served meals were acquired under controlled conditions, with the reference card next to the dish. The meals were prepared at the Inselspital’s restaurants. For each meal, the foods were manually identified and localized, while their actual volume and CHO grams were calculated by using a depth sensor and the USDA database. This data set was used for the design, development and evaluation of the all the system modules.
Samples of the created food image data sets are presented in Figure 2.
Figure 2.
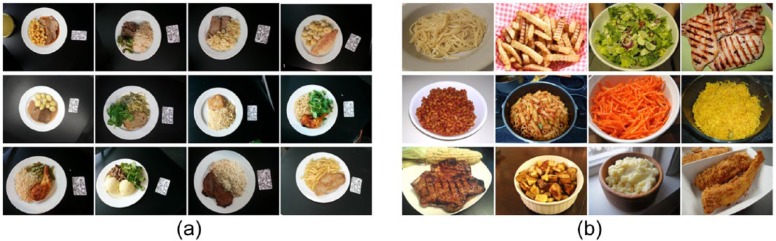
Visual data sets used for training and testing GoCARB’s modules: (a) Inselspital database, (b) web database.
Plate Detection
Plate detection is the first and most crucial module in the proposed system: most of the remaining image analysis modules rely on the precise localization of the plate area to detect and assess the food in an accurate and efficient way. To this end, we use an ellipse detector, which covers all useful types of perspective distortion for an elliptical plate.16 First, the original image (Figure 3a) is downscaled to speed up the execution and then an edge map is generated by the Canny edge detector (Figure 3b).17 The detector requires specific thresholds, which are determined adaptively according to the average gradient magnitute of the image, thus the plate can be detected accurately even in low contrast images. The edges produced are thinned and smoothed before junctions and high curvature points are eliminated. Of the remaining edge segments only those above a size threshold are retained (Figure 3c). Finally, each segment is used as a data point in an incremental random sample consensus (RANSAC) paradigm,18 which fits the appropriate ellipse model to the data (Figure 3d).
Figure 3.

Example of the plate detection method: (a) Original image. (b) Canny edge map. (c) The edge map after eliminating junctions, high curvature points, and small edge segments. (d) The detected ellipse.
Food Segmentation
Segmentation localizes and segments the different food items which are then classified by the recognition module.16 The foods need not be physically separate, but cannot overlap, otherwise the volume estimations would be biased toward the top item. Initially the images are cropped around the previously detected ellipse (Figure 4a) and converted to the CIELAB color space. CIELAB is a perceptually uniform color space, so that the Euclidean distance between 2 colors in the space is equivalent to the visual difference observed by humans. Pyramidal mean-shift filtering19 is then applied which smoothes the fine-grain texture while preserving the dominant color edges (Figure 4b). Thus, pixels of the same food item tend to have colors similar to each other and distinguishable from the rest of the segments. A region growing algorithm follows to merge the pixels of similar colors into segments and produces the initial segmentation (Figure 4c). The proposed region growing algorithm chooses seeds randomly from the nonvisited pixels, and expands them to all directions where the color distance of a neighboring pixel is less than a threshold. Finally, each region with an area under a threshold is merged with its closest neighbor in terms of color (Figure 4d). To eliminate any segments that belong to the background or to the plate, we use the detected ellipse once more. A segment is considered as background if more than 10% of its area is outside the detected plate. Furthermore, if a segment shares borders with the background for more than 10% of its contour’s length it is labeled as a plate region and discarded. The method achieved an accuracy of 88.5% when tested in a data set of manually annotated food images.16
Figure 4.

Example of the food segmentation method: (a) The original image cropped based on the detected plate. (b) The result of the mean-shift filtering. (c) Initial segmentation result after region growing. (d) Final segmentation result after region merging.
Food Recognition
The recognition module consists of 2 stages: description and classification.16 We use color and texture feature sets for the food description, which are both histogram-based so they can be easily computed regardless of the segment’s shape, and normalized by its size. For color features, the histogram of the 1024 most dominant food colors is used. To this end, a hierarchical version of the k-means algorithm20 is applied to cluster the color space created by the training set of food images. Thus, the centers of the generated clusters represent the dominant colors considered. The hierarchical k-means is chosen rather than the original k-means to enhance efficiency during feature calculation. As for texture features, the 256 values of the local binary pattern (LBP)21 histogram are used. After combining color and texture features, a vector of 1280 dimensions is created and fed to a nonlinear support vector machine (SVM),22 with a radial basis function (RBF) kernel that assigns the segment to 1 of 9 predefined food classes. The proposed method succeeded an overall accuracy in the range of 87-90% for different data sets and food classes.16,23 The training and evaluation of the SVM was done within a 10-fold cross-validation scheme to avoid biases and overfitting.
3D Model Reconstruction and Volume Estimation
To estimate the food’s volume, its 3D shape is first reconstructed using passive stereo vision. The input of the system consists of a pair of images from different viewing angles, both including a reference card. The major stages involved are: relative pose estimation, scale extraction, dense reconstruction, and volume estimation.24 To extract the relative camera pose, speeded up robust features (SURF)25 are detected and matched between the 2 images (Figure 5a). RANSAC model fitting18 is then applied to the matched pairs to extract a candidate pose. This pose is subsequently optimized by iteratively minimizing the corresponding error with respect to the valid feature matches as well as the matched plate borders; the resulting pose model is decomposed into translation and rotation operations between the 2 images (Figure 5b). The extraction of the relative pose is made easier by the additional features provided by the strong texture of the reference card, which also serves to extract the scale of the scene in a subsequent step, since the real dimensions of the card are known. Following the extraction of relative pose and scale, the actual reconstruction is made by densely matching points between the 2 images. To this end, image pairs are transformed in such a way that point correspondences lie on the same row, by using a process called polar rectification (Figure 6a).26 In this way, point matching is performed efficiently and, given the pose and scale, the unprojection of correspondences yields a scaled 3D point cloud that defines the food surface (Figure 6b). The plate surface is then defined as the plane of the reference card (the table plane) elevated by an offset representing the thickness of plate’s base. Finally, the volume of each food item is calculated by partitioning the surface according to its projection on the segmentation map, and integrating the space between each subsurface and the plate surface. The volume estimation method has been technically evaluated achieving a mean absolute percentage error of 9.4%.27
Figure 5.
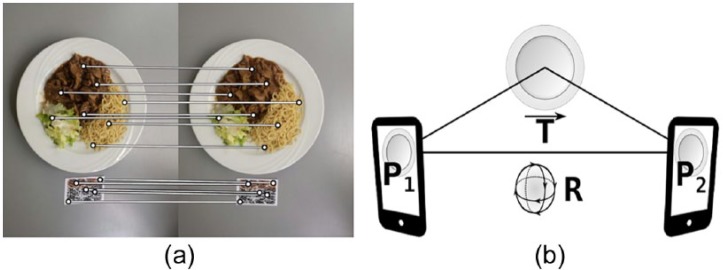
Camera pose extraction: (a) Image keypoint matching. (b) Pose model expressed as 3D rotation and translation.
Figure 6.
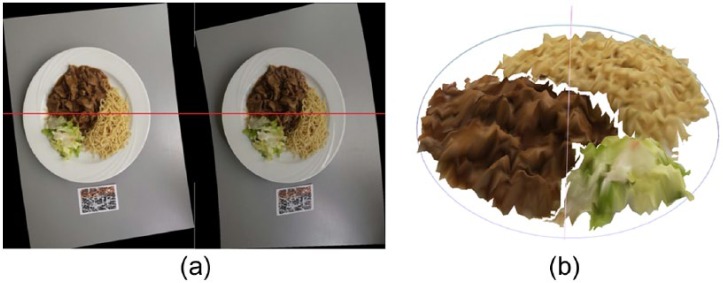
Dense reconstruction: (a) Rectified image pair (correspondences between the images lie in parallel horizontal lines). (b) Scaled 3D point cloud displayed as a surface.
Carbohydrate Estimation
For the final stage of CHO estimation, a table with the CHO to volume densities of each food class was created on the basis of the USDA Food and Nutrient Database for Dietary Studies.28 Since the food classes considered are broader than the items of the USDA database, all the relevant entries for each class were identified and the corresponding CHO densities were averaged to produce the CHO density of the class.
Experimental Setup and Results
To evaluate the accuracy and feasibility of the integrated system, a set of dishes were used, as provided by the restaurants of Inselspital. The set consists of 24 normal-sized dishes that satisfy the system’s assumptions, namely they are served on circular plates, the foods do not overlap and each of them belongs to one of the predefined food categories. The dishes contain a broad variety of foods of different colors, textures and shapes and were captured by the authors under controlled lighting conditions using the GoCARB application. For each dish, 3 different pairs of images were used and for each pair the system ran 4 times (12 estimates per dish or 288 in total). The smartphone used was a Samsung GT-I9505 Galaxy S4 running Android 4.2.2 “Jelly Bean.” To generate the ground truth, food types and locations were manually specified on the images, while the 3D shapes were obtained by scanning the dishes with a commercially available depth sensor, the Xtion PRO LIVE by Asus. Together with the generated nutritional table these data yielded the real CHO content of each of the food items.
Results
Table 1 presents the evaluation results for the 24 dishes in terms of CHO content. Each row corresponds to a different dish; the columns provide the real and estimated CHO content, followed by the absolute error and the relative absolute error. The results are reported as the average and standard deviation of the 12 different estimates. The purpose of this evaluation scheme was to test the repeatability of the system’s results for different viewing angles and the consistency of the modules involving random processes (eg, RANSAC). The final row of the table provides the mean errors for all the dishes. In addition, Figure 7 presents the histograms of errors and relative errors.
Table 1.
Results of the Presented System for the CHO Estimation.
| CHO |
||||
|---|---|---|---|---|
| Real |
Estimated |
Absolute error |
Absolute percentage error |
|
| Dish | Grams | % | ||
| 1 | 78 | 80 (4) | 3 (3) | 4 (4) |
| 2 | 63 | 60 (3) | 3 (3) | 5 (5) |
| 3 | 36 | 36 (2) | 1 (1) | 4 (3) |
| 4 | 68 | 67 (8) | 7 (5) | 10 (7) |
| 5 | 55 | 58 (4) | 4 (3) | 7 (6) |
| 6 | 61 | 55 (6) | 7 (6) | 11 (9) |
| 7 | 86 | 89 (7) | 6 (4) | 7 (5) |
| 8 | 98 | 104 (3) | 6 (3) | 6 (3) |
| 9 | 35 | 35 (1) | 1 (1) | 3 (2) |
| 10 | 41 | 41 (2) | 2 (1) | 5 (4) |
| 11 | 48 | 53 (3) | 5 (2) | 10 (5) |
| 12 | 60 | 64 (7) | 7 (5) | 11 (8) |
| 13 | 54 | 54 (9) | 6 (7) | 11 (12) |
| 14 | 91 | 83 (9) | 10 (7) | 11 (8) |
| 15 | 75 | 80 (7) | 7 (6) | 9 (8) |
| 16 | 51 | 55 (6) | 6 (3) | 12 (7) |
| 17 | 74 | 66 (9) | 9 (8) | 12 (11) |
| 18 | 48 | 53 (3) | 5 (3) | 10 (6) |
| 19 | 64 | 67 (5) | 4 (3) | 7 (5) |
| 20 | 58 | 56 (13) | 8 (9) | 15 (16) |
| 21 | 45 | 42 (3) | 3 (2) | 6 (5) |
| 22 | 43 | 44 (3) | 3 (2) | 7 (5) |
| 23 | 56 | 65 (5) | 9 (5) | 16 (10) |
| 24 | 38 | 37 (6) | 4 (4) | 11 (11) |
| Mean | 6 (8) | 10 (13) | ||
The results are represented by the average (standard deviation) over the 12 estimates for each dish.
Figure 7.
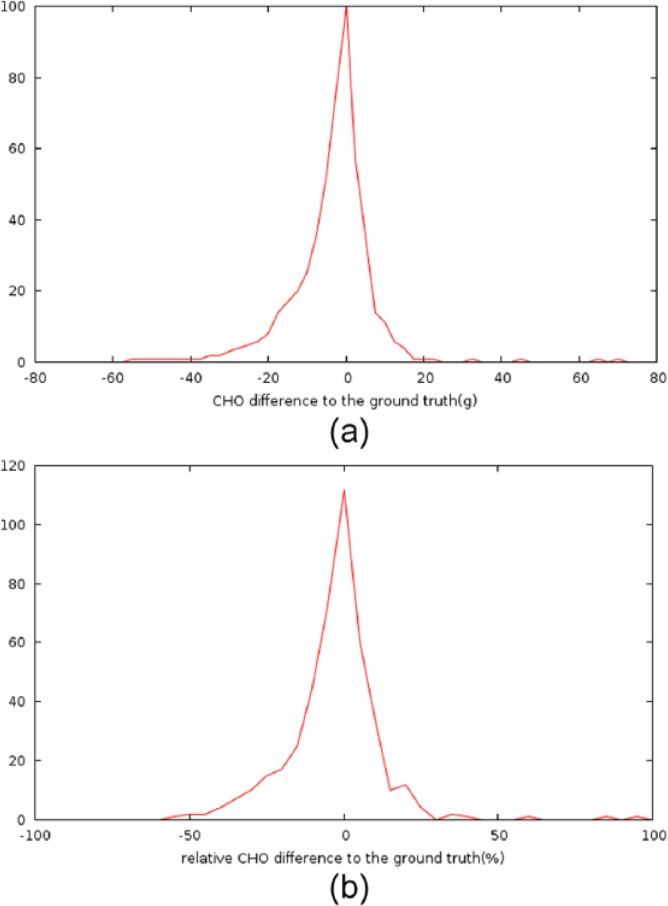
Distribution of the system’s error in CHO counting: (a) Histogram of the errors. (b) Histogram of the relative errors.
According to Table 1, the overall mean absolute error of the system in CHO counting is 6 grams, considerably below the system’s initial target of 20 grams. The standard deviation of the absolute error is 8 grams, which, when added to the mean, still does not exceed the crucial threshold of 20. The same applies to all the individual dishes, thus showing the system’s satisfactory stability. Considering the real size of the served meals, the mean absolute percentage error was computed on average 10% with a standard deviation of 13%. Figure 7 provides additional insight into the CHO results by presenting the entire spread of positive and negative errors. The errors are concentrated around zero and look fairly symmetrical. In 95.5% of the cases, the error is in the range of -20 grams to 20 grams, while 92% of the relative errors lie between –25% and 25%. There are also a few rare cases of large errors (eg, –50%, +80%), which are probably due to poor image quality (e.g., motion blurring) that causes false feature matches between the images (Figure 8). These issues will be further investigated before proceeding to the next evaluation phase of GoCARB, which will involve individuals with T1D.
Figure 8.
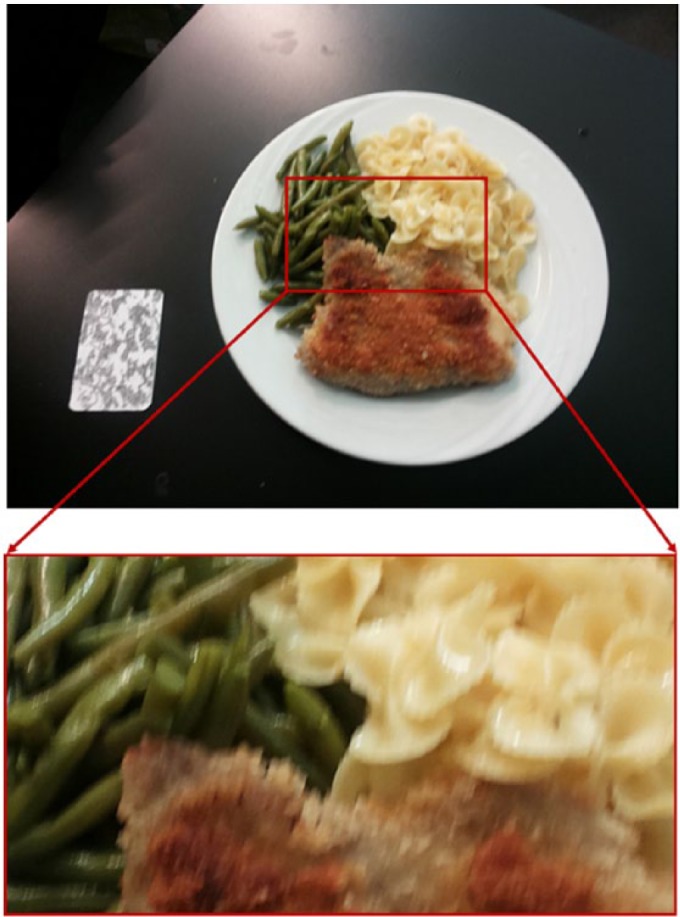
An example of poor image quality. The image that belongs to dish 23 of Table 1 suffers from motion blurring that causes false feature matching and therefore large errors in volume estimation.
Conclusions
In this article, we have presented the first GoCARB prototype: a smartphone-based system especially designed to support T1D patients with CHO counting. As an input, the application uses 2 images from different viewing angles of a dish with a reference card placed next to it. The optimal angles for the image acquisition are indicated by the graphical user interface using the smartphone’s built-in sensors. The images are transmitted to a server, where a series of computer vision steps process them: the plate is detected and the different food items are segmented and recognized, while their volume is estimated after reconstructing its 3D shape. On the basis of the type and volume of each food and the USDA database, the final CHO content is estimated. The prototype was tested on 24 dishes taken from the restaurants of the Inselspital. The mean relative error in CHO estimation was 10 ± 12% which led to a mean absolute error of 6 ± 8 CHO grams for normally sized dishes. The error was below the initial target of 20 grams, the acceptable threshold for maintaining normal postprandial blood glucose levels, demonstrating the feasibility of the proposed system. Based on the results of a preclinical study,29 the system is optimized for a pilot clinical study that will be conducted within the next months and involves individuals with T1D under sensor-augmented pump therapy. Scope of the study will be to investigate whether the postprandial glucose profile is improved by using the GoCARB prototype for CHO estimation. Finally, the optimal way for expanding the system’s considered food classes is investigated to tackle issues related to inter and intra cultural differences in eating habits.
Footnotes
Abbreviations: CHO, carbohydrate; LBP, local binary pattern; RANSAC, random sample consensus, support vector machine; RBF, radial basis function; SURF, speeded up robust features; T1D, type 1 diabetes.
Declaration of Conflicting Interests: The author(s) declared no potential conflicts of interest with respect to the research, authorship, and/or publication of this article.
Funding: The author(s) disclosed receipt of the following financial support for the research, authorship, and/or publication of this article: This work was funded in part by the Bern University Hospital “Inselspital” and the European Union Seventh Framework Programme (FP7-PEOPLE-2011-IAPP) under grant agreement 286408 (www.gocarb.eu).
References
- 1. American Diabetes Association. Standards of medical care in diabetes. Diabetes Care. 2010;33(suppl 1):S11-S61. [DOI] [PMC free article] [PubMed] [Google Scholar]
- 2. Smart CE, Ross K, Edge JA, Collins CE, Colyvas K, King BR. Children and adolescents on intensive insulin therapy maintain postprandial glycaemic control without precise carbohydrate counting. Diabet Med. 2009;26(3):279-285. [DOI] [PubMed] [Google Scholar]
- 3. Smart CE, King BR, McElduff P, Collins CE. In children using intensive insulin therapy, a 20-g variation in carbohydrate amount significantly impacts on postprandial glycaemia. Diabet Med. 2012;29(7):e21-e24. [DOI] [PubMed] [Google Scholar]
- 4. Brazeau AS, Mircescu H, Desjardins K, et al. Carbohydrate counting accuracy and blood glucose variability in adults with type 1 diabetes. Diabetes Res Clin Pract. 2013;99:19-23. [DOI] [PubMed] [Google Scholar]
- 5. Bishop FK, Maahs DM, Spiegel G, et al. The carbohydrate counting in adolescents with type 1 diabetes (CCAT) study. Diabetes Spectrum. 2009;22(1):56-62. [Google Scholar]
- 6. Smart CE, Ross K, Edge JA, King BR, McElduff P, Collins CE. Can children with type 1 diabetes and their caregivers estimate the carbohydrate content of meals and snacks? Diabet Med. 2009;27:348-353. [DOI] [PubMed] [Google Scholar]
- 7. Sharp DB, Allman-Farinelli M. Feasibility and validity of mobile phones to assess dietary intake. Nutrition. 2014;30(11-12):1257-1266. [DOI] [PubMed] [Google Scholar]
- 8. Shroff G, Smailagic A, Siewiorek DP. Wearable context-aware food recognition for calorie monitoring. In: 12th IEEE International Symposium on Wearable Computers IEEE; 2008:119-120. [Google Scholar]
- 9. Chen N, Lee YY, Rabb M, Schatz B. Toward dietary assessment via mobile phone video cameras. In: AMIA Annual Symposium Proceedings AMIA; 2010:106-110. [PMC free article] [PubMed] [Google Scholar]
- 10. Chen M, Dhingra K, Wu W, Yang L, Sukthankar R, Yang J. PFID: Pittsburgh fast-food image data set. In: 16th IEEE International Conference on Image Processing IEEE; 2009:289-292. [Google Scholar]
- 11. Wu W, Yang J. Fast food recognition from videos of eating for calorie estimation. In: IEEE International Conference on Multimedia and Expo IEEE; 2009:1210-1213. [Google Scholar]
- 12. Zhu F, Bosch M, Woo I, et al. The use of mobile devices in aiding dietary assessment and evaluation. IEEE J Selected Topics Signal Processing. 2010;4(4):756-766. [DOI] [PMC free article] [PubMed] [Google Scholar]
- 13. Kong F, Tan J. DietCam: Automatic dietary assessment with mobile camera phones. Pervasive Mobile Comput. 2012;8:147-163. [Google Scholar]
- 14. Puri M, Zhu Z, Yu Q, Divakaran A, Sawhney H. Recognition and volume estimation of food intake using a mobile device. In: Workshop on Applications of Computer Vision 2009:1-8. [Google Scholar]
- 15. Pouladzadeh P, Shirmohammadi S, Arici T. Intelligent SVM based food intake measurement system. In: Computational Intelligence and Virtual Environments for Measurement Systems and Applications. IEEE; 2013:87-92. [Google Scholar]
- 16. Anthimopoulos M, Dehais J, Diem P, Mougiakakou S. Segmentation and recognition of multi-food meal images for carbohydrate counting. In: IEEE 13th International Conference on Bioinformatics and Bioengineering IEEE; 2013. [Google Scholar]
- 17. Canny J, A computational approach to edge detection. IEEE Trans Pattern Analysis Machine Intel. 1986;8:679-698. [PubMed] [Google Scholar]
- 18. Fischler M, Bolles R. Random sample consensus: a paradigm for model fitting with applications to image analysis and automated cartography. Commun ACM. 1981;24:381-395. [Google Scholar]
- 19. Comaniciu D, Meer P, Mean shift: a robust approach toward feature space analysis. IEEE Trans Pattern Analysis Machine Intelligence. 2002;24(5):603-619. [Google Scholar]
- 20. Lloyd S. Least squares quantization in PCM. IEEE Trans Info Theory. 1982;28(2):129-137. [Google Scholar]
- 21. Ojala T, Pietikainen M, Harwood D. A comparative study of texture measures with classification based on feature distributions. Pattern Recognition. 1996;29(1):51-59. [Google Scholar]
- 22. Vapnik V. The Nature of Statistical Learning Theory. New York, NY: Springer; 1995. [Google Scholar]
- 23. Dehais J, Anthimopoulos M, Shevchik M, et al. A prototype system for carbohydrate content estimation based on computer vision methods. Paper presented at: The Advanced Technologies & Treatments for Diabetes; 2014; Vienna, Austria. [Google Scholar]
- 24. Dehais J, Shevchik S, Diem P, Mougiakakou S. Food volume computation for self-dietary assessment applications. Paper presented at: IEEE 13th International Conference on Bioinformatics and Bioengineering; November 2013; Chania, Greece. [Google Scholar]
- 25. Bay H, Ess A, Tuytelaars T, van Gool L. SURF: speeded up robust features. Comput Vision Image Understanding. 2008;110(3):346-359. [Google Scholar]
- 26. Pollefeys M, Koch R, Van Gool L. A simple and efficient rectification method for general motion. In: IEEE Int. Conf. Computer Vision, Kerkira, Greece IEEE; 1999:496-501. [Google Scholar]
- 27. Dehais J, Anthimopoulos M, Shevchik S, et al. A smartphone-based carbohydrate estimation system using computer vision methods: a feasibility study. Paper presented at: 14th Annual Diabetes Technology Meeting; November 6-8, 2014; Bethesda, MD. [Google Scholar]
- 28. USDA National Nutrient Database for Standard Reference. December 7, 2011. Available at: http://ndb.nal.usda.gov/. Accessed November 17, 2014.
- 29. Mougiakakou S, Loher H, Anthimopoulos M, et al. Preclinical evaluation of a computer vision-based smartphone system for carbohydrate counting. Paper presented at: 8th International Conference on Advanced Technologies & Treatments for Diabetes; 2015; Paris, France. [Google Scholar]