Abstract
Background:
The purpose of this study was to determine if there were usability and training differences between the Medtronic MiniMed Paradigm Revel™ Insulin Pump and the Tandem Diabetes Care t:slim® Insulin Pump during use by representative users, performing representative tasks, in a simulated use environment.
Methods:
This study utilized a between-subjects experimental design with a total of 72 participants from 5 sites across the United States. Study participants were randomized to either the Revel pump group or the t:slim Pump group. Participants were 18 years of age or older and managed their diabetes using multiple daily insulin injections. Dependent variables included training time, training satisfaction, time on task, task failures, System Usability Scale (SUS) ratings, perceived task difficulty, and a pump survey that measured different aspects of the pumps and training sessions.
Results:
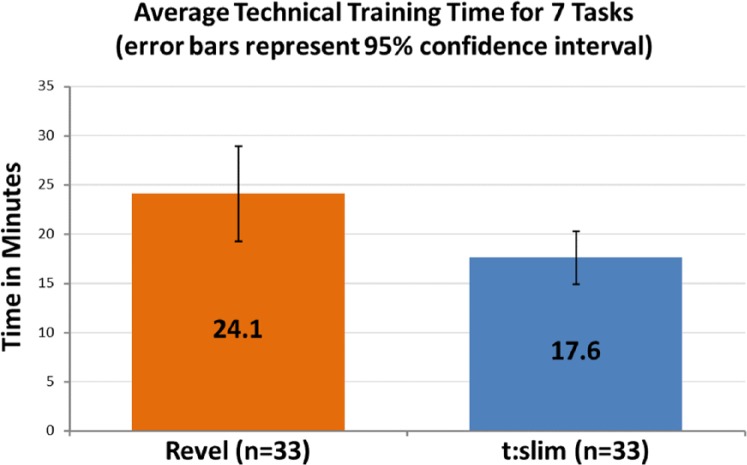
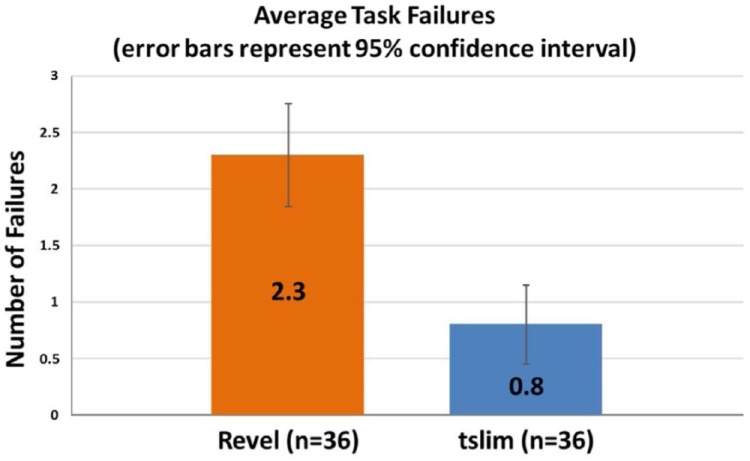
There was a statistically significant difference in training times and error rates between the t:slim and Revel groups. The training time difference represented a 27% reduction in time to train on the t:slim versus the Revel pump. There was a 65% reduction in participants’ use error rates between the t:slim and the Revel group. The t:slim Pump had statistically significant training and usability advantages over the Revel pump.
Conclusions:
The reduction in training time may have been a result of an optimized information architecture, an intuitive navigational layout, and an easy-to-read screen. The reduction in use errors with the t:slim may have been a result of dynamic error handling and active confirmation screens, which may have prevented programming errors.
Keywords: human factors, psychology, research, engineering psychology, industrial psychology, user experience research, user-centered design, insulin pump, medical device safety, use error
Truth is ever to be found in the simplicity, and not in the multiplicity and confusion of things.
—Isaac Newton
The first insulin pump developed to treat diabetes mellitus was built in 1963 by Arnold Kadish. It was so large it had to be worn as a backpack, and required the use of a screw driver to adjust flow rates. Current insulin pumps are small, computerized, medical devices that deliver rapid acting insulin to the patient subcutaneously through an infusion set to treat insulin dependent diabetes. The goal of insulin pump therapy is to more closely mimic physiologic insulin release by continuously delivering basal insulin along with programmable bolus doses for carbohydrate consumption and treating high blood glucose levels. Research has shown that insulin pump use results in better physiologic glucose control for patients along with improved quality of life such as fewer feelings that diabetes is limiting.1,2 A study published in 2010 projected that diabetes mellitus will affect 20% to 33% of all adults in the United States by 2050, and as a result, a growing number of patients will use insulin pumps to manage their condition.3
Medical Device Safety
In current insulin pumps, blood glucose levels, carbohydrate values, and occasionally basal and bolus parameters are programmed into the device by the user throughout a typical day. These daily device interactions demonstrate the need for medical device designs that are safe, effective, efficient, and free from design flaws that could lead to dangerous use-related errors. Use-related errors can lead to negative clinical outcomes which could result in severe harm, including death, and have been well documented in several publications. One of the first examinations of errors found in health care which were attributable to the ambiguity in the design of medical devices used in home care and self-care situations, was published in Human Error in Medicine.4 This work was followed 5 years later in 1999 by the seminal publication To Err Is Human: Building a Safer Health System, which elevated awareness of the errors that occur in the health care industry by highlighting the large number of preventable deaths that resulted from use related medical errors.5 Woods et al. discussed use related error as a function of the poor optimization of new technologies, which can increase the likelihood of errors occurring in a given system.6 Use errors that occur in the health care industry continue to be a dangerous problem as exemplified in the book Patient Safety, which discusses errors that occur in the health care industry that frequently lead to patient harm or death.7 Using human factors research to reduce unnecessary complexity from health care systems and medical devices is the primary way to improve usability and patient safety. There is a growing body of research that suggests removing or even reducing usability barriers from medical devices and therapeutic regimes improves patient compliance and outcomes.8-15 This occurs through device optimization accomplished by conducting human factors research.
Human Factors
Human factors is the scientific discipline focused on understanding the interactions between humans and elements of a system. The discipline applies theory, principles, data, and design methods to optimize human well-being and overall system performance.16 Medical device safety and effectiveness are improved by utilizing a human factors research process during research and development of products, to identify and eliminate design flaws. Through this process, early design iterations are effectively derisked and optimized for the intended users by systematically incorporating a high level of end user involvement early in the development process via iterative usability testing and use error analysis.
Seven medical device manufacturers have received clearance from the FDA to market their insulin pumps in the United States, and each has a different user interface. The t:slim Insulin Pump created by Tandem Diabetes Care (San Diego, CA) is the first pump with a touch screen interface. This infusion pump was developed within a user-centered design and human factors research process described in detail by Schaeffer.17 The Medtronic MiniMed Paradigm® Revel™ Insulin Pump (Minneapolis, MN) has also been cleared by the FDA and has been available on the market since 2001. The purpose of this study was to determine if there were usability and training differences between the Medtronic Revel pump and the Tandem t:slim insulin pump during use with representative users, with representative equivalent tasks, in a simulated use environment.
Research Design and Methods
Ethical approval was obtained from the RCRC Independent Review Board, which conducts ethical review in accordance with the US FDA (21CFR Parts 50 and 56), the US Department of Health and Human Services (45 CFR Part 46), the ICH Guidelines for Good Clinical Practice (E6), and the ethical principles outlined in the Belmont Report. Investigators were compensated for reasonable costs associated with conducting the study. Participants were paid at the conclusion of the study for their participation. Tandem Diabetes Care, Inc was the sponsor for this study.
Participants
For the purpose of statistical analysis, the sample size was calculated to be a minimum of 70 and a maximum of 80 participants. Sample size was determined via power analysis, where “power” refers to the probability that the test will find a statistically significant difference if such a difference actually exists. The anticipated effect size (Cohen’s d) was 0.8, with a desired statistical power level of 0.8 and a probability level of 0.05. The minimum total sample size (2-tailed hypothesis) was 26 participants for each experimental group. To ensure sample size requirements and to guard against unanticipated smaller statistical effect sizes (0.2 and 0.5), a larger sample of 36 participants per group was collected for this study.
Participant Inclusion Criteria
The following participant inclusion criteria were used: (1) The participant was older than 18 years of age. (2) The participant was currently managing his or her diabetes using multiple daily insulin injections of insulin (MDIs). (3) The participant had a basic understanding of insulin pump therapy. (4) The participant was able to speak, read, and understand English fluently. (5) The participant had correct or corrected vision (contact lenses, glasses). (6) The participant had correct or corrected hearing. (7) The participant had been informed of the nature of the study and was provided written informed consent as approved by the institutional review board of the respective clinical site. (8) The participant and the investigator had to understand participant obligations and agree that the participant was willing and able to comply with the study protocol requirements, including return visits.
Participant Exclusion Criteria
The following participant exclusion criteria were used: (1) The participant had any additional condition(s) (medical, social or psychosocial) that in the investigator’s opinion would warrant exclusion from the study or prevent the participant from completing or complying with the study requirements. (2) The participant had a potential for lack of compliance or any other issue that may preclude the participant from satisfactory participation in the study, based on the investigator’s judgment. (3) The participant currently used an insulin pump. (4) The participant was currently participating in a clinical study that may preclude the participant from meeting the obligations as outlined for this study. (5) The participant was an employee of Tandem Diabetes Care or another pump manufacturer.
Materials/Equipment
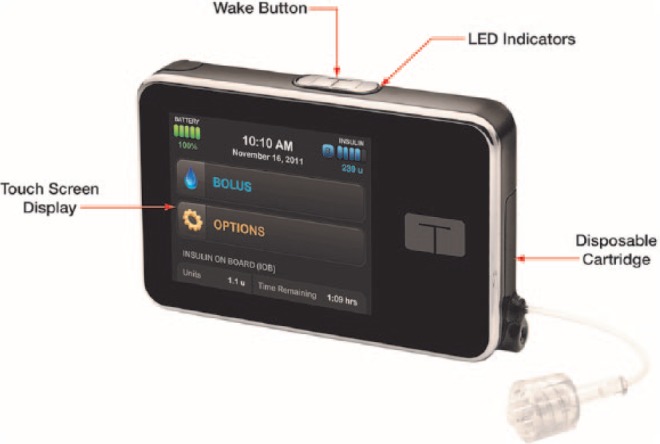
The t:slim® Insulin Pump is intended for the continuous subcutaneous infusion of insulin for the management of diabetes mellitus in persons requiring insulin. The t:slim Pump (Figure 1) is a compact (3.13 × 2.0 × 0.6 inches), personal insulin pump with a built-in, rechargeable battery. It utilizes a touch-screen interface and a dual microprocessor software control system, and includes an audible speaker and vibrator that provides alarms, alerts, and reminders to the user.
Figure 1.
t:slim pump.
The front of the t:slim Pump (Figure 1) is a color touch screen display. This display illuminates for viewing in a variety of use environments. The touch panel detects the electrical signal from a finger touch, and a glass panel over the top provides a durable, clear window screen. The glass screen is connected to the housing by a stainless steel bezel that surrounds the screen.
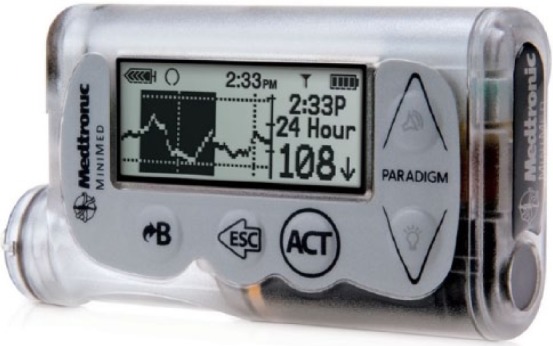
The MiniMed Paradigm Revel Insulin Pump (Figure 2) is also intended for the continuous subcutaneous infusion of insulin at set and variable rates, for the management of diabetes mellitus in persons requiring insulin. The pump is a compact, alkaline-battery-operated insulin pump. It contains a user-operated interface and black-and-white display, and includes an audible speaker and vibrator to provide alarms, alerts, and reminders to the user. There are 5 physical buttons on the front of the Revel Pump. The Revel pump is based on the Paradigm product platform available since 2001. The new Minimed 530G is also based on the same platform.
Figure 2.
MiniMed Paradigm Revel Insulin Pump.
Both pump systems were used by participants (laypersons) to complete a set of 7 equivalent, real-world task-based scenarios, in a simulated use environment, without infusing insulin into their bodies.
Procedure
Participants who were enrolled in the study adhered to a specific visitation protocol, which included 2 visits, one to a diabetes clinic for training and a second to a research facility for the usability evaluation. During their initial visit, participants were screened for inclusion/exclusion criteria and were asked to read through and sign study consent forms. Next, participants were randomized to 1 of 2 experimental groups (Revel or t:slim). Simple randomization was carried out using labeled cards (Revel or t:slim), which were blindly selected from an envelope to determine the assignment of each participant. Participants underwent up to 90 minutes of training with an independent diabetes educator on the use of their assigned pump. The training was focused primarily on the technical aspects related to using the pump to complete real-world tasks. Training did not cover aspects of diabetes management or insulin pump therapy, such as infusion site placement.
During the second visit, participants completed the usability evaluation for their respective pump. The sessions involved participants going through 7 equivalent tasks in each group:
Set date and time
Set up profile (included basal rate, correction factor, carbohydrate ratio, target blood glucose, insulin duration, and maximum bolus setup)
Deliver a food bolus
Deliver an extended bolus with correction
Start a temporary basal rate
Stop pump
Resume therapy
During each usability session, participants’ interactions with the insulin pump were observed by a researcher seated in a separate observation room to limit researcher-participant interaction. The observation room had a 1-way mirror into the participant room and every attempt was made to minimize interaction with the participants while they were moving through the tasks, so as not to inadvertently cause them to use the pump in an unrealistic way. The researcher-participant separation reduced participant bias and allowed for more realistic participant behavior. At the end of each session participants filled out questionnaires which captured their overall experiences with the pump. Each training and usability session was audio and video recorded for off-line analysis.
Design
This study utilized a between-subjects experimental design. That is, each participant was exposed to only 1 experimental condition, either the Revel pump or the t:slim Pump. The independent variable was the assigned pump group and the dependent variables included (1) training time, (2) training satisfaction, (3) time on task, (4) task failures, (5) System Usability Scale (SUS) ratings, (6) perceived task difficulty, and (7) a pump survey that measured different aspects of the pumps and training sessions.
Analysis
Independent samples t tests were completed to determine statistical significance between the metrics collected for each experimental group.
Results
Data were collected from a total of 72 participants from 5 sites across the United States. The investigator sites are shown above in Table 1. Participant demographic information is displayed in Table 2. There were 44 males and 28 females with an average age of 48 years and an age range of 19-76. Forty-five participants had type 1 diabetes, and 27 had type 2 diabetes. All participants were managing their diabetes with multiple daily insulin injections.
Table 1.
Investigator Sites.
| Site name | Investigator |
|---|---|
| AMCR Institute—Escondido, CA | Timothy S. Bailey, MD |
| John Muir Physicians Network Clinical Research Center—Concord, CA | Anna Chang, MD |
| Diabetes and Glandular Disease Clinic—San Antonio, TX | Sherwyn Schwartz, MD |
| Rocky Mountain Diabetes and Osteoporosis Center—Idaho Falls, ID | David Liljenquist, MD |
| Alan B. Schorr, DO—Langhorne, PA | Alan B. Schorr, DO |
Table 2.
Participant Demographic Information.
| Race/ethnicity | White | 57 |
| Black | 3 | |
| Hispanic/Latino | 7 | |
| Native Hawaiian/Pacific Islander | 0 | |
| American Indian or Alaska Native | 0 | |
| Asian | 1 | |
| Other | 4 | |
| Refuse to disclose | 0 | |
| Education level | High school/GED | 18 |
| 2 years of university | 26 | |
| 4 years of university | 19 | |
| Master’s | 7 | |
| Doctoral | 1 | |
| Professional | 1 | |
| Pump therapy education | Yes | 13 |
| No | 59 | |
| Touch screen experience | Yes | 61 |
| No | 11 | |
| Retinopathy | Yes | 11 |
| No | 61 | |
| Peripheral neuropathy | Yes | 18 |
| No | 54 | |
| Continuous glucose monitoring experience | Yes | 6 |
| No | 66 |
Training Time
Training time was defined as the amount of time spent training participants on the technical aspects of using the pump. The training was device-centric and did not include diabetes management training. The clock began at the beginning of the training for each task and stopped when the participant performed the task back for the educator, or the training moved onto a subsequent task. An independent-samples t test was conducted to compare average training times between the t:slim group and the Revel group. There was a statistically significant difference in times between the t:slim group (mean = 17.6, SD = 7.8) and the Revel group (mean = 24.1, SD = 14.1), t(64) = −2.30, P = .025 (2-tailed). This finding represented 27% less time to complete the training in the t:slim group (Figure 3). The magnitude of the difference in the means was moderate (mean difference = −6.49, 95% CI: −12.16 to −0.83; η2 = .06). Note that due to technical difficulties, data were not recorded for 3 participants in each group (6 total) and is reflected in Figure 3.
Figure 3.
Training time.
Training Satisfaction
Following each training session participants filled out a training satisfaction survey which captured their subjective ratings of their training experience. In each group participants were asked to answer 6 questions with a rating regarding their training satisfaction. An independent-samples t test was conducted to compare average subjective training satisfaction scores between the t:slim group and the Revel group. The results revealed that 1 of the 6 variables (“How satisfied are you with the length of the training session?”), which used a Likert-type scale of 1 = very dissatisfied to 5 = very satisfied, showed statistical significance. The difference in scores between the t:slim group (mean = 4.88, SD = 0.31) and the Revel group (mean = 4.65, SD = 0.59), t(51) = 2.04, P = .046 (2-tailed), revealed that participants reported higher satisfaction with the length of the t:slim training sessions versus the Revel sessions. The magnitude of the differences in means was moderate (mean difference = 0.23, 95% CI: 0.004 to 0.458; η2 = .06).
Participants were also asked to answer 8 questions with a rating regarding how confident they felt performing certain actions with the pump they were assigned to interact with. An independent-samples t test was conducted to compare average subjective confidence scores between the t:slim group and the Revel group. One variable, “How confident do you feel with programming a temporary basal rate?,” which used a Likert-type scale of 1 = not confident to 5 = very confident, showed statistical significance. The difference in scores between the t:slim group (mean = 4.8, SD = 0.40) and the Revel group (mean = 4.5, SD = 0.61), revealed that participants reported higher confidence scores with the t:slim pump than with the Revel, t(58) = 2.13, P = .037 (2-tailed). The magnitude of the differences in means was moderate (mean difference = 0.26, 95% CI: 0.016 to 0.508; η2 = .07).
Time on Task
Time on task was defined as the amount of time participants took to complete a task measured from the point the participant finished reading the task aloud until they believed they completed the task. A statistically significant difference was found in the time to complete the task of delivering an extended bolus with a correction; t:slim group (mean = 3.72, SD = 3.08) and the Revel group (mean = 6.49, SD = 6.98), t(48) = −2.17, P = .034 (2-tailed). The magnitude of the differences in the means was moderate (mean difference = −2.7, 95% CI: −5.3 to −0.21; η2 = .06). A statistically significant difference was also found in the time to complete the task of resuming therapy between the t:slim group (mean = 0.21, SD = 0.09) and the Revel group (mean = 0.11, SD = 0.06), t(70) = 5.4, P = .000 (2-tailed). The magnitude of the differences in the means was large (mean difference = 0.10, 95% CI: 0.06 to 0.13; η2 = .13).
Task Failures
This metric was defined as a task in which the participant gave up before completing, or if they completed it incorrectly. An independent-samples t test was conducted to compare average failure rates between each group. There was a statistically significant difference in failure rates between the t:slim group (mean = 0.8, SD = 1.06) and the Revel group (mean = 2.3, SD = 1.4), t(70) = −5, P = .000 (2-tailed). This finding represented 65% fewer use-related errors in the t:slim group (Figure 4). The magnitude of the differences in the means was a large effect (mean difference = −1.47, 95% CI: −2.05 to −0.88; η2 = .12).
Figure 4.
Task failures.
Error Categories
Table 3 shows the largest error category in the Revel group were programming errors (30) where participants were asked to enter specific pieces of information (eg, basal rates, blood glucose levels, grams of carbohydrates, etc) and they were entered into the system incorrectly. Table 4 shows the top error catagories in the t:slim group, which also included programming errors (4), and incorrect navigation (3).
Table 3.
Failure Categories: Revel Group.
| Top use error categories | |
|---|---|
| Programming errors | 30 |
| Incorrect workflow (navigation) | 9 |
Table 4.
Failure Categories: t:slim Group.
| Top use error categories | |
|---|---|
| Programming errors | 4 |
| Incorrect workflow (navigation) | 3 |
Perceived Task Difficulty
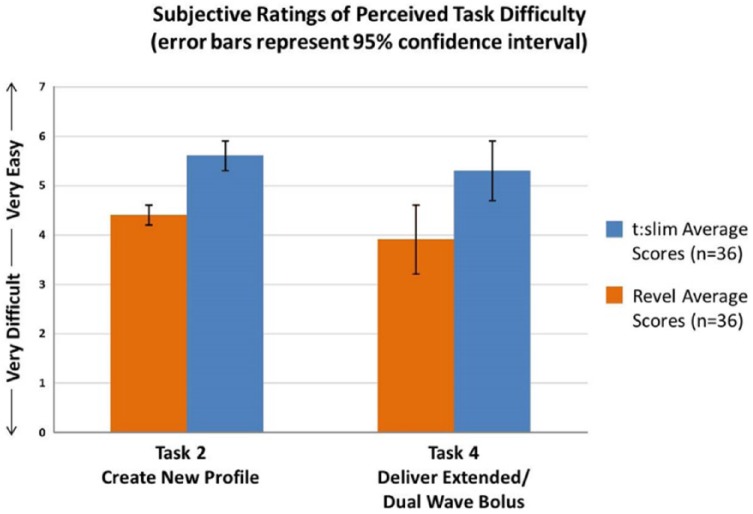
After each of the 7 tasks, participants were asked to rate how easy or difficult the task was to complete using a Likert-type scale of 1 = very difficult to 7 = very easy (Figure 5). An independent-samples t test was conducted to compare subjective task difficulty ratings between the t:slim and Revel groups. There was a statistically significant difference between group ratings for 2 of the 7 tasks. The task to create a new profile/setup pump revealed statistically significant differences between the t:slim group (mean = 5.4, SD = 1.7) and the Revel group (mean = 4.3, SD = 1.8), t(70) = 2.6, P = .009 (2-tailed). The magnitude of the differences in the means was moderate (mean difference = 1.13, 95% CI: 0.28 to 1.98; η2 = .07).
Figure 5.
Task difficulty.
There was also a statistically significant difference for the task to deliver an extended bolus/dual wave bolus between the t:slim group (mean = 5.2, SD = 1.6) and the Revel group (mean = 4.0, SD = 2.1), t(65) = 2.6, P = .009 (2-tailed). The magnitude of the differences in the means was moderate (mean difference = 1.19, 95% CI: 0.30 to 2.08; η2 = .07).
System Usability Scale (SUS)
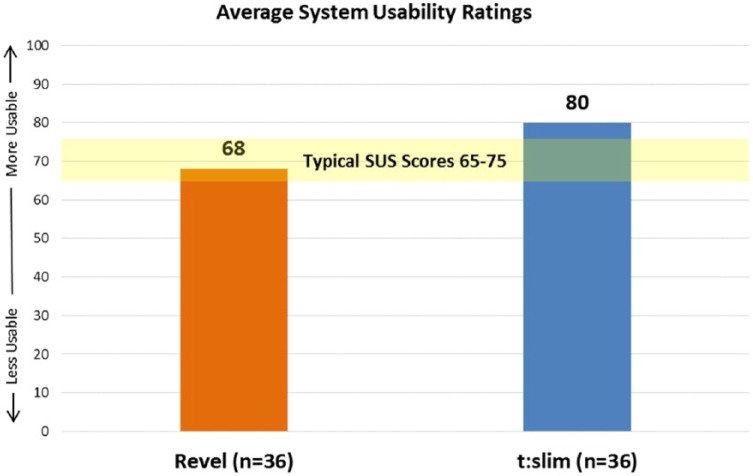
SUS is a 10-item questionnaire that yields a composite score representing participant’s perceptions of the global usability of the pump.18 The score is based on a 0 to 100 scale in which a higher number represents a more usable system (Figure 6). This data were collected at the end of the usability session. Participants’ average system usability ratings were lower in the Revel group (68) versus the t:slim group (80).
Figure 6.
SUS scores.
Pump Questionnaire
Following the conclusion of the usability session, participants were asked to fill out a 10-item questionnaire regarding different aspects of the pump with which they interacted. The results displayed in Table 5 indicate that there were statistically significant differences between the t:slim group and the Revel group across a total of 7 variables. The magnitude in the difference in the means for each variable ranged from moderate (0.06) to large effect sizes (0.14) with the largest effect sizes occurring for the variables “the screen makes good use of contrast” and “the pump is enjoyable to use”.
Table 5.
Pump Questionnaire.
| Revel pump group |
t:slim Pump group |
||||||
|---|---|---|---|---|---|---|---|
| Variable | Mean | SD | Mean | SD | t | P (2-tailed) | η2 |
| The terminology is easy to understand | 5.31 | 1.75 | 6.14 | 1.15 | 2.384 | .020 | .07 |
| The screen makes good use of contrast | 5.00 | 1.98 | 6.44 | 0.80 | 4.042 | .000 | .14 |
| The pump is a good size, I could hold and work with it easily | 5.69 | 1.41 | 6.50 | 0.74 | 3.037 | .004 | .10 |
| It was difficult to read the words on the screen | 2.19 | 1.48 | 1.53 | 0.91 | −2.292 | .026 | .07 |
| The pump is enjoyable to use | 4.47 | 1.79 | 6.19 | 1.16 | 4.824 | .000 | .13 |
| The training I received was sufficient for completing these tasks | 5.39 | 1.55 | 6.17 | 1.32 | 2.288 | .025 | .06 |
| I found it easy to program this pump | 4.94 | 1.70 | 6.25 | 1.36 | 3.590 | .001 | .09 |
Discussion
The t:slim® Pump, which was optimized for intended users during its development through the use of human factors research, had significant training and usability advantages over the Revel pump when used by representative laypersons in a representative use environment.
Overall, the t:slim Pump took approximately 27% less time to train on the technical aspects of the pump versus the Revel pump. This finding has significant implications in terms of reducing the burden placed on patients who are expected to learn how to operate a complex life-sustaining medical device. The reduced training time required for the t:slim also impacts health care providers because less time to train translates to potentially less costly follow-up retraining sessions. According to the American Association of Diabetes Educators, there is a shortage of diabetes educators and diabetes programs to adequately support the rapidly increasing need for diabetes education.19 Yet, the evidence demonstrates that diabetes education saves money and decreases health care utilization.20 Any reduction in time spent in training while maintaining a high level of comprehension is desirable. The results strongly suggest that both training and learning were facilitated by the intuitive, highly usable, safe, and optimized system found in the t:slim Insulin Pump.
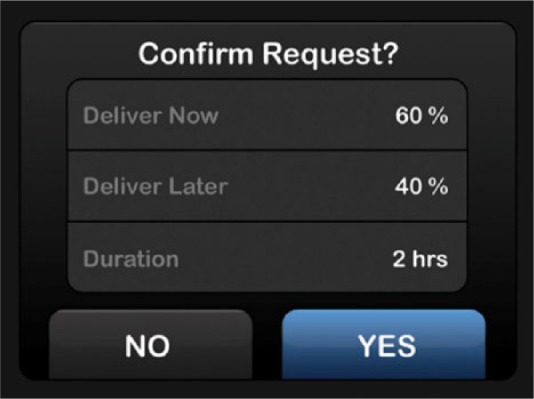
The most notable discovery was that the t:slim pump had 65% fewer use-related errors than the Revel pump when used by representative users given equivalent real-world tasks. Use-related errors are directly linked to device safety. That is, use-related errors may lead to negative clinical outcomes such as over-delivery of insulin, under-delivery of insulin, or delay of therapy, which may endanger patients’ health by leading to hyperglycemic or hypoglycemic events. Active confirmation screens, shown in Figure 7, may have been a contributing factor for reduced programming errors in the t:slim group.
Figure 7.
Confirmation screen.
The confirmation screens incorporated into the architecture of the graphical user interface likely impacted participants’ behavior and facilitated quick recovery from potential programming errors more effectively than the Revel interface due to several related factors. First, the formats of the confirmation screens are slightly different from other screens that participants encounter within the interface. The top of the confirmation screens start with a question “Confirm Request?,” which requires an action. The uniqueness of these screens may result in it being more noticeable to participants, causing them to pause and review the information. Second, the layout of the confirmation screens provides an easy-to-read summary of all of the critical pieces of information in one location. This, along with the high contrast values (white text on a black background) provided participants with a way to quickly and effectively review the information they input into the system. Third, and most importantly, the confirmation screens may have forced participants to take a more active role in reviewing their information. After doing so, the participants were able to actively confirm by tapping “yes” to move to the next step or “no” to go back and make a change to the information they entered. This active involvement may have caused participants to take more time, and ultimately more responsibility for the information they put into the system. Finally, some participants with less technology experience may have viewed the active confirmation screens as a check for them to verify that the system properly interpreted their inputs.
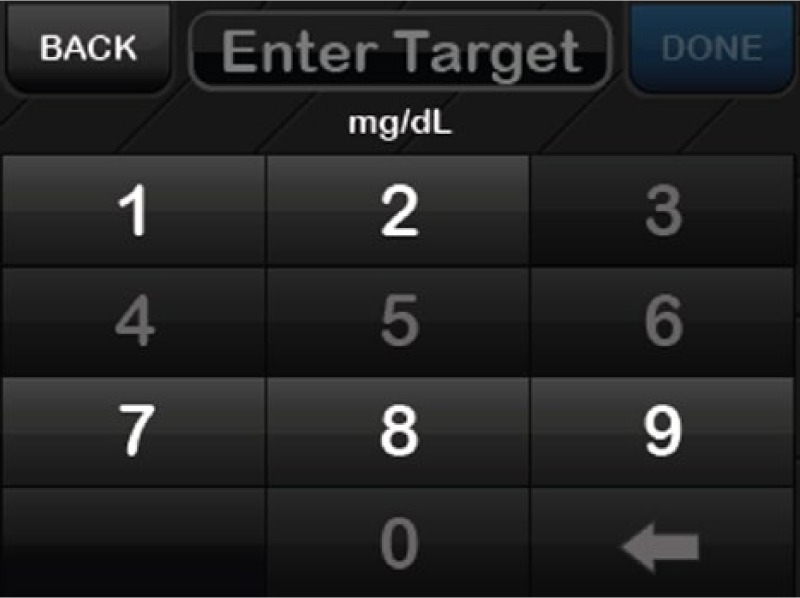
The confirmation screens used in the t:slim Pump represent one method of error handling. Another technique for error handling was designed into the t:slim’s keypad and may have prevented users from entering inappropriate values during the study (Figure 8). Dynamic error handling uses a design interaction that adapts based on user input. For example, when the user is entering information into the system on the keypad, certain keys become inactive to prevent them from entering parameters (bolus, basal, carb ratio, etc) that are outside safe ranges. This simple and effective optimization adds an additional level of safety to the device that makes it much more difficult to program incorrectly. This unique software design feature may have also prevented programming errors during the study.
Figure 8.
Error handling.
Conclusions
Device interactions that lead to negative clinical outcomes, similar to those described, may result in increased visits to the hospital. According to national statistics collected in 2011 (the most recent year available) there were a total of 2289 hospital visits for complications with an insulin pump that resulted in an aggregate cost of over $11 million.21 In addition to the danger that design flaws in medical devices create for patients, hospital visits represent a significant amount of time, money, and strain which may be ameliorated with proper human factors design and research methodologies occurring prior to product commercialization so that the system or product is optimized for the intended use.
In summary, the objective metrics collected in this study including the reduced error rates and reduced training time provides significant evidence that the t:slim pump was more optimized for representative participants than was the Revel pump. In addition, the subjective metrics including the SUS scores along with the end of test questionnaire provides additional evidence that the t:slim pump offered enhanced usability for representative participants versus the Revel pump. The t:slim® Pump demonstrates that significant optimization can be accomplished through human factors research, which is used to derisk medical devices for the intended user, in turn reducing or eliminating use related errors, that could lead to negative clinical outcomes.
Acknowledgments
The authors would like to thank the study participants and investigational sites, including Laura Bedolla, CCRC, Anna Chang, MD, Carolyn Paulson, RN, CDE, Sophia Stalters, RN, CDE, Sherwyn Schwartz, MD, Stacie Haller-Wich, RD, LD, CDE, Phillip Wayne Kostroun, RD, LD, CDE, David Liljenquist, MD, and Lesley Kelner, RD, RDN, LDN, CDE. This article would not have been possible without the exceptional leadership of Robert Anacone. The authors would also like to thank Sedine San Augustine and Adam Noar for their contributions to this effort.
Footnotes
Declaration of Conflicting Interests: The author(s) declared the following potential conflicts of interest with respect to the research, authorship, and/or publication of this article: NES, LJP, and ETV are full-time employees of Tandem Diabetes Care, Inc. TSB and TD are employees of AMCR Institute. JH and BS are full-time employees of Rocky Mountain Diabetes and Osteoporosis Center.
Funding: The author(s) disclosed receipt of the following financial support for the research, authorship, and/or publication of this article: This work was funded by Tandem Diabetes Care, Inc.
References
- 1. Goldstein D, Little R, Lorenz R, Malone J, Nathan D, Peterson C. American Diabetes Association: tests of glycemia in diabetes. Diabetes Care. 2003;26(1):S106-S108. [DOI] [PubMed] [Google Scholar]
- 2. Schaeffer NE. Human factors research applied: the development of a personal touch screen insulin pump and users’ perceptions of actual use. Diabetes Technol Ther. 2013;15(10):845-854. [DOI] [PubMed] [Google Scholar]
- 3. Boyle J, Thompson T, Gregg E, Barker L, Williamson D. Projection of the year 2050 burden of diabetes in the US adult population: dynamic modeling of incidence, mortality, and prediabetes prevalence. Popul Health Metr. 2010;8:29. [DOI] [PMC free article] [PubMed] [Google Scholar]
- 4. Bogner M, ed. Human Error in Medicine. Hillsdale, NJ: Lawrence Erlbaum; 1994. [Google Scholar]
- 5. Kohn L, Corrigan J, Donaldson M, eds. To Err Is Human: Building a Safer Health System. Washington, DC: National Academies Press; 1999. [PubMed] [Google Scholar]
- 6. Woods DD, Dekker S, Cook R, et al. Behind Human Error. Burlington, VT: Ashgate; 2010. [Google Scholar]
- 7. Vincent C. Patient Safety. 2nd ed. Chichester, UK: John Wiley; 2010. [Google Scholar]
- 8. Donnan PT, MacDonald TM, Morris AD. Adherence to prescribed oral hypoglycemic medication in a population of patients with Type 2 diabetes: a retrospective cohort study. Diabet Med. 2002;19(4):279-284. [DOI] [PubMed] [Google Scholar]
- 9. Lin L, Vincente KJ, Doyle DJ. Patient safety, potential adverse drug events, and medical device design: a human factors engineering approach. IEEE J Biomed Health Inform. 2002;34:274-284. [DOI] [PubMed] [Google Scholar]
- 10. Zhang J, Johnson TR, Patel VL, Paige DL, Kubose T. Using usability heuristics to evaluate patient safety and medical devices. J Biomed Inform. 2003;36:23-30. [DOI] [PubMed] [Google Scholar]
- 11. Rogers WA, Mykityshyn AL, Campbell RH, Fisk AD. Analysis of a “simple” medical device. Ergonomics Design. 2001;6-14. [Google Scholar]
- 12. Crompton GK. How to achieve good compliance with inhaled asthma therapy. Respir Med. 2004;98:35-40. [DOI] [PubMed] [Google Scholar]
- 13. Chapman KR, Walker L, Cluley S, Fabbri L. Improving patient compliance with asthma therapy. Respir Med. 2000;94:2-9. [DOI] [PubMed] [Google Scholar]
- 14. Reinke T. Though costly, insulin pens facilitate better adherence. Manag Care. 2013;22(6):20-21. [PubMed] [Google Scholar]
- 15. Berwick DM, Leape LL. Reducing errors in medicine. Qual Health Care. 1999;319:136-137. [DOI] [PMC free article] [PubMed] [Google Scholar]
- 16. International Ergonomics Association. Definition of human factors. Available at: http://www.iea.cc/whats/index.html. Accessed April 2, 2014.
- 17. Schaeffer NE. The role of human factors in the design and development of an insulin pump. J Diabetes Sci Technol. 2012;6:260-264. [DOI] [PMC free article] [PubMed] [Google Scholar]
- 18. Brooke J. SUS: a “quick and dirty” usability scale. In: Jordan PW, Thomas B, Weerdmeester BA, McClelland AL, eds. Usability Evaluation in Industry. London, UK: Taylor and Francis; 1996:189-194. [Google Scholar]
- 19. American Association of Diabetes Educators. Diabetes education fact sheet. 2010. Available at: http://www.diabeteseducator.org/export/sites/aade/_resources/pdf/Diabetes_Education_Fact_Sheet_2009.pdf. Accessed April 14, 2014.
- 20. Robins JM, Webb DA, Thatcher GE, Valdmanis VG. Nutritionist visits, diabetes classes, and hospitalization rates and charges. Diabetes Care. 2008;31(4):655-660. [DOI] [PMC free article] [PubMed] [Google Scholar]
- 21. US Department of Health and Human Services. National statistics. 2011. Available at: http://hcupnet.ahrq.gov/. Acces-sed April 2, 2014.


