Abstract
Background:
We assessed users’ proficiency and efficiency in identifying and interpreting self-monitored blood glucose (SMBG), insulin, and carbohydrate intake data using data management software reports compared with standard logbooks.
Method:
This prospective, self-controlled, randomized study enrolled insulin-treated patients with diabetes (PWDs) (continuous subcutaneous insulin infusion [CSII] and multiple daily insulin injection [MDI] therapy), patient caregivers [CGVs]) and health care providers (HCPs) who were naïve to diabetes data management computer software. Six paired clinical cases (3 CSII, 3 MDI) and associated multiple-choice questions/answers were reviewed by diabetes specialists and presented to participants via a web portal in both software report (SR) and traditional logbook (TL) formats. Participant response time and accuracy were documented and assessed. Participants completed a preference questionnaire at study completion.
Results:
All participants (54 PWDs, 24 CGVs, 33 HCPs) completed the cases. Participants achieved greater accuracy (assessed by percentage of accurate answers) using the SR versus TL formats: PWDs, 80.3 (13.2)% versus 63.7 (15.0)%, P < .0001; CGVs, 84.6 (8.9)% versus 63.6 (14.4)%, P < .0001; HCPs, 89.5 (8.0)% versus 66.4 (12.3)%, P < .0001. Participants spent less time (minutes) with each case using the SR versus TL formats: PWDs, 8.6 (4.3) versus 19.9 (12.2), P < .0001; CGVs, 7.0 (3.5) versus 15.5 (11.8), P = .0005; HCPs, 6.7 (2.9) versus 16.0 (12.0), P < .0001. The majority of participants preferred using the software reports versus logbook data.
Conclusions:
Use of the Accu-Chek Connect Online software reports enabled PWDs, CGVs, and HCPs, naïve to diabetes data management software, to identify and utilize key diabetes information with significantly greater accuracy and efficiency compared with traditional logbook information. Use of SRs was preferred over logbooks.
Keywords: diabetes software, insulin, self-management, self-monitoring of blood glucose, SMBG
Effective use of self-monitoring of blood glucose (SMBG) requires that testing regimens are structured to identify meaningful patterns of glycemic control, data are presented in formats that facilitate identification of glycemic patterns and that users (health care providers and patients) accurately interpret and utilize the data to make appropriate decisions regarding therapy.1 Written logbooks are commonly used to record SMBG results and relevant information; however, utilizing logbooks is often problematic for patients and their health care providers due to the high incidence of recording errors and/or information gaps and the complexity and volume of information presented.2 Only about 50% of adult SMBG logbooks can be considered accurate and reliable,3 and many patients frequently neglect to bring their logbooks to their clinic appointments,4 which speaks to the necessity to eliminate any potential burden for the patient and simplify data collection and transmission. However, even when logbooks data are meticulously maintained, patients may become overwhelmed or confused and unable to interpret and/or act upon their data.
During the past 10 years, several diabetes data management software programs have become available, utilizing downloaded data from blood glucose meters, insulin pumps and continuous glucose monitoring (CGM) systems to present information in a variety of statistical and graphical formats.
We hypothesized that the software report (SR) formats would enhance the ability of users who are inexperienced in the use of downloaded diabetes management data to accurately and efficiently identify glucose patterns and other key information (eg, glucose statistics, insulin administration/dosages, carbohydrate intake).
To test this hypothesis, we conducted a study, Accu-Chek Connect Reports Utility and Efficiency Study (ACCRUES), to assess the impact of utilizing online data management reports on users’ ability to accurately and efficiently interpret data and make appropriate treatment decisions. The evaluation included patients with diabetes (PWDs) treated with multiple daily insulin injections (MDI) and continuous subcutaneous insulin infusion (CSII), CGVs of pediatric MDI-treated and CSII-treated patients and health care providers (HCPs) who were naïve to diabetes data management software use.
Methods
This prospective, comparative, online survey enrolled PWDs treated with MDI and CSII therapy, CGVs of pediatric MDI-treated and CSII-treated patients and HCPs who were not specialized in diabetes management. Participants were asked to review a series of clinical cases (based on actual patient data) and answer multiple-choice questions associated with each case. The cases were presented in both online SR and traditional logbook (TL) formats. The purpose of the study was to assess participants’ accuracy in answering each multiple-choice question and the time required for their responses. Participants served as their own control.
Subjects
PWDs, CGVs, and HCPs from medical practices across the United States were recruited for the study. Medical specialties included family practitioner, internal medicine, and nurse practitioner.
Participants were identified through the existing physician database and recruited by contacting random samples of primary health care physicians and nurse practitioners (via email and/or fax), inviting them to call or email a market research firm (Qessential Medical Market Research, LLC [QMMR], Exeter, NH) to screen for the study. Email and fax invitations were sent to known diabetes specialists, requesting that they refer patients to call or email QMMR to screen for the study. The invitations included a patient/caregiver flyer, which the specialists could post in their offices.
PWD Eligibility
PWD eligibility criteria for the study included diagnosed type 1 or type 2 diabetes; treated with MDI or CSII therapy for ≥6 months; ≥18 years of age; makes majority (>80%) of daily diabetes management decisions; performs SMBG ≥3 times daily; has experience with keeping a standard logbook; adjusts prandial bolus insulin dosages; has access to a calculator; and possesses a computer with the capability to connect to the Internet. Patients were excluded from the study if they were a health care professional, routinely used continuous glucose monitoring (CGM), routinely used diabetes management software, or routinely downloaded their blood glucose meter or insulin pump data at home.
Caregiver (CGV) Eligibility
CGV eligibility criteria for the study included patient has diagnosed type 1 or type 2 diabetes; patient has been treated with MDI or CSII therapy for ≥6 months; CGV makes majority (>80%) of patient’s daily diabetes management decisions; measures patient’s blood glucose ≥3 times daily; keeps or helps patient review a standard logbook; adjusts prandial bolus insulin dosages for the patient; has access to a calculator; and possesses a computer with the capability to connect to the Internet. Patient caregivers were excluded from the study if they were a health care professional, had diabetes and treated with MDI or CSII therapy, the patient they care for routinely used continuous glucose monitoring (CGM), routinely used diabetes management software, or routinely downloaded their patients’ blood glucose meter or insulin pump data at home.
HCP Eligibility
Eligibility for the study required that HCPs are board certified in their specialty (internal medicine, family practice, or nurse practitioner), are actively in nonacademic patient care, have a diabetes population of ≥10%, manage diabetes patients with MDI or CSII, routinely examine blood glucose logbooks in their practice, recommend blood glucose monitoring to their patients, and possesses a computer with the capability to connect to the Internet. HCPs were excluded from the study if they were recognized as diabetes specialists (eg, advanced training or certification in diabetes management), routinely used continuous glucose monitoring (CGM) in their practice, routinely used diabetes management software or downloaded blood glucose meter or insulin pump data in their practice, or had diabetes and treated with multiple daily insulin injection (MDI) or continuous subcutaneous insulin infusion (CSII) therapy.
Study Materials
Accu-Chek CONNECT Diabetes Management System
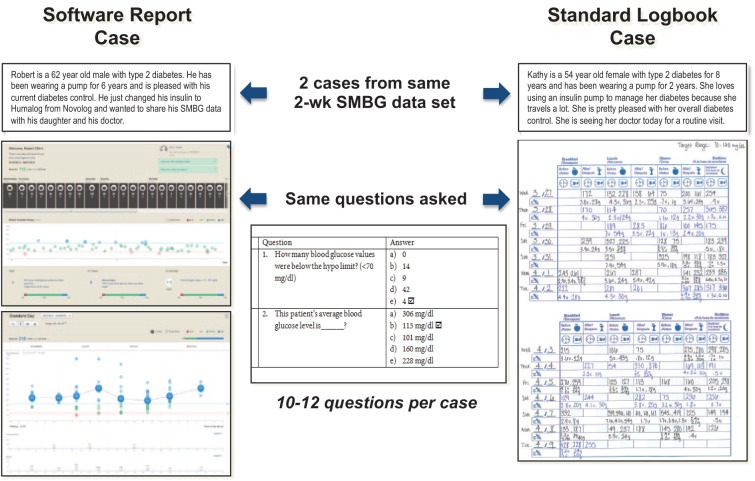
The Accu-Chek CONNECT Diabetes Management System (Roche Diagnostics, Indianapolis, Indiana, USA) is an investigational online tool that enables users of Accu-Chek blood glucose meters and insulin pumps (Roche Diagnostics) to automatically download, visualize, and organize blood glucose, insulin delivery, carbohydrate intake, and other health-related data. For our assessments, screen shots of the various reports generated by the system were presented to participants via a web portal accessed from their computers (Figure 1).
Figure 1.
Presentation of paired cases.
Traditional Logbook Presentation
The comparator device was an electronic image of a completed Accu-Chek Logbook (Roche Diagnostics) (Figure 1).
Case Study Development
The primary investigator of the study developed 6 “master” cases with associated multiple-choice questions and responses. The cases were based on 2 weeks of SMBG data and other relevant diabetes management information from real patients with diabetes (3 MDI-treated, 3 CSII-treated). The cases were representative of various glycemic patterns and provided a broad example of clinical circumstances common to the management of type 1 and 2 diabetic patients on MDI and CSII therapy. Glycemic patterns included normal glycemia, hypoglycemia, preprandial hyperglycemia, postprandial hyperglycemia, and bedtime hyperglycemia.
From each master case, 2 “paired” cases” were developed (based on the same data) and formatted as an online SR case and corresponding TL case. Each case included a brief patient history, SMBG data, insulin dosage and administration, and CHO intake data (Figure 1).
The SRs were presented as screen shots of selected reports from the Accu-Chek Connect Diabetes Management System (6 reports for each report case); the same data were presented in the paired TL case as a screenshot of the logbook (Figure 1). The multiple-choice questions, which were identical for each paired case, were organized into 3 categories: identification of meaningful diabetes information, identification of glycemic patterns, and appropriate diabetes management decisions.
The cases, multiple-choice questions, and responses were submitted to an expert panel, consisting of 2 physicians specialized in diabetes management and a certified diabetes educator for review. The cases, questions, and responses were revised as needed, based on consensus agreement from the expert panel.
Outcome Measures
The primary outcome measures for the study were participants’ accuracy in answering the multiple choice questions for each case and the time required to provide their response. Accuracy and response time are presented as an aggregate of total questions for each case and by question category (eg, meaningful diabetes information, glycemic patterns, therapy decisions). A secondary measurement included a preference questionnaire which participants completed following case analyses. The investigator-developed questionnaire was designed to obtain participants’ feedback on their experience with the online reports versus standard logbook and perceived value of the online reports.
Procedures
Potential participants completed a screening questionnaire to determine eligibility for the study. Requirements for web portal compatibility were assessed as part of screening. Eligible participants then received credentials to access the study web portal. The web portal was designed and tested for Internet Explorer 8 or newer, latest version of Firefox and Google Chrome on Windows 7 or newer operating systems, and Safari 5 or newer on Mac OS 10.6 or newer.
At the web portal, participants were asked to complete a demographic questionnaire, receive online orientation for both types of reports (online and logbook), perform an assessment of online and logbook cases, and complete a preference questionnaire. Four of the 6 cases (2 MDI-treated, 2 CSII-treated) were selected and presented to HCPs. PWDs and CGVs received 3 paired cases relevant to their treatment group. Cases were presented in a manner that ensured paired cases would not be presented sequentially.
When each case was presented, the computer screen displayed 1 question at a time. The time needed for answering a question during the case studies was measured and documented. Participants were prevented from moving on to the next question until the current question had been answered. Participants were unable to return to previous questions to edit their answer. The HCP/patient/caregiver information sheets that participants reviewed did not disclose that the difference between methods in speed (time to review each case) would be calculated. The information sheets did disclose that breaks between cases would be allowed.
Participants were required to complete the demographic questionnaire and cases and preference questionnaire within 7 days of receiving their login credentials.
Statistical Analysis
The primary analysis objective is to compare the accuracy and speed of obtaining meaningful diabetes information, identifying important glycemic patterns, and making appropriate therapy decisions utilizing data from SR and TL case presentations. Questions were categorized as correct or incorrect based on the expert panel agreement. Accuracy per participant was calculated as the percentage of questions over all cases with a correct response. Speed was calculated as the sum of the time spent answering the questions. The time spent answering the question was determined by the web-based application as the number of seconds from the time when the participant first enters the page to the time when the participant clicks “go to next page.”
For each participant, differences in accuracy and speed were calculated as the SR value minus the TL value. Descriptive statistics (mean, standard deviation, median, minimum, and maximum) are presented for the difference between methods in accuracy and speed for the questions. The statistical significance of the difference in methods was tested using paired t tests. The participant needed to answer the same question within each case pair for that question to be included in calculations of accuracy and speed for that participant. All analyses include the evaluable population of participants, defined as those participants who completed at least 1 evaluable case (>50% of the questions for each paired case are answered).
Information from the demographic questionnaires is summarized for the study group. Continuous variables are summarized by descriptive statistics (mean, standard deviation, median, minimum, and maximum). Categorical variables are summarized by the number and percentage of participants within each category.
The preference questionnaires are summarized for the study group. Numbers and percentages of participants within each numerical level of the Likert-type scale are presented for each question. Two-sided P values are reported; P values less than or equal to .05 are considered statistically significant. There was no imputation for missing data. The analyses were performed using SAS version 9.2 or higher.
Results
A total of 54 PWDs (n = 27 MDI-treated, n = 27 CSII-treated), 24 CCVs (n = 13 MDI, n = 11 CSII), and 33 HCPs (n = 18 family practitioner; n = 12 internal medicine; n = 3 nurse practitioner) were enrolled in the study. All participants were included in the evaluable population analyses. Demographic characteristics of the participants are presented in Table 1 (PWDs/CGVs) and Table 2 (HCPs). Differences in age, type of diabetes, use of CHO counting, and SMBG frequency were seen between the PWD study groups; no between-group differences were seen among the CGV study groups.
Table 1.
Demographic Characteristics of Study Patient/Caregiver Participants.
| Characteristic | MDI PWD (n = 27) | CSII PWD (n = 27) | P value | MDI CGV (n = 13) | CSII CGV (n = 11) | P value |
|---|---|---|---|---|---|---|
| Age, years (SD) | 51.7 (11.9) | 41.0 (16.5) | .009 | 45.9 (6.2) | 46.0 (7.2) | .96 |
| Gender, female n (%) | 19 (70.4)) | 20 (74.1) | .76 | 10 (76.9) | 10 (90.9) | .36 |
| Type 1 diabetes, n (%) | 19 (70.4) | 25 (92.6) | .36 | 13 (100.0)a (PWD) | 11 (100.0)a (PWD) | .92 |
| Diabetes duration, years (SD) | 26.8 (10.6) | 21.1 (14.1) | .10 | 4.77 (4.4) | 6.1 (4.44) | .47 |
| Last HbA1c, % (SD) | 7.67 (1.7) | 7.46 (1.0) | .57 | 8.03 (1.0) | 8.01 (1.0) | .96 |
| Uses CHO counting to adjust meal insulin dose, n (%) | 21 (77.8) | 27 (100.0) | .009 | 13 (100.0) | 11 (100.0) | — |
| SMBG frequency per day, n (SD) | 3.74 (0.7) | 4.22 (0.6) | .009 | 4.3 (0.6) | 4.4 (0.5) | .52 |
Relevant to caregiver patient.
Table 2.
Demographic Characteristics of HCPs.
| Characteristic | All HCPs (n = 33) |
|---|---|
| Age, years (SD) | 51.3 (8.7) |
| Gender, n(%) | |
| Male | 21 (63.6) |
| Female | 12 (36.4) |
| Time since graduated from medical school/APRN training, years (SD) | 24.1 (8.9) |
| Type of practice, n (%) | |
| Solo | 8 (24.2) |
| Private/multiphysician | 15 (45.5) |
| Hospital owned | 10 (30.3) |
| Other | 1 (3.0) |
| Percentage of patients with type 1 diabetes | |
| <5% | 25 (75.8) |
| 5-10% | 5 (15.2) |
| 10-15% | 3 (9.1) |
| Percentage of patients with type 2 diabetes | |
| <10% | 1/ (3.0) |
| 10-20% | 11 (33.3) |
| 20-30% | 11 (33.3) |
| 30-40% | 5 (15.2) |
| 40-50% | 1 (3.0) |
| >50% | 4 (12.1) |
| Percentage of patients on MDI therapy | |
| <10% | 12 (36) |
| 10-25% | 14 (42.4) |
| 25-50% | 6 (18.2) |
| 50-75% | 1 (3.0) |
| Percentage of patients on CSII therapy | |
| <10% | 32 (97) |
| 10-25% | 1 (3.0) |
| Average HbA1c of diabetes patients, n (%) | |
| <7% | 5 (15.2) |
| 7-8% | 23 (69.7) |
| >8% | 1 (3.0) |
| Do not know | 4 (12.1) |
| Communicate with diabetes patients outside of office visits, n (%) | |
| No | 5 (15.2) |
| Yes | 28 (84.8) |
| Receive compensation for these interactions, n (%) | |
| No | 25 (89.3) |
| Yes | 3 (10.7) |
| Review SMBG data | |
| No | 0 (0.0) |
| Yes | 33 (100.0) |
| Routinely seek additional training/knowledge in diabetes, n (%) | |
| No | 4 (12.1) |
| Yes | 29 (87.9) |
| Ever unable to prescribe appropriate therapy due to lack of insurance coverage or inability to prior authorize, n (%) | |
| No | 2 (6.1) |
| Yes | 31 (93.9) |
| Occurrence of inability to prescribe appropriate therapy, n (%) | |
| <10% | 9 (29) |
| 10-25% | 17 (54.8) |
| 25-50% | 3 (9.7) |
PWD Performance
Accuracy
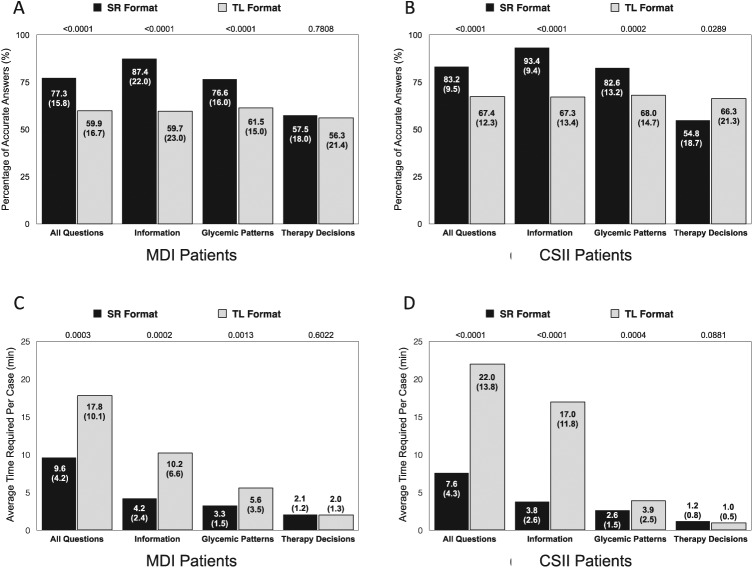
PWDs showed greater overall accuracy, assessed by mean (SD) percentage of accurate responses, using SR presentations compared with TL data (80.3 [13.2]% vs 63.7 [15.0]%, P < .0001) with no difference in improvement between the patient groups (P = .6522). In both groups, accuracy of SR compared with TL use was greater when answering questions related to diabetes information and glycemic patterns but not therapy decisions (Figures 2A and 2B). MDI-treated PWDs showed no change in accuracy related to therapy decision questions using the SR presentations versus TL data, whereas CSI-treated PWDs showed less accuracy using the SR presentations.
Figure 2.
PWD accuracy (A/B) and efficiency (C/D) of using software report (SR) formats compared with traditional logbook (TL) data: MDI-treated PWDs and CSII-treated PWDs.
Time Required
PWDs spent less time (average minutes per case) reviewing data and answering questions using SR presentations compared with TL data (8.6 [4.3] vs 19.9 [12.2] minutes, P < .0001) (Figures 2C and 2D). The mean (SD) reduction in time for all cases was greater using the SR presentations among CSII-treated PWDs compared with MDI-treated PDWs (−43.2 [37.5] minutes vs −24.6 [30.2] minutes) but this difference did not reach statistical significance (P = .0509). In both groups, less time was spent when answering questions related to diabetes information and glycemic patterns but not therapy decisions.
CGV Performance
Accuracy
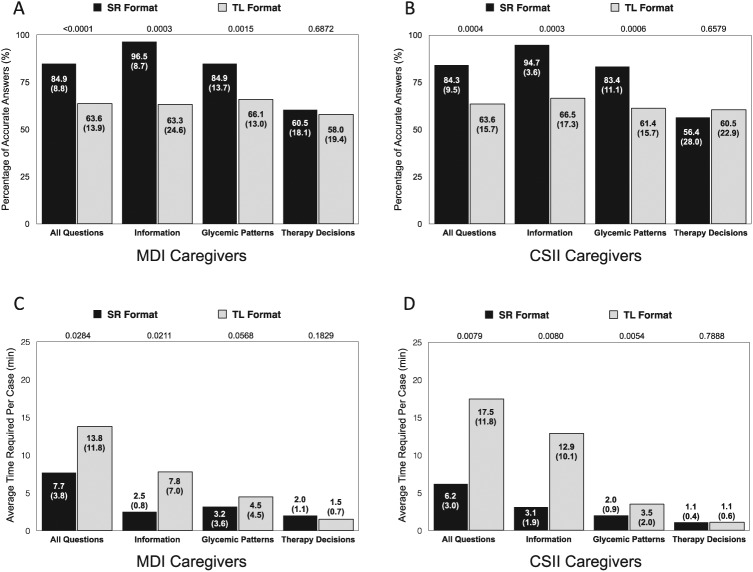
CGVs showed greater overall accuracy using SR presentations compared with TL data (84.6 [8.9]% vs 63.6 [14.4]%, P < .0001) with no between-group difference in improvement (P = .9116). In both groups, accuracy was greater when answering questions related to diabetes information and glycemic patterns but not therapy decisions (Figures 3A and 3B).
Figure 3.
CGV accuracy (A/B) and efficiency (C/D) of using software report (SR) formats compared with traditional logbook (TL) data: MDI CGVs and CSII CGVs.
Time Required
CGVs spent less time (average minutes per case) reviewing data and answering questions using SR presentations compared with TL data (7.0 [3.5] vs 15.5 [11.8] minutes, P = .0005) (Figures 3C and 3D). The mean (SD) reduction in time for all cases was greater using the SR presentations among CSII CGVs compared with MDI CGVs (−33.8 [34.0] vs −18.3 [27.0] minutes) but did not reach statistical significance (P = .2264). In both groups, less time was spent when answering questions related to diabetes information and glycemic patterns but not therapy decisions.
HCP Performance
Accuracy
HCPs showed greater accuracy, overall, using SR presentations compared with TL data: 89.5 (8.0)% versus 66.4 (12.3)%, P < .0001. Accuracy was greater when answering questions related to diabetes information and glycemic patterns but not therapy decisions (Figure 4A).
Figure 4.
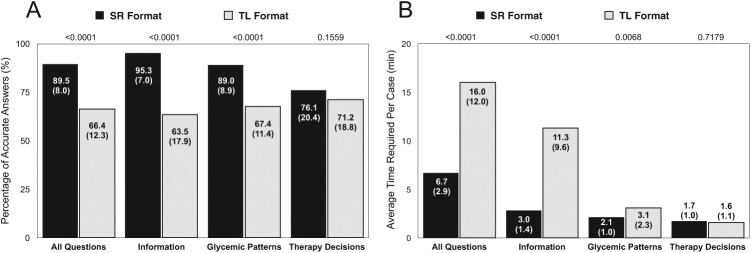
HCP accuracy (A) and efficiency (B) of using software report (SR) formats compared with traditional logbook (TL) data.
Time Required
HCPs spent less time (average minutes per case) reviewing data and answering questions using SR presentations compared with TL data: 6.7 (2.9) versus 16.0 (12.0), P < .0001. Less time was spent when answering questions related to diabetes information and glycemic patterns but not therapy decisions (Figure 4B).
Format Preferences
PWD and CGV Preferences
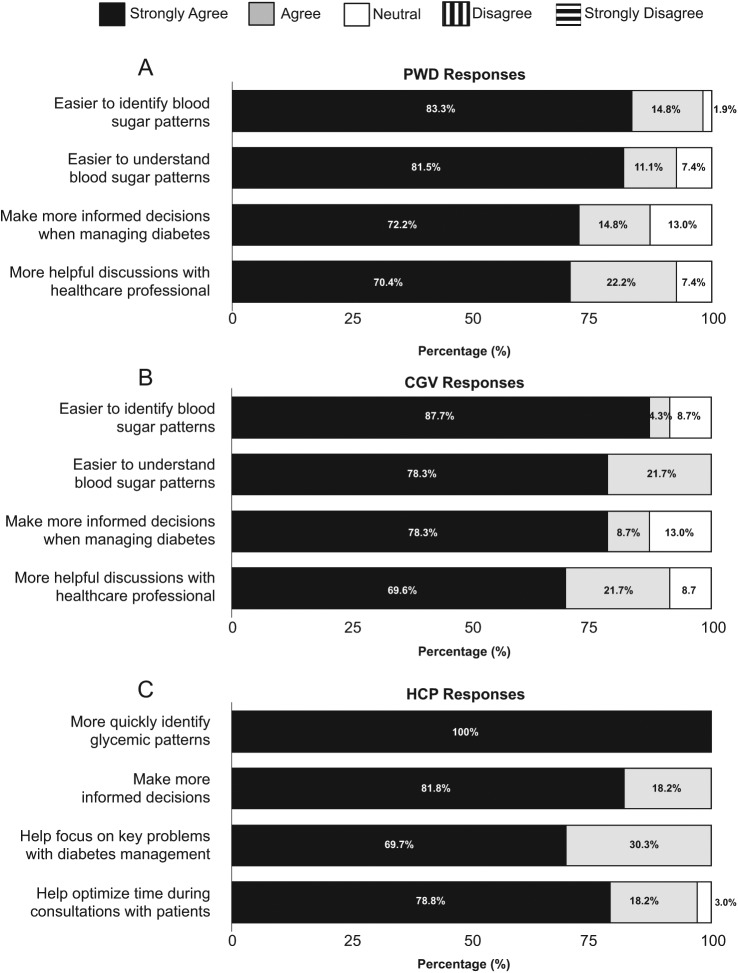
Most PWDs agreed (11.1%) or strongly agreed (77.8%) that they preferred using the SR formats versus TL data, and more than half agreed (24.1%) or strongly agreed (33.3%) that they would more likely perform SMBG per clinician recommendations when using the SR reports. A large majority of CGVs agreed (26.1%) or strongly agreed (69.6%) that they preferred using the SR repots. Figures 5A and 5B present PWD and CGV response rates to questions relating to their perceptions of SR use.
Figure 5.
Participant perceptions of software report (SR) value and utility.
HCP Preferences
All HCPs agreed (24.2%) or strongly agreed (75.8%) that they preferred using the SR formats versus TL data. Figure 5C presents HCP response rates to questions relating to the clinical utility and potential efficiency associated with SR use.
Discussion
In this prospective, comparative, online survey, participants demonstrated greater accuracy and time efficiency using the online reports compared with TL data. The majority of participants also expressed a strong preference to using the reports.
A major strength of the study is that participants were naïve to use of diabetes data management software, which suggests that effective use of the online reports is highly feasible in real-world situations. This is significant for both PWDs and CGVs, who are burdened by the many tasks associated with daily diabetes management and who are often overwhelmed by the data they generate. It is also an important finding for health care providers in primary care settings. Although these HCPs often have little experience managing diabetes, they provide care for the vast majority of individuals with diabetes in the United States who receive treatment for their disease.5
It was surprising to see that so many PWDs and CGVs in our study performed at close to the level seen in the HCPs. This reflects well on the utility of the SRs and, hopefully, demonstrates to HCPs that PWDs and CGVs are able to effectively interpret and utilize the vast amounts of data generated through daily diabetes management when provided the tools to do so. Nevertheless, the relatively low accuracy rates among all study participants underscore the need to provide additional training to clinicians and patients and/or the need for software that enhances decision making.
A key strength of our study was use of both quantitative and qualitative measures. Through this design, we were able to link participants’ strong preferences for using the reports with empirical measurement of participants’ performance in both accuracy of and efficiency, which supports the validity of our findings.
Several limitations of the study are noteworthy. First, to ensure that participants had equivalent data in the online reports and the logbooks, the information presented in the logbooks was more complete and more legible than what is typically available. This suggests that the benefits associated with the online reports may be understated compared to what would typically be found in real-world situations. Although it could be argued that the more extensive information provided in the logbook would presumably require more time to review and analyze, it is important to note that this “optimized” information is required for appropriate decision making.
A second limitation relates to the “therapy decision” questions and how they were presented to participants. As reported, we saw no differences in participants’ accuracy and speed in answering these questions; however, we suspect that the limited number of questions relating to therapy decisions resulted in a lack of sensitivity to detect differences in accuracy and efficiency. During the expert panel review, diabetes management decision questions that the panel felt tested the participants’ personal diabetes knowledge instead of use of the system to make appropriate diabetes management decisions were eliminated. This resulted in a limited number of questions. It is also likely that the questions may have directed participants’ attention to the “correct” glycemic abnormalities, which they may have missed when identifying glycemic patterns earlier in the survey. In real-world situations, PWDs, CGVs, or HCPs would not be directed to these glycemic abnormalities; therefore, inaccuracies in management decisions likely would be more pronounced. In hindsight, we believe that utilizing separate patient cases for questions regarding therapy decisions would have addressed this problem.
Although our findings clearly demonstrate that use of online reports facilitate greater accuracy and efficiency in analyzing and acting upon patient diabetes management data, the time-consuming and cumbersome procedure for uploading stored meter data into a computer to generate customized reports remains an obstacle for health care providers. The availability of tools such as the Accu-Chek CONNECT Diabetes Management System could provide a solution. The software will eventually be available as a standalone program and, in the future, as a component of an integrated system, pending regulatory approval. The system would automatically upload blood glucose meter to a smart phone application. The data would automatically be sent to a “cloud” storage platform, which could be accessed by diabetes patients/caregivers and their health care providers.
Conclusions
Technology advancements that provide seamless and wireless patient data in a format that facilitates accurate and efficient identification of glucose patterns will likely enhance the ability of patients, caregivers and health care professionals to utilize the data in meaningful ways. In the environment of increasing diabetes prevalence and decreasing reimbursement (with associated constraints on health care providers’ time), a solution that reduces diabetes burden, facilitates efficiency, and improves quality of care is a positive addition to existing armamentarium of diabetes management tools.
Acknowledgments
The authors wish to thank the participating HCPs for their assistance and commitment to this research effort.
Footnotes
Abbreviations: ACCRUES, Accu-Chek Connect Reports Utility and Efficiency Study; CGM, continuous glucose monitoring; CGV, caregiver; CHO, carbohydrate; CSII, continuous subcutaneous insulin infusion; HCP, health care provider; MDI, multiple daily insulin injections; PWD, patients with diabetes; QMMR, Qessential Medical Market Research, LLC; SMBG, self-monitoring of blood glucose; SR, software report; TL, traditional logbook.
Declaration of Conflicting Interests: The author(s) declared the following potential conflicts of interest with respect to the research, authorship, and/or publication of this article: DAH has received research funding and consulting fees from Roche Diagnostics. ML and CGP have received consulting fees from Roche Diagnostics. AB, LA, TH, and RW are employees of Roche Diagnostics.
Funding: The author(s) disclosed receipt of the following financial support for the research, authorship, and/or publication of this article: Funding for the study was provided by Roche Diagnostics, Indianapolis, Indiana, USA.
References
- 1. International SMBG Working Group/International Diabetes Federation. Global guideline on self-monitoring of blood glucose in non-insulin treated type 2 diabetes, 2009. Available at: http://www.idf.org/guidelines/self-monitoring. Accessed June 12, 2014.
- 2. Hirsch IB. Blood glucose monitoring technology: translating data into practice. Endocr Pract. 2004;10:67-76. [DOI] [PubMed] [Google Scholar]
- 3. Given JE, O’Kane MJ, Bunting BP, Coates VE. Comparing patient-generated blood glucose diary records with meter memory in diabetes: a systematic review. Diabet Med. 2013;30:901-913. [DOI] [PubMed] [Google Scholar]
- 4. Kazlauskaite R, Soni S, Evans AT, Graham K, Fisher B. Accuracy of self-monitored blood glucose in type 2 diabetes. Diabetes Technol Ther. 2009;11:385-392. [DOI] [PubMed] [Google Scholar]
- 5. US Department of Health and Human Services. National Ambulatory Medical Care Survey, 2004. Available at: http://www.cdc.gov/nchs/data/ad/ad346.pdf.


