

Abstract
Background:
In previous studies, meters employing dynamic electrochemistry (DE), have been shown to correct for hematocrit (HCT) interference. This laboratory investigation assessed the HCT stability of MyStar Extra (Sanofi) in comparison to 7 competitive devices (Accu-Chek Aviva Nano & Accu-Chek Performa, Roche Diagnostics; Contour XT and Contour Link, Bayer; FreeStyle Freedom Lite, Abbott; MyLife Pura, Ypsomed; OneTouch Verio Pro, LifeScan).
Method:
Venous heparinized blood was freshly drawn, immediately aliquoted, and manipulated to contain 3 different blood glucose concentrations (50-80 mg/dL, 150-180 mg/dL, and 350-400 mg/dL) and 5 different HCT levels (20-25%, 30-35%, 40-45%, 50-55%, and 60-65%). After careful oxygenation to normal blood oxygen pressure, each of the 15 different samples was measured 8 times with 2 devices and 2 strip lots of each meter (32 measurements/meter/sample). YSI Stat 2300 served as laboratory reference method. Next to determination of the mean absolute relative deviation (MARD), stability to HCT influence was assumed, when less than 10% difference occurred between the highest and lowest mean glucose deviations in relation to HCT over all tested glucose ranges (HIF: hematocrit interference factor).
Results:
Four of the devices showed stable performance: Contour XT (MARD: 1.3%/HIF: 6.1%), MyStar Extra (4.7%/7.1%), OneTouch Verio Pro (4.5%/7.3%), and Contour Link (6.3%/9.3%). The 4 other meters were influenced by HCT (Accu-Chek Performa: 4.7%/20.9%, Accu-Chek Aviva Nano: 4.5%/22.4%, FreeStyle Freedom Lite: 4.8%/24.5%; MyLife Pura: 6.4%/28.7%).
Conclusions:
In this study, all meters showed a good accuracy, but only 50% of them, including MyStar Extra, were shown to reliably correct for potential hematocrit influence on the meter results.
Keywords: blood glucose meter, hematocrit interference, dynamic electrochemistry, accuracy
Prevalence of abnormal hematocrit values (HCT) in diabetic is a phenomenon that is underestimated by physicians and diabetes nurse educators. HCT is generally considered to be quite stable in the range of 40-45% and blood glucose meters for patient self-testing are usually set to function properly with HCT concentration in this “normal range.” However, a thorough investigation of the hematocrit distribution in an urban community has demonstrated a HCT-range of 30-50% in a healthy reference population. In community patients, the observed HCT ranged between 20% and 60%, and in hospital patients it was 10% to 70%. Patients in the intensive care units showed levels between 15% and 40%.1 In older patients also suffering from various diseases, these variations can even be more pronounced and may have an impact on the patient’s prognosis, for example, in patients with kidney disease.2 In daily routine, changes in the hematocrit levels can be the result of lifestyle interventions (eg, smoking, prolonged exercise), can come with demographic conditions (eg, age), and can be induced by disease- and drug-related conditions (eg, hematological disorders, hypermenorrhea, pregnancy, or renal disease) and by environmental conditions (eg, stay in high mountains, seasonal variation).3-5
Hematocrit interference has previously been identified as a source for inaccuracies of blood glucose meter readings in daily routine.6,7 In meters employing static electrochemistry, lower than normal hematocrit values (<35%) can result in overestimating readings in comparison to the laboratory glucose levels, whereas hematocrit values higher than normal (>45%) may result in underestimates of laboratory values.8-13 The primary reason for this issue is the internal calibration of the analysis process, which is based on the assumption of a standardized 45% hematocrit value of the sample. Among the various hypotheses that have been suggested to explain the impact of abnormal hematocrit levels on glucose testing are alterations in the viscosity of the blood, a possible blocking of the plasma glucose to reaching the reaction surface of the test strip, changes in diffusion kinetics, and/or increased packed red cell volume and displacement of plasma volume leading to insufficient plasma volume for accurate testing at the electrode.14
Possible technology solutions to avoid hematocrit interference include the parallel measurement of hematocrit with a subsequent correction algorithm as employed by the point-of-care StatStrip device (NovaBiomedical, Waltham, MA).15,16 An alternative approach to reduce hematocrit interference is the application of a physical and mathematical result correction also referred to “dynamic electrochemistry.” We have been able to demonstrate in recent investigations that devices for patient self-testing employing dynamic electrochemistry are unaffected not only by hematocrit interference in the laboratory17-19 but also in a clinical accuracy evaluation.20
A new device employing dynamic electrochemistry, MyStar Extra (Sanofi, Frankfurt), has recently been introduced to the market. The purpose of this investigation was to confirm that the dynamic electrochemistry algorithms established in the MyStar Extra device are suitable to correct for hematocrit interference by using our standardized hematocrit interference testing protocol in comparison to 7 commercially available competitive devices.
Materials and Methods
Study Devices
The study devices with 1 exception and all strips were purchased by us from regular pharmacy supplies. The study device MyStar Extra was provided by Sanofi. In addition, the following glucose meters were included in this study: Contour XT, Contour Link (Bayer, Leverkusen, Germany), FreeStyle Lite (Abbott, Wiesbaden, Germany), My Life Pura (Ypsomed, Bad Schwalbach, Germany), Accu-Chek Aviva Nano, Accu-Chek Performa (Roche Diagnostics, Mannheim, Germany), and OneTouch Verio Pro (LifeScan, Neckargemünd, Germany). The YSI (Yellow Springs Instrument) 2300 STAT PLUS Glucose Analyzer (Life Sciences, GOD method, Langenfeld, Germany) was utilized as reference method. All devices and supplies were stored and operated in accordance with manufacturer’s instructions.
Collection of Blood Samples and Laboratory Settings
Sample preparation and processing was performed by a standardized protocol as published previously.17 Blood samples were collected in compliance with local ethical and legal requirements. Venous, heparinized whole blood was drawn on the day of the experiment and immediately manipulated to contain 3 different blood glucose concentrations and 5 different hematocrit levels (15 different samples in total). Samples were aliquoted and stored at 4°C until measurement. Before the start of the experiment, glucose concentration, hematocrit values, and the degree of oxygen saturation were confirmed by means of the ABL80 FLEX CO-OX blood gas analyzer (Drott, Wiener Neudorf, Austria) and carefully adjusted if necessary. The degree of oxygenation had to remain within physiological capillary values (range, 80-100%). Prior to start the measurements, all glucose meters were checked for proper function with quality control solutions. Glucose measurements were conducted using 2 devices of each meter type and 2 test strip lots. Each meter/strip combination was tested 8 times (8 measurements/meter/test strip lot/sample = 480 measurements in total). All tests were carried out simultaneously for each meter by a group of trained personnel in a laboratory setting with controlled room temperature (21 ± 4°C) and humidity (44-68%).
Sample Processing
The freshly drawn blood was spiked to 3 target glucose concentrations using a 10% concentrated glucose solution (Serag-Wiessner KG, Naila, Germany) to the following target ranges: 50-80 mg/dL, 150-180 mg/dL, and 350-400 mg/dL. The blood was gently mixed in a 15 mL test tube and aliquted. Subsequently, part of the samples were carefully centrifuged to separate cells from plasma and both fractions were used to adjust other aliquots to a desired hematocrit target level (approx. 20-25%, 30-35%, 40-45%, 50-55%, and 60-65%). The hematocrit and the oxygen pressure were verified in each manipulated sample by means of ABL80 FLEX CO-OX blood gas analyzer (Sendx Medical/Radiometer, Carlsbad, CA). If the oxygenation saturation was below the meter specifications (ie, out of physiological range), individual samples were carefully oxygenized by gently inverting the tube at room temperature. Following repeated hematocrit and oxygen saturation measurements and confirmation of readjusted values, an aliquot of the individual sample was centrifuged at 300 × g for 5 minutes at 4°C to separate plasma from red blood cells. The obtained plasma was measured with the reference device at room temperature.
Statistical Analyses
The data were collected and tabulated for each meter. Statistical analyses included calculation of the mean values and standard deviations for each meter type/sample combination. The mean of the differences from the comparison method was used for calculating the mean absolute relative deviation (MARD) for each meter at the 3 glucose concentrations. This accuracy analysis as well as the determination of the coefficient of variation (precision) was performed only with the samples that showed a hematocrit value of 45%. The mean glucose value determined at a hematocrit of 45% was normalized to be 100% to determine the potential bias (% deviation) occurring at the other hematocrit levels. The means of the deviations between the different hematocrit samples were used for calculating a hematocrit interference factor (HIF = largest observed bias above 100% + largest observed bias below 100%) for each meter with the mean relative results obtained from the 3 glucose concentrations. An HIF < 15% for the individual glucose level and a mean HIF over the entire glucose ranges < 10% was predefined as indicative for no clinically relevant influence of hematocrit on the blood glucose readings, as defined previously.17 Comparisons between mean values were calculated by means of the 2-sided Student’s t test. A P value < .05 was considered statistically significant.
Results
All glucose measurements for each individual blood sample were completed by all meters within 13 minutes after the release of the sample for study measurements. In total, 480 measurements were performed on 15 manipulated blood samples per BGM type using 2 devices and 2 glucose strip lots (except for Accu-Chek Performa for which only 1 test strip lot was available on the market). The achieved final blood glucose values, as determined by the YSI plasma reference device, were within 58-67 mg/dL, 156-159 mg/dL, and 368-371 mg/dL. The hematocrit values were confirmed to be within 24.6-25.2%, 30.3-33.0%, 42.1-43.6%, 50.2-53.2%, and 60.1-62.5%, respectively.
Figure 1 illustrates the performance of the MyStar Extra device at the different hematocrit levels over 3 glucose concentrations. As can be seen, the device technology was confirmed to be stable against hematocrit interference. The results of the other devices tested are shown in Figures 2 and 3. Like in previous similar investigations, the 2 Accu-Chek devices showed hematocrit sensitivity, as does MyLife Pura and FreeStyle Lite. No or only minor interference was determined for OneTouch Verio Pro, Contour XT, and Contour Link.
Figure 1.
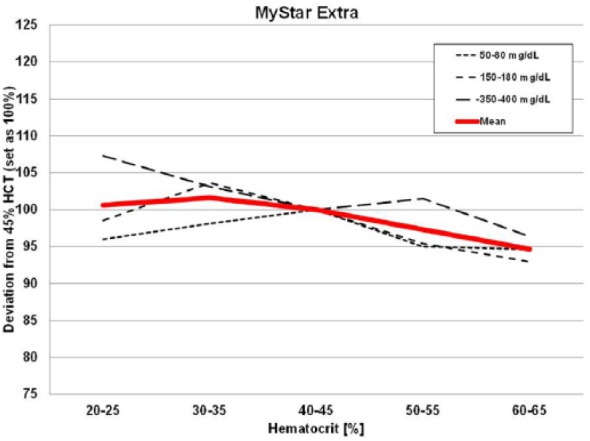
Results of the hematocrit interference test protocol with MyStar Extra.
Figure 2.

Results of the hematocrit interference test protocol with Contour XT, Contour Link, FreeStyle Freedom Lite, and MyLife Pura.
Figure 3.

Results of the hematocrit interference test protocol with Accu-Chek Aviva Nano, Accu-Chek Performa, and OneTouch Verio Pro.
Considering an HIF < 15% for the individual glucose levels and an HIF < 10% over the entire glucose range arbitrarily to be the criteria for “noninterference” for clinical use,17 only 4 out of 8 tested devices would have met the stringent requirements: Contour XT (6%), MyStar Extra (7%), OneTouch Verio Pro (7%), and Contour Link (9%; see Figure 4).
Figure 4.
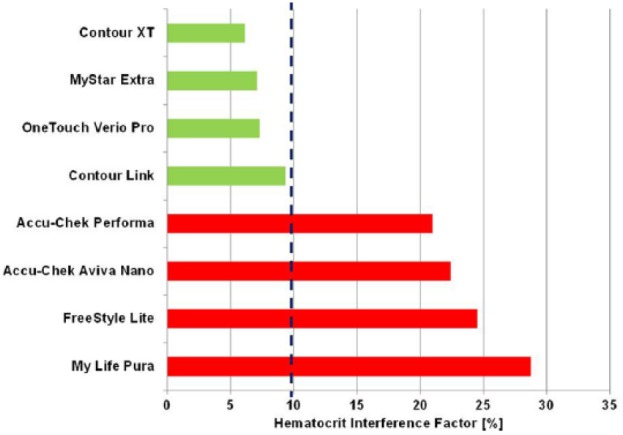
Hematocrit interference factor of all tested devices for benchmark comparison of hematocrit interference.17
The accuracy of MyStar Extra versus the comparator devices is shown in Table 1. The closest overall accuracy results in this experiment were recorded for Contour XT device (MARD: 1.6%). All 8 tested devices exhibited very good precision results not exceeding 15%. The lowest overall precision results were obtained by the OneTouch Verio Pro device (4.0%).
Table 1.
Key Performance Parameters as Observed for the Different Devices.
| Device | MARD (%) | Imprecision (%) | HIF (%) |
|---|---|---|---|
| Accu-Chek Aviva Nano | 4.5 | 8.1 | 22.4 |
| Accu-Chek Performa | 4.7 | 8.2 | 20.9 |
| Contour Link | 6.3 | 6.1 | 9.3 |
| Contour XT | 1.3 | 4.3 | 6.1 |
| FreeStyle Freedom Lite | 4.8 | 9.4 | 24.5 |
| MyLife Pura | 6.4 | 11.0 | 28.7 |
| MyStar Extra | 4.7 | 5.4 | 7.1 |
| OneTouch Verio Pro | 4.5 | 4.0 | 7.3 |
Discussion
Dynamic electrochemistry is a well known physicochemical method and was originally used to measure 2 different chemical substances in 1 aqueous solution. It has been further developed for use in more complex sample matrices and was finally incorporated into commercially available blood glucose meters for patient self-measurement, such as the BG*Star and iBG*Star devices from Sanofi-Aventis,21 and recently in the new device MyStar Extra. The mathematical model is based on the assumption that each oxidation process leads to an electrode signal, which can be represented by a unique vector based on a phase angle (psi) and a unique vector length (YO) in a 3-dimensional space. The concentration of each substance in the sample leading to an electron transfer can be determined by monitoring the change in the admittance magnitude in the direction of the characteristic angle for that particular substance when applying different baseline measurement conditions (frequency, voltage, etc). The total Faradaic admittance for all electro-active substances present is given by a linear combination of the independent vectors from the different species. By performing measurements at different measurement conditions, it is possible to calculate the individual contribution of an interfering substance based on the knowledge of the substance-specific phase angle of the oxidation signal. Existing calibration curves and the knowledge about phase angle and vectors are the basis to measure glucose in samples containing several electro-active substances by correcting the measured total admittance from several underlying measurement conditions for the influence of a variety of known interfering conditions and substances.21,22 In our laboratory study with MyStar Extra, the application of this method lead to accurate readings independent from hematocrit variation. As to be expected, the results are similar to those obtained with other blood glucose meters employing dynamic electrochemistry in a previous investigation.18
Next to the sponsor device, 3 other meters were also demonstrating stability to hematocrit interference. The same meters or meters from the same manufacturers and based on the respective technology have also shown similar results in previous investigations.17-20 These blood glucose measurement systems are also known to use mathematical algorithms to correct for hematocrit interference, but the exact nature of these procedures has not been disclosed to the public, but it is tempting to speculate that it may be a similar approach like dynamic electrochemistry. The meters that failed our hematocrit interference test are known to apply static electrochemistry, which explains the observed results.
The acceptance criteria of an HIF of 10% has been arbitrarily selected based on current laboratory standards for general substance interference testing with biochemical methods and is also based on clinical considerations, for example, the likelihood of choosing a different insulin dose if a value is too high or too low due to hematocrit interference. This threshold has been applied by us in previous publications and appears to be a suitable benchmark parameter to differentiate between devices with or without hematocrit interference.17-20
Our investigation has several important limitations, which prohibit a direct translation of our laboratory results into clinical practice recommendations. First, this investigation was performed in an artificial laboratory setting with manipulated venous samples. While we have been able to develop a very robust protocol leading to good accuracy results, this study was designed to provide information regarding the effect of hematocrit on the underlying technology of the investigated meters. However, all explored devices are designed to optimally operate in accordance with the instructions for use, that is, with capillary blood obtained from the fingertip in a clinical environment. Therefore, we have not interpreted the obtained data about the observed absolute accuracy or precision.
Second, sample specimen and environmental factors were controlled in our experiment for all devices; other factors such as the complexity of chemical reactions, the involvement of different coenzymes, and additional unknown strip components may have further influenced our results. In this context, it is important to mention that oxygen pressure plays a crucial role in the laboratory performance assessment of devices employing dynamic electrochemistry
Finally, the 2 Accu-Chek devices, OneTouch Verio Pro, Contour XT, Contour Link, and FreeStyle Freedom Lite use strips based on a glucosede-hydrogenase method. However, while all meters are calibrated against glucoseoxidase reference methods, the 2 Accu-Chek devices are calibrated with a glucohexokinase technology. Only MyStar Extra and MyLife Pura operate with glucose-oxidase based strips and are calibrated with glucose-oxidase based methods. In our study, we used the glucose oxidase-based YSI analyzer as the comparison method. This experimental design may have influenced the reported accuracy results. A negative bias of 3-8% has been described between YSI 2300 STAT and the hexokinase-based Olympus AU640 reference method.23,24 As such, different reference methods might introduce a deviation of the values, which is not caused by the device itself. While we believe that these limitations do not change the meaning of our hematocrit interference findings, they have to be considered when interpreting our data.
In conclusion of this study, all meters showed a good accuracy in a laboratory setting, but only 50% of them, including MyStar Extra, were shown to reliably correct for potential hematocrit influence on the meter results. The limitations of our laboratory approach have to be taken into account when drawing conclusions for the clinical patient care.
Footnotes
Abbreviations: DE, dynamic electrochemistry; GOD, glucose oxidase; HCT, hematocrit; HIF, hematocrit interference factor; MARD, mean absolute relative deviation.
Declaration of Conflicting Interests: The author(s) declared the following potential conflicts of interest with respect to the research, authorship, and/or publication of this article: AP received research grants, travel support, and consultancy fees from Sanofi.
Funding: The author(s) disclosed receipt of the following financial support for the research, authorship, and/or publication of this article: This investigator-initiated study was supported by an unrestricted grant from Sanofi.
References
- 1. Lyon ME, Lyon AW. Patient acuity exacerbates the discrepancy between whole blood and plasma methods through error in molality to molarity conversion: “Mind the gap!” Clin Biochem. 2011;44:412-417. [DOI] [PubMed] [Google Scholar]
- 2. Volkova N, Arab L. Evidence-based systematic literature review of hemoglobin/hematocrit and all-cause mortality in dialysis patients. Am J Kidney Dis. 2006;47:24-36. [DOI] [PubMed] [Google Scholar]
- 3. Thirup P. Haematocrit: within-subject and seasonal variation. Sports Med. 2003;33:231-243. [DOI] [PubMed] [Google Scholar]
- 4. Takubo T, Tatsumi N. Reference values for hematologic laboratory tests and hematologic disorders in the aged. Rinsho Byori. 2000;48(3):207-216. [PubMed] [Google Scholar]
- 5. Macdougall IC, Ritz E. The Normal Haematocrit Trial in dialysis patients with cardiac disease: are we any the less confused about target haemoglobin? Nephrol Dial Transplant. 1998;13(12):3030-3033. [DOI] [PubMed] [Google Scholar]
- 6. American Diabetes Association. Consensus statement on self-monitoring of blood glucose. Diabetes Care. 1987;10:95-99. [PubMed] [Google Scholar]
- 7. American Diabetes Association. Clinical practice recommendations 1996. Diabetes Care. 1996;19(suppl 1):S1-S11. [PubMed] [Google Scholar]
- 8. Pavlicek V, Garzoni D, Urech P, Brändle M. Inaccurate self-monitoring of blood glucose readings in patients on chronic ambulatory peritoneal dialysis with icodextrin. Exp Clin Endocrinol Diabetes. 2006;114(3):124-126. [DOI] [PubMed] [Google Scholar]
- 9. Puntmann I, Wosniok W, Haeckel R. Comparison of several point-of-care testing (POCT) glucometers with an established laboratory procedure for the diagnosis of type 2 diabetes using the discordance rate: a new statistical approach. Clin Chem Lab Med. 2003;41;809-820. [DOI] [PubMed] [Google Scholar]
- 10. Tang Z, Lee JH, Louie RF, Kost GJ. Effects of different hematocrit levels on glucose measurements with handheld meters for point-of-care testing. Arch Pathol Lab Med. 2000;124:1135-1140. [DOI] [PubMed] [Google Scholar]
- 11. Phillipou G, Seaborn CJ, Hooper J, Phillips PJ. Capillary blood glucose measurements in hospital inpatients using portable glucose meters. Aust N Z J Med. 1993;23:667-671. [DOI] [PubMed] [Google Scholar]
- 12. Smith EA, Kilpatrick ES. Intra-operative blood glucose measurements: the effect of haematocrit on glucose test strips. Anaesthesia. 1994;49:129-132. [DOI] [PubMed] [Google Scholar]
- 13. Louie RF, Tang Z, Sutton DV, Lee JH, Kost GJ. Point-of-care glucose testing: effects of critical care variables, influence of reference instruments, and a modular glucose meter design. Arch Pathol Lab Med. 2000;124:257-266. [DOI] [PubMed] [Google Scholar]
- 14. Nichols JH, Howard C, Loman K, Miller C, Nyberg D, Chan DW. Laboratory and bedside evaluation of portable glucose meters. Am J Clin Pathol. 1995;103:244-251. [DOI] [PubMed] [Google Scholar]
- 15. Karon BS, Griesmann L, Scott R, et al. Evaluation of the impact of hematocrit and other interference on the accuracy of hospital-based glucose meters. Diabetes Technol Ther. 2008;10:111-120. [DOI] [PubMed] [Google Scholar]
- 16. Pfützner A, Harzer O, Musholt PB, Scherer S, Löbig M, Forst T. Study on the performance of different blood glucose measurement systems when influenced by interfering substances. Diabetes Stoffw Herz. 2009;18:387-392. [Google Scholar]
- 17. Musholt PB, Schipper C, Thomé N, et al. Dynamic electrochemistry corrects for hematocrit interference on blood glucose determinations with patient self-measurement devices. J Diabetes Sci Technol. 2011;5:1167-1175. [DOI] [PMC free article] [PubMed] [Google Scholar]
- 18. Pfützner A, Musholt PB, Schipper C, et al. Blood glucose meters employing dynamic electro-chemistry are stable against hematocrit interference in a laboratory setting. J Diabetes Sci Technol. 2013;7:1530-1537. [DOI] [PMC free article] [PubMed] [Google Scholar]
- 19. Ramljak S, Lock JP, Schipper C, et al. Hematocrit interference of blood glucose meters for patient self-measurement. J Diabetes Sci Technol. 2013;7:179-189. [DOI] [PMC free article] [PubMed] [Google Scholar]
- 20. Pfützner A, Schipper C, Ramljak S, et al. Determination of hematocrit interference in blood samples derived from patients with different blood glucose concentrations. J Diabetes Sci Technol. 2013;7:170-178. [DOI] [PMC free article] [PubMed] [Google Scholar]
- 21. Iyengar S, Hall EA. Phasor transform to extract glucose and ascorbic acid data in an amperometric sensor. Analyst. 2000;125:1987-1992. [DOI] [PubMed] [Google Scholar]
- 22. Iyengar S, Wiley M, Nadeau D. Performance of the WaveSense™-enabled glucose monitoring system across multiple lots. Diabetes Stoffw Herz. 2007;16(1):15-20. [Google Scholar]
- 23. Twomey PM. Plasma glucose measurement with the Yellow Springs Glucose 2300 STAT and the Olympus AU640. J Clin Pathol. 2004;57:752-754. [DOI] [PMC free article] [PubMed] [Google Scholar]
- 24. Genter P, Ipp E. Accuracy of plasma glucose measurements in the hypoglycemic range. Diabetes Care. 1994;17:595-598. [DOI] [PubMed] [Google Scholar]