Abstract
Two-photon laser-scanning microscopy enables to record neuronal network activity in three-dimensional space while maintaining single-cellular resolution. One of the proposed approaches combines galvanometric x-y scanning with piezo-driven objective movements and employs hardware feedback signals for position monitoring. However, readily applicable methods to quantify the accuracy of those feedback signals are currently lacking. Here we provide techniques based on contact-free laser reflection and laser triangulation for the quantification of positioning accuracy of each spatial axis. We found that the lateral feedback signals are sufficiently accurate (defined as <2.5 µm) for a wide range of scan trajectories and frequencies. We further show that axial positioning accuracy does not only depend on objective acceleration and mass but also its geometry. We conclude that the introduced methods allow a reliable quantification of position feedback signals in a cost-efficient, easy-to-install manner and should be applicable for a wide range of two-photon laser scanning microscopes.
OCIS codes: (180.6900) Three-dimensional microscopy, (180.4315) Nonlinear microscopy, (170.0180) Microscopy, (170.2520) Fluorescence microscopy, (180.2520) Fluorescence microscopy
1. Introduction
Since the introduction of two-photon laser scanning microscopy [1] and its application for measuring neuronal network activity in three-dimensional space in vivo [2], the technique has been continuously improved, gaining for higher temporal resolution and higher coverage of three-dimensional networks at single cell resolution [3–12]. As naïve neuronal networks are distributed not only in two spatial dimensions, functional three-dimensional investigations increasingly play a central role in neuroscience. Recently, the feasibility of quasi-simultaneous calcium imaging from hundreds of cells was demonstrated using three-dimensional random access scanning [14–16]. Alternatively, a simpler approach combines widely used classical galvanometric lateral scanning with a focusing piezo actuator, providing volume scans with an edge length of 100 – 250 µm at 10 Hz by using a spiral-shaped scan trajectory [2, 17]. The disadvantage of losing morphological information of cellular targets by both continuous spiral scan trajectories and discontinuous random access scanning can be overcome by reconstructing the spatial information using a spatially highly resolved reference z-stack acquired directly before or after the fast functional measurements [2, 14–17]. Therefore, an accurate monitoring of the absolute position of the focal volume over time is the main requirement accomplishing a reliable reconstruction of the spatial information of targeted cells. So far, internal feedback signals of the microscope’s positioning devices were routinely used to achieve this goal [2, 4, 10, 17]. Using fluorescent beads embedded in agarose, the feasibility of reconstructing morphological information was shown [2]. Furthermore, the stability of the scan trajectory was qualitatively demonstrated by bleaching a homogeneous fluorescent plastic sample [7]. Nevertheless to our knowledge, a quantitative validation of the position feedback signals is still missing.
Hence, the aim of our study was to develop independent methods to quantify absolute positioning accuracy using external references. Considering that the mean diameter of neuronal cell bodies is about 10 µm, the maximal tolerable positioning deviation of the feedback from the reference was defined to be ±2.5 µm. Two different experimental arrangements were used to quantify the lateral and axial positioning accuracy for each axis separately. Lateral positioning accuracy was quantified by scanning a stage micrometer with reflective tick marks providing discrete position information. For quantification of axial positioning accuracy, a commercial laser triangulation sensor was used as axial position reference. These methods are cost-efficient, easy to install and should be applicable for a wide range of two-photon laser scanning microscopes (2PLSM).
2. Instrumentation and methods
Measurements were carried out using a Movable Objective Microscope (Sutter Instrument, Novato, CA, USA), equipped with two galvanometric scan mirrors (6210H, MicroMax 673XX Dual Axis Servo Driver, Cambridge Technology, Bedford, MA, USA) and a piezo focussing unit (P-725.4CD PIFOC, E-665.CR amplifier, Physik Instrumente, Karlsruhe, Deutschland), controlled by custom-made software written in LabVIEW 2010 (National Instruments, Austin, TX, USA). Data were acquired using two synchronized data acquisition devices (NI 6110, NI 6711, National Instruments, Austin, TX, USA).
2.1. Fluorescent beads embedded in agarose
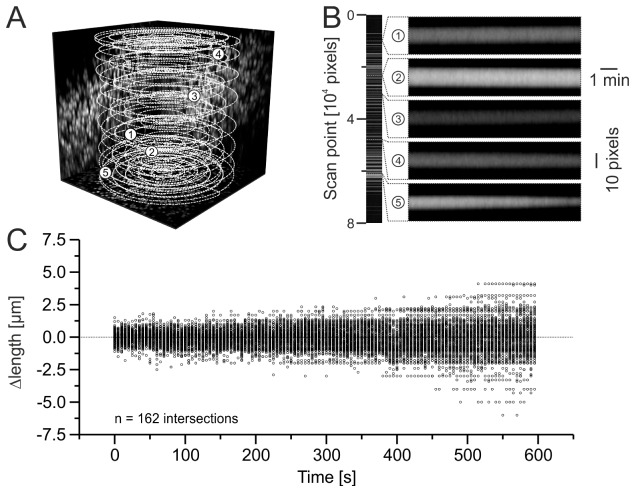
For an initial assessment of positioning stability, we used fluorescent beads embedded in agarose. Fluorescent beads (F8836, Thermo Fisher Scientific, Waltham, MA, USA), 10 µm in diameter, were dispersed in an agar block (4% in double distilled water) to a final concentration of approximately 20000 beads/mm3. A volume of 500 × 500 × 200 µm3 was scanned at a frequency of 10 Hz over a period of 10 minutes using spiral scanning [2]. A three-dimensional spiral consisted of damped sinusoidal movements of the x- and y-galvanometers (phase shifted by 90°), which were repeated 18 times during one period of a sinusoidal movement of the piezo actuator (including a 180°-phase shift at the half period). The number of windings per xy-spiral was 5.6 and the three-dimensional distance between each scan point was set to 1 µm. Immediately before spiral scanning, a z-stack was acquired [512 × 512 pixels, 496 × 496 µm, 101 optical sections in z direction (Δz = 2 µm), 5 images per section were averaged, frame rate 2 Hz], providing bead position information in the scanned volume. Intersected beads (scan positions which are located in or near a bead volume from a bright plateau along the scan trajectory) were identified by visual inspection of the intensity plot of spiral scan data (80000 scan points × 6000 scan periods). Using a threshold algorithm, changes in length of each intersection were calculated in 5 s intervals (data was averaged over 50 scan periods, n = 120 time intervals per intersection). Initial intersection lengths were determined as the mean of the first 10 intervals. Clotted beads, which appear as close or combined plateaus in the intensity profile were excluded from analysis.
2.2. Lateral positioning accuracy
Using reflective tick marks of a stage micrometer (tick mark distance: 10 ± 0.2 µm, R1L3S2P, Thorlabs, Newton, NJ, USA) as one-dimensional reference positions enabled us to quantify the lateral positioning accuracy (x- and y-axis respectively, Fig. 1(A)). To this end, the light beam provided by a tunable Ti:Sapphire laser set to 740 nm (Chameleon Ultra II, Coherent, Santa Clara, CA, USA) was directed through a 670 nm dichroic mirror (670 DCXXR, Chroma Technology, Bellows Falls, VT, USA) and projected onto the micrometer using a 20× water immersion objective (XLUMPLFLN 20XW, Olympus, Tokio, Japan). The stage micrometer was positioned under the objective, optically coupled with a drop of water. An achromatic quarz-MgF2 zero-order wave plate (10RP52-2, Newport Corporation, Irvine, CA, USA), a glan-laser calcite polarizer (10GL08, Newport Corporation, Irvine, CA, USA) and a pockels cell (M350-80LA, Conoptics, Danbury, CT, USA) mounted consecutively were used to adjust laser power. Care was taken not to damage the photomultiplier tube (PMT) due to high reflected light intensities. Applying command voltages to a single galvanometer (uCx or uCy) provided the detection of maximal reflection intensities of reference positions during motion of the projected light beam (Fig. 1(B)). Intensities were converted in currents by a PMT (H10770PA-40, Hamamatsu Photonics, Hamamatsu, Japan) and subsequently in voltages (uPMT) by a preamplifier (C7319, bandwidth: 100 kHz, Hamamatsu Photonics, Hamamatsu, Japan). Starting from the leftmost scan position, the first detected peak was annotated with 0 µm. Every consecutive peak position was incremented by 10 µm (reference position pRx or pRy). In order to validate the positioning accuracy of the x- and y-axis, each feedback signal of a galvanometer (uFx or uFy) was correlated to the determined external reference positions (pRx or pRy).
Fig. 1.
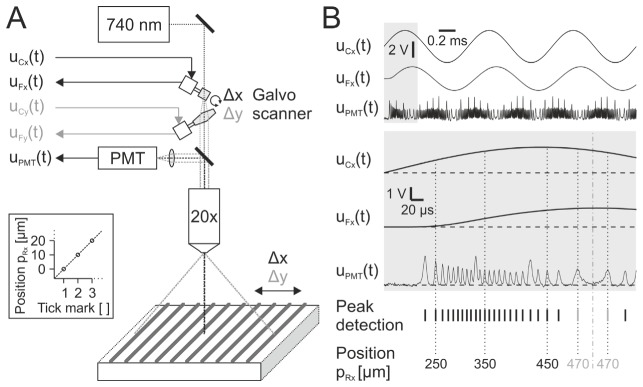
Principle of measuring lateral positioning accuracy. (A) Experimental arrangement. Laser focus is dynamically deflected by one of two galvanometers and projected on a reflective grid of lines (distance: 10 ± 0.2 µm). Focus position at a specific time point depends on applied galvanometer command voltage uCx(t) (or uCy(t)). Position feedback signal uFx(t) (or uFy(t)) is continuously measured. Reflected laser beam intensity is simultaneously measured by a PMT and converted into voltage uPMT(t). Inset shows relation between absolute focus position and grid tick marks. (B) Exemplified x-axis measurement. Top: Traces of uCx(t), uFx(t) and uPMT(t). Gray box is scaled up and displayed below. Note that there is a significant phase shift between command signal uC(t) and resulting mirror movement (uF(t)). Peak detection indicates identified reflection maxima in uPMT(t). Absolute positions pRx (or pRy) are calculated by discrete 10 µm distances of detected peaks. Note that calibrated position reverses after a change of galvanometer motion direction (gray highlighted, position 470 µm). Dashed lines indicate zero points (0 V). The dashed dotted line indicates position turning point.
The stage micrometer was aligned to the microscope by using a 1 Hz full field frame scan (512 × 512 pixels) and a micromanipulator (Mini 25 3Axes, Luigs & Neumann, Ratingen, Germany). Tick marks were oriented at right angle to the assessed scan axis. Tilt effect was minimized by small angular movements and visually inspected in the reflection image. Alignment was done until all reflected lines were in approximately one focal plane (<5° tilt angle of the reflected profile). After alignment, the command signal of the y-axis galvanometer uCy(t) was constantly set to 0 V, in order hold its mirror in center position, while assessing the x-axis. Subsequently, command signals uCx(t) consisting of at least 30 periods of triangular, saw-tooth or undamped and damped sinusoidal shaped trajectories were tested (amplitudes: 0.5 – 2 V, frequencies: 1 – 2000 Hz). A damped sinusoidal trajectory represents a one-dimensional component of a two- or three-dimensional spiral scan (five windings per xy-spiral, one or 12 repetitions, scan point distance 1 µm).
Trials producing hardware errors, e.g. because acceleration limits were passed, were excluded from analysis. To assign the tick mark positions to scan time points, a threshold algorithm was applied to the acquired reflection data uPMT(t) of each scanning trial and the results were visually inspected subsequently. A local maximum in reflection intensity (peak) was considered to be the center of a micrometer tick mark and therefore used for further analysis, if 1) uPMT(t) locally exceeded the threshold (1.7 – 2.2 V) and returned to sub-threshold level, 2) no saturation in any sample point of the peak occurred, 3) the distance in time to a change in galvanometer motion direction was at least 15 samples, and 4) the peak could be verified by subsequent visual inspection. The same procedure was applied to assess the y-axis, by a 90°-rotation of the stage micrometer and a swapping of uCx(t) and uCy(t).
2.3. Axial positioning accuracy
In order to validate accuracy of the z-axis feedback signal, a position reference signal was derived from a simultaneously measured distance between a moving piezo load and a stationary laser triangulation sensor (AM400, CMOS resolution: 0.1 µm, ALLSENS Messtechnik, Dreieich, Germany, Fig. 2(A)). The objective was replaced by a dummy in order to provide an appropriate target surface. The axial position of the dummy was monitored via the integrated capacitive position detector of the piezo focussing unit (position feedback uFz) and correlated with a simultaneously measured reference position (pRz) using laser triangulation (Fig. 2). The piezo amplifier operated in closed-loop mode, thereby reducing drift and hysteretic effects. In order to maintain the necessary speed for fast three-dimensional scans, accelerations were minimized by using sinusoidal command voltages (uCz, amplitude: 0.625 – 5 V, frequency: 1 – 20 Hz, 100 periods per trial). To investigate a potential dependence of the position of the center of mass, three objective dummies of different length were used as piezo load and, also, as triangulation targets: 1) “regular”: Lregular = 73 mm, 2) “short”: Lshort = 0.5 × Lregular, 3) “long”: Llong = 2 × Lregular (material: sandblasted brass or bronze). The mass of all three dummies was equal to the mass of the original objective (m = 230 g, XLUMPLFLN 20XW). An additional target referred to as “none” with a length of <1 mm and a mass of about 2 g has been used as almost massless control (material: sandblasted aluminum). The triangulation sensor was centered on the front surface of every respective target. Initial tilt angles between the optical axes of the sensor and the microscope were corrected using a pitch and yaw platform (PY003, Thorlabs, Newton, NJ, USA). For each scan trial, the analysis was restricted to the steady-state of the piezo positioning response function by excluding the initial 50 periods [7].
Fig. 2.
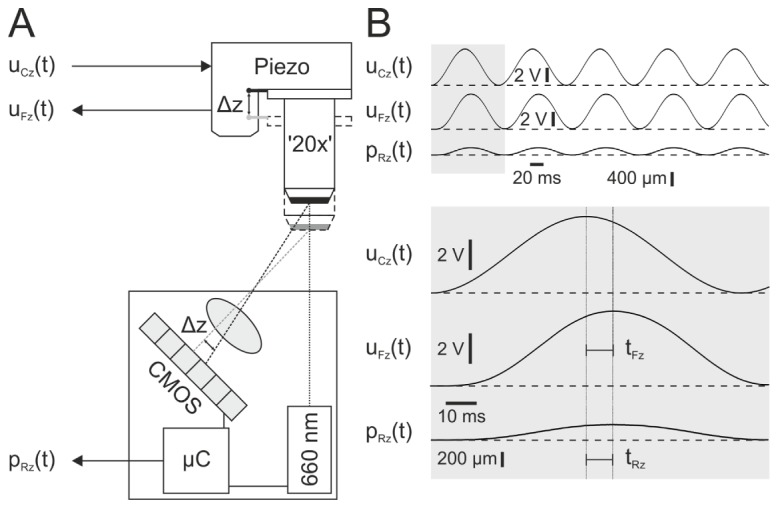
Principle of measuring axial positioning accuracy. (A) Experimental arrangement. Absolute position of objective dummy ’20x’ is simultaneously measured via capacitive piezo actuator feedback signal uFz(t) and laser triangulation pRz(t). Dummy position at a specific time point depends on applied command voltage uCz(t). ∆z – dummy elongation induced by the applied command voltage. CMOS – Complementary metal-oxide-semiconductor (resolution: 0.1 µm). µC – Microcontroller. (B) Exemplified measurement. Top: Traces of uCz(t), uFz(t) and pRz(t). Gray box is scaled up and displayed below. Note significant time lag between command and position signals (tFz and tRz). Dashed lines indicate base line levels (0 V).
2.4. Position signal correlation
For each axis separately, we analyzed phase shifts between internal feedback signals (uFj) and corresponding reference signals (pRj) to the applied command signals (uCj). j is a placeholder for x, y or z representing each axis. Over an interval of 10 periods, the time dependent sinusoidal command signal uCj(t) with an angular velocity of ω, was normalized to sCj(t) (range of sCj: −1 to 1):
| (1) |
tLag is a placeholder for: 1) Lag between reference and command signals tRj and 2) Lag between feedback and command signals tFj. Normalized command signals sCj(t) were phase shifted by , where tLag is a discrete time interval of 1 µs and a variable to test different phase shifts (range of : 0 – 12000, ):
| (2) |
tLag was quantized, because the resolution of the acquired signals was limited to 1 µs. Subsequently, sCj was subtracted from the respective amplitude-normalized feedback (sFj, range: −1 to 1) or reference position signal (sRj, range: −1 to 1). For different phase shifts , the sum square error (SSE) of the differences was calculated (N: number of samples during 10 periods, ):
| (3) |
The local minimum of , where and was considered to represent the inherent time lag of the respective position signal to the command signal. Thus, a difference between the inherent time lag of the reference signal and the inherent time lag of the corresponding internal feedback signal represents a time lag between the nominal real-time scan point position and its representation in the feedback signal.
In a next step and for each axis separately, time lag corrected feedback signals were calibrated to corresponding reference positions. Assuming minimal positioning error in response to low frequency triangular command signals, 1 Hz for lateral and 0.02 Hz for axial measurements respectively, the feedback signal uFj was linearly fitted to the corresponding reference position pRj as:
| (4) |
where represents the index of an acquired position pair () and , represent the fit parameters (intercept , slope ). The deviation dj(i) in µm of each feedback position compared to a reference position was then calculated as:
| (5) |
In order to reduce laser speckle noise, position signals of z-axis were smoothed by a moving average filter (window size: 250 samples). Subsequently, axial deviations were calculated as average of 50 consecutive periods of one scan trial. In order to minimize the impact of slow mechanical drift (e.g. of the stage micrometer or the triangulation sensor), each intercept was repeatedly determined and corrected.
Data were analyzed offline using ImageJ 1.47d (http://rsbweb.nih.gov/ij/, NIH, Bethesda, MD, USA), PClamp 10.2 (Molecular Devices, Sunnyvale, CA, USA), Microsoft Excel 2003/2010 (Microsoft, Redmond, WA, USA), OriginPro 8G (OriginLab, Northampton, MA, USA) and custom-made software written in LabVIEW 2010 SP1. P values <0.05 were considered statistically significant. Unless otherwise stated, all results are presented as mean ± standard deviation (SD).
3. Results
3.1. Fluorescent beads embedded in agarose
In a first step, we assessed positioning instability by means of fluorescent beads (10 µm diameter) embedded in agarose, as a frequently used test object in laser scanning microscopy. To this end, we performed three-dimensional line-scanning along a spiral trajectory (500 × 500 × 200 µm3, 10 Hz) and analyzed the changes in length of bead intersections over a period of 10 minutes (Fig. 3). Whereas most intersections displayed no change in length, some of them indicated position deviations due to a detectable change in length over time (Fig. 3(B), examples 1 – 4 versus 5). During the first two minutes these changes ranged from –2.5 µm to + 1.8 µm (0.48 µm SD). In addition, the SD of the change in intersection length clearly increased over time (Spearman’s rho = 0.99, n = 120 time intervals, Fig. 3(C)), indicating an increase in positioning inaccuracy. A limitation of this approach lies in the fact that a change (or lack of change) in intersection length is not uniquely related to a positional deviation in three-dimensional space. Hence, vectors of deviations cannot be obtained by this type of measurement. In the following, we introduce alternative methods which enable a quantification of absolute positioning accuracy for each spatial axis separately.
Fig. 3.
Change of bead intersection length as a measure of three-dimensional scan instability. (A) Three-dimensional projection of z-stack data (maximum intensity projections of z-stack intensities in XY, XZ and YZ plane) and spiral scan trajectory (white dashed line). Positions of intersected fluorescent beads, shown in B, are indicated by numbers (1 – 5). Cube dimensions: 500 × 500 × 200 µm3 (XYZ). (B) Examples of bead intensity profiles at different positions in spiral trajectory, scanned over 10 minutes. 10 pixels ≙ 10 µm. (C) Change of intersection length plotted versus time. The dotted line indicates no detected change. Note that no change in length not necessarily indicates position stability as the intersection of a sphere (bead) is not defined uniquely.
3.2. Hardware time lag
A positioning process involves a time-dependent response to a requested position. Due to mass inertia and signal processing two types of time lag need to be considered: 1) command versus position (reference) signal tRj and 2) command versus position feedback signal tFj. Hence, it is essential to quantify potential hardware lags for each axis prior to correlating feedback signals with reference positions. Time lag between x-axis command signal and reference signal was 77.5 ± 0.8 µs (n = 11 scan trials, Fig. 4(A)). The y-axis showed a significantly higher time lag, probably due to higher rotor inertia (79.5 ± 0.5 µs, Mann-Whitney U test: tRx – tRy, P < 0.001, n = 11 scan trials). For both axes, the lag of feedback signals was significantly higher, indicating that the feedback circuits introduce an additional delay (tFx: 83.2 ± 1.2 µs, tFy: 85.4 ± 0.8 µs, Wilcoxon signed rank tests: tRx – tFx and tRy – tFy, P < 0.001, n = 11 scan trials). The resulting difference between feedback and reference lag was similar for both axes (x-axis: 5.7 ± 0.5 µs, y-axis: 5.9 ± 0.5 µs, Mann-Whitney U test, P > 0.05, n = 11 scan trials).
Fig. 4.
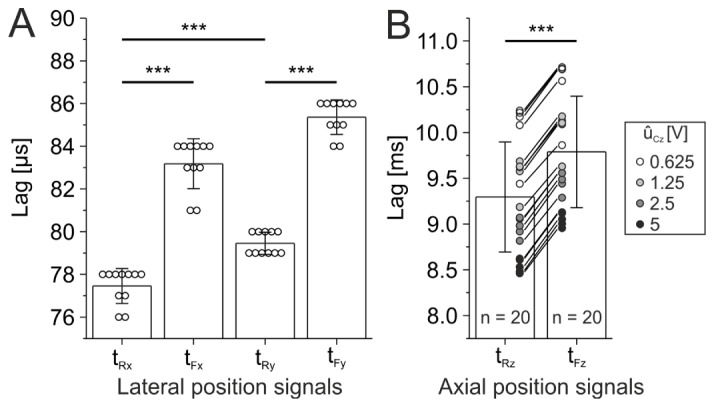
Hardware time lag of measured position signals (tRx – x-axis reference, tFx – x-axis feedback, tRy – y-axis reference, tFy – y-axis feedback, tRz – z-axis reference, tFz – z-axis feedback) compared to command signals. (A) Lateral measurements. Data are pooled from sinusoidal movements (amplitude range: 62 – 248 µm, frequency range: 1 – 2000 Hz). x- and y-axis display different lag characteristics (Mann-Whitney U test: tRx – tRy, P < 0.001, n = 11 scan trials). Note additional constant lag between feedback and reference measurements (Wilcoxon signed rank tests: tRx – tFx and tRy – tFy, P < 0.001, n = 11 scan trials). (B) Axial measurements. Data is pooled from sinusoidal movements (command signal amplitude ûCz: 0.625 – 5 V, frequency: 1 – 20 Hz). Note additional constant lag between feedback and reference measurements (two-sided students t-Test: tRz – tFz, P < 0.001, n = 20 scan trials). Each symbol represents lag derived from a single scan trial. *** P < 0.001.
The time lag between the axial command signal and reference signal was two orders of magnitude higher compared to x- and y-axis (tRz: 9.3 ± 0.6 ms, n = 20 trials, Fig. 4(B)). In addition, higher amplitudes of the command signal (ûCz) tended to result into a smaller time lag (Fig. 4(B)). Analog to the lateral axes, feedback signal displayed an additional lag component (tFz: 9.8 ± 0.6 ms, difference tFz – tRz: 0.5 ± 0.0 ms, n = 20).
3.3. Position calibration
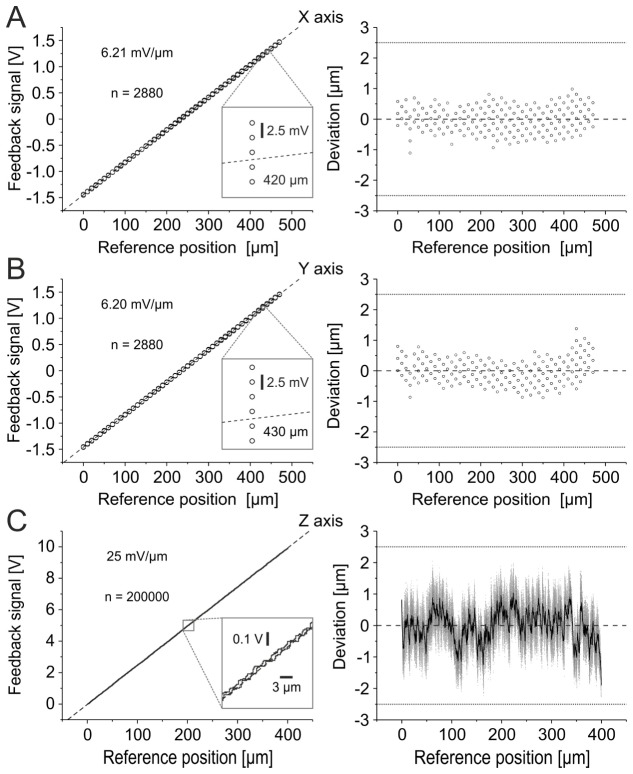
The position deviation of a feedback position was determined by subtracting each reference position from its corresponding, time-lag corrected feedback position. For this purpose, feedback positions were scaled into micrometer using the calculated values of linear fit functions (Fig. 5). We calibrated feedback signals to absolute reference positions using slow full-field triangular command signals (x and y axis: 1 Hz, z axis: 0.02 Hz). We found a linear relation between feedback and reference signals for all three axes, respectively (x-axis: uFx = 6.21∙10−3 V/µm ∙ pRx −1.45 V, y-axis: uFy = 6.20∙10−3 V/µm ∙ pRy −1.46 V, z-axis: uFz = 2.5∙10−2 V/µm ∙ pRz −2.1∙10−2 V, Fig. 5). Based on these linear fits, none of the measured positions displayed deviations greater then ±2.5 µm (range x-axis: −1.11 µm to + 0.98 µm, range y-axis: −0.88 µm to + 1.38 µm, range z-axis: −2.26 µm to + 2.05 µm).
Fig. 5.
Position feedback calibration. Left: Calibration of feedback signals to reference positions (linear fit). Dashed lines indicate ideal fit. Insets: Magnification. Right: Deviations of feedback signals to reference position on the basis of linear fitted values. Dashed lines indicate zero deviation. Dotted lines indicate deviation threshold of ±2.5 µm. (A), (B) Discrete lateral position calibration (A: x-axis, B: y-axis). Each symbol represents a single analyzed discrete tick mark position. Note that data points are overlapping. (C) Continuous axial position calibration (z-axis). Right: Gray points represent single data points. Black curve represents moving average of data points (window size: 250 samples).
3.4. Lateral positioning accuracy
In order to determine the accuracy of the lateral feedback signals, scan trajectories of different type (triangular, saw-tooth, undamped and damped sinusoidal shape), amplitude (0.5 – 2 V, calibrated: 62 – 248 µm, Figs. 5(A), 5(B)) and frequency (1 – 2000 Hz) were tested. Position deviations of each 30 scan periods were calculated for x-axis (Fig. 6) and y-axis (Fig. 7).
Fig. 6.
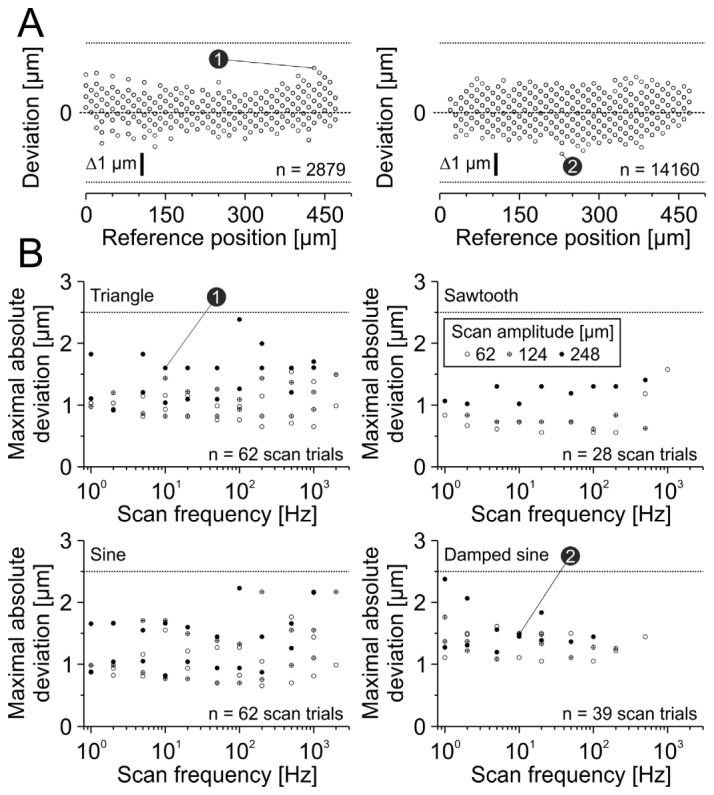
Positioning accuracy of x-axis scan pattern is smaller than ±2.5 µm. (A) Examples of two different scan trials. Left: Triangular scan, 248 µm scan amplitude, 10 Hz scan frequency. Right: Damped sinusoidal scan, 248 µm scan amplitude, 10 Hz scan frequency. Note that the maximal absolute deviation of each scan trial was used for the threshold criteria in B (indicators 1 and 2). Dashed lines indicate zero deviation. Each symbol represents one analyzed discrete position. (B) Summarized results for each scan type. Each symbol represents maximal absolute deviation of a single scan trial. Numbers 1 and 2 represent examples from A. Note that data points are overlapping. Dotted lines indicate deviation threshold of ±2.5 µm.
Fig. 7.
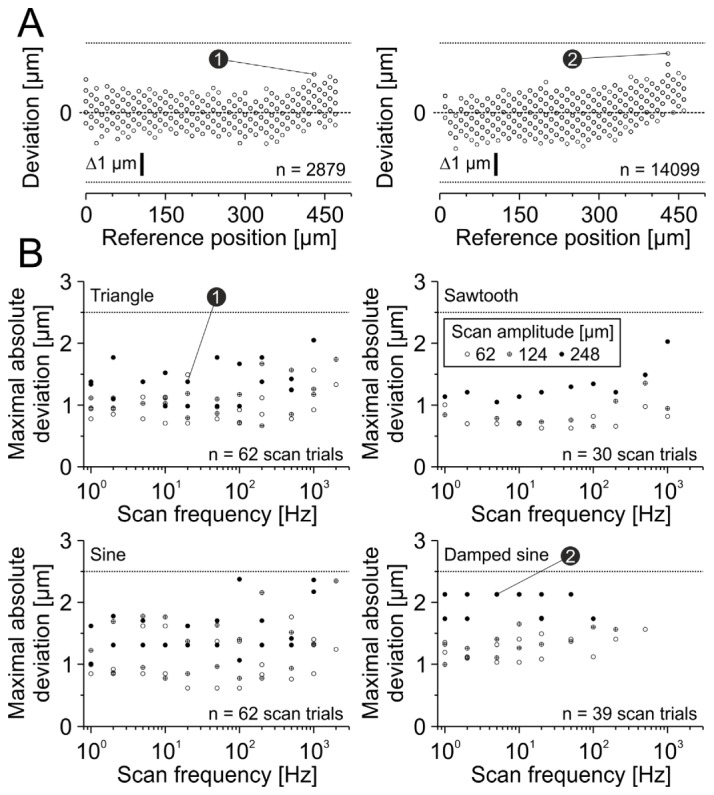
Positioning accuracy of y-axis scan pattern is smaller than ±2.5 µm. (A) Examples of two different scan trials. Left: Triangular scan, 248 µm scan amplitude, 20 Hz scan frequency. Right: Damped sinusoidal scan, 248 µm scan amplitude, 5 Hz scan frequency. Note that the maximal absolute deviation of each scan trial was used for the threshold criteria in B (indicators 1 and 2). Dashed lines indicate zero deviation. Each symbol represents one analyzed discrete position. (B) Summarized results for each scan type. Each symbol represents maximal absolute deviation of a single scan trial. Numbers 1 and 2 represent examples from A. Note that data points are overlapping. Dotted lines indicate deviation threshold of ±2.5 µm.
All tested command signals displayed position deviations smaller than 2.5 µm for x-axis (maximal absolute deviation: 2.39 µm, n = 482346 positions of 191 scan trials, Fig. 6(B)). The 0.999-quantile of all absolute deviations was 1.60 µm, indicating that the accuracy of the vast majority of positions is higher.
In a next step we analyzed position deviations of the y-axis. All tested command signals displayed position deviations smaller than 2.5 µm (maximal absolute deviation: 2.38 µm, n = 484042 positions of 193 scan trials, Fig. 7(B)). The 0.999-quantile of all absolute deviations was 1.74 µm, indicating that the accuracy of the vast majority of positions is higher.
Taken together, the positioning accuracy of the x- and y-axis is at least ±2.5 µm for triangular, saw-tooth, undamped and damped sinusoidal scans of different scan amplitudes (62 – 248 µm) and frequencies (1 – 2000 Hz). Furthermore, hardware lag correction is essential for a high positioning accuracy.
3.5. Axial positioning accuracy
In a next step, we analyzed deviations of axial feedback positions. The main drawback of using a mechanical focussing device is its inaccuracy at high load accelerations. In the case of the used piezo actuator, the load (objective) is mounted at one side of a lever arm which is oriented perpendicularly to the optical axis. Therefore, we would expect position deviations produced by an acting torque, mainly resulting in a dynamic tilt of the load. Thus, the axial position accuracy is expected to depend on mass inertia and geometry of the load.
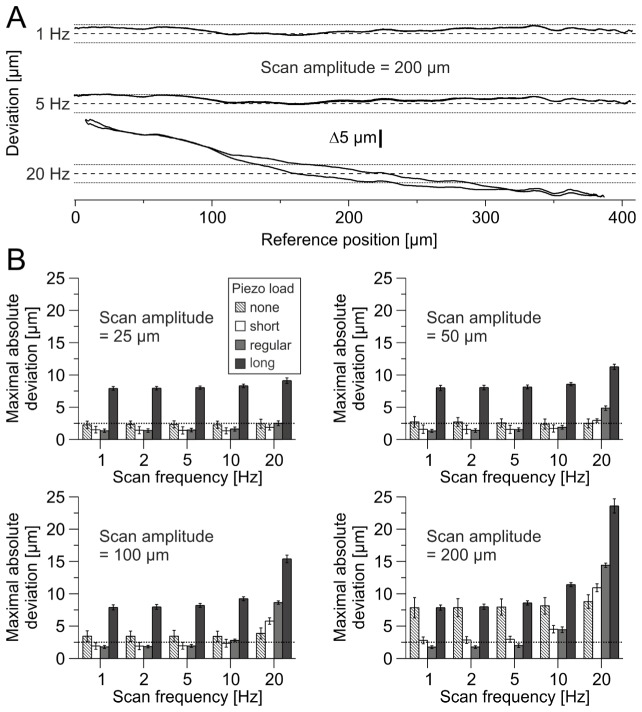
In order to minimize accelerations, spiral scanning uses sinusoidal command signals [2]. We therefore examined sinusoidal movements along the z-axis in an amplitude range of 0.625 – 5 V (calibrated: 25 – 200 µm, Fig. 5(C)) and frequency range of 1 – 20 Hz. Position deviations of 50 averaged scan periods were determined (Fig. 8). Up to 2 Hz, none of the tested scans applied to the regular objective dummy displayed deviations exceeding 2.5 µm (maximal absolute deviation: 2.21 µm, n = 156 scan trials, regular piezo load in Fig. 8(B)). By increasing amplitude and/or frequency, maximal absolute deviations increased up to 15 µm (n = 260 scan trials, regular piezo load). Additionally, a hysteresis occurs at high accelerations (scan frequency: 20 Hz, scan amplitude: 200 µm, Fig. 8(A)), indicating that the positioning depends on the actuator motion direction. These data suggest an influence of objective acceleration on axial positioning accuracy.
Fig. 8.
Axial positioning accuracy depends on scan parameters and objective properties. (A) Position deviations of three single trials at different scan frequencies, but the same scan amplitude of 200 µm sinusoidal motion using regular objective dummy. A hysteresis occurs at a scan frequency of 20 Hz, whereas at 1 Hz and 5 Hz deviations for both motion directions are similar. Dashed lines indicate zero deviation. (B) Maximal absolute deviation of four different objective dummies at different scan amplitudes and frequencies (n = 13 trials). Dotted lines indicate deviation threshold of ±2.5 µm.
Next, we repeated measurements using minimal load of piezo actuator to test the influence of objective mass. Interestingly, maximal absolute deviations were increased, except for 50 – 200 µm scan amplitude at 20 Hz (none versus regular piezo load in Fig. 8(B) and Fig. 9). These data indicate an influence of objective mass.
Fig. 9.
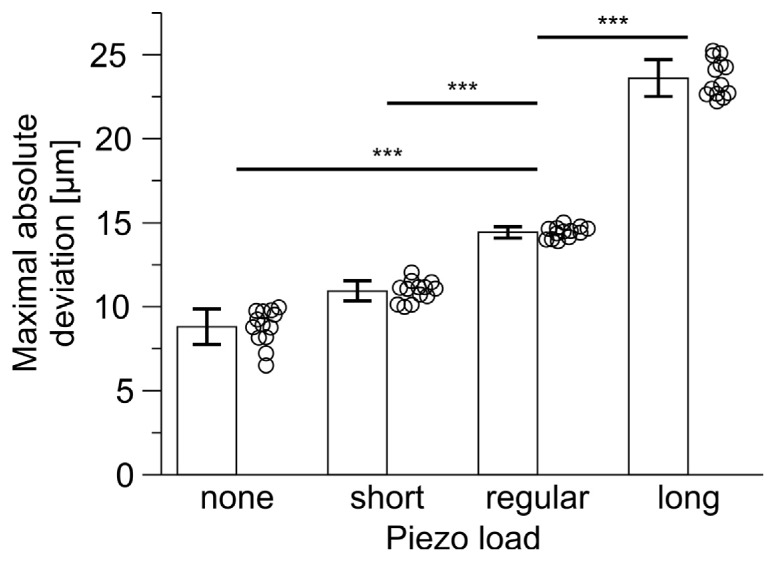
Maximal absolute deviation of all four objective dummies at 20 Hz scan frequency and 200 µm scan amplitude sinusoidal motion. Each symbol represents a single scan trial. Maximal absolute deviation is dependent on objective mass and length (ANOVA: P < 0.001, n = 13 scan trials, post hoc Bonferroni pairwise comparisons: regular – none: P < 0.001; regular – short: P < 0.001; regular – long: P < 0.001). *** P < 0.001.
In order to test the influence of the center of mass independently of mass itself, two additional objective dummies of different length, but the same mass as the regular dummy were tested (short and long dummy). Whereas the short dummy displayed comparable and reduced deviation levels (short versus regular piezo load in Fig. 8(B)), not even a single scan using the long objective dummy displayed sub-threshold maximal absolute deviations (maximal absolute deviation ≥7.22 µm, n = 260 scan trials). Comparing maximal absolute deviations of scans with highest acceleration (none: 8.8 ± 1.1 µm, short: 10.9 ± 0.6 µm, regular: 14.4 ± 0.3 µm, long: 23.6 ± 1.1 µm, amplitude: 200 µm, frequency: 20 Hz, n = 13 scan trials), short dummy produced smaller deviations whereas long dummy produced higher deviations than the regular dummy [one-way analysis of variance (ANOVA): P < 0.001, n = 13 scan trials, post hoc Bonferroni pairwise comparisons: regular – short: P < 0.001; regular – long: P < 0.001, Fig. 9].
Taken together, axial positioning accuracy of the piezo-focussing actuator is limited by objective acceleration, mass and geometry and should be determined for every objective type and scan configuration.
4. Discussion
Hitherto existing approaches using reference objects do not allow a quantification of the absolute three-dimensional focal volume position in line-scan or discontinuous-scan modes of two-photon laser scanning microscopes (2PLSM). In the present study, we validated the accuracy of lateral position feedback signals using a stage micrometer in combination with a reflection measurement approach. In addition, a laser triangulation sensor was used to quantify axial positioning accuracy. The probed 2PLSM displayed high lateral and acceleration-dependent axial positioning accuracy.
4.1. Three-dimensional fluorescent reference objects
A three-dimensional, fluorescent reference object with a biunique position pattern would be an ideal standard to validate the positioning accuracy of individual scan pattern. If sub-resolution beads (e.g.: 0.2 µm diameter) would be used as fluorescent targets, as this was frequently done for determining position dependent point spread functions [3, 5, 9, 14, 16, 18, 19], position deviations larger than the bead size could not be detected. Furthermore, if the targets are identical, their position is not biunique. To circumvent these constraints of a three-dimensional measurement, we determined the positioning accuracy for each spatial axis separately. Of note, cross-talk between the three axes cannot be detected by this strategy. Nevertheless, we identified deviations along the z-axis which also might influence the lateral positioning accuracy.
4.2. Origin of hardware lag
Time lags can occur in any positioning device, produced by sequential steps of signal transmission, processing and filtering and should be identified before further analysis. Especially using fast scans near hardware limitations, correct timing is essential, which has been demonstrated by the lag corrected analysis of the positioning accuracy of the x- and y-axis. Here, the absolute difference in time was only ~6 µs for both feedback signals, but without the correction virtual deviations from the reference positions of up to 10 µm could be observed (0.999-quartile of position deviations x-axis without lag correction: 9.86 µm, y-axis: 9.97 µm). The source of this time lag is not known, but might be related to the closed-loop circuit of the galvanometer control device or its optical position detection itself. Whereas the standard deviation of calculated lateral time lags were in the range of the sampling interval (<1 µs), it was three orders of magnitude higher for axial time lags (0.6 ms). Moreover, axial time lags were higher using smaller command signal amplitudes. The lag was in the range of 10 ms for reference and feedback signals, respectively. Each time lag represents the combination of a delayed signal transmission and the inertia dependent step response of the piezo actuator. Since one would expect higher response times for higher steps, the observed effect of the command signal amplitude cannot be explained. As both the feedback and the reference signal displayed the same dependency, a highly reliable additional delay of the feedback signal could be identified (0.5 ± 0.0 ms). This was high compared to the x- and y-axis, but is in line with the manufacturer's data, since the feedback (output) signal is low-pass filtered (1st order, passive, R = 10 kΩ, C = 10 nF) for noise reduction.
4.3. Positioning accuracy
No deviations greater than the defined threshold of ±2.5 µm of the lateral feedback signals were detected. As the resolution of the measurement is limited (see 4.4), we do not interpret putative trends below the specified deviation threshold.
Mass inertia dependent instabilities of z-axis positioning were quantified as a difference between feedback and reference signal. The capacitance-based position measurement of the piezo actuator is located close to the basis of the actuator, which could explain a possible insensitivity to distal lever arm effects. The measured deviations of the regular dummy are in line with manufacturer's specifications for a maximal dynamic tilt angle of 500 µrad at 200 µm amplitude and 20 Hz frequency using the regular objective dummy (~17 µm with a lever arm of 34 mm, Fig. 8(A)). We cannot exclude superposition of different sources of errors resulting in the observed position deviations. Interestingly, higher position deviations occurred in scans using a long or a minimal load. In this case, additional instabilities (e.g.: ringing) might be introduced. To circumvent the constraints of a one side mounted actuator, ring actuators could be used instead at the expense of reducing applicable range of axial positioning. Alternatively, non-mechanical z-axis focussing devices are available, but introduce additional aberration [8–10, 14].
In the present study we intended to validate position feedback signals by means of external references. In reality, the underlying assumption that these external references provide ground-truth data might be violated, for instance, due to the presence of slow-frequency mechanical drift of the reference itself (stage micrometer or triangulation sensor). To minimize such adverse effects, we restricted the external validations to comparatively short time intervals.
On the basis of the determined positioning accuracies, three-dimensional two-photon laser-scanning along a spiral trajectory is a valid and valuable technique for measuring neuronal network activity in vivo. However, our data revealed that for certain trajectories the achieved positioning accuracy would not suffice the requirements of somatic calcium imaging (here defined as deviations greater than ±2.5 µm). A common problem of in vivo recordings are motion artefacts, for instance, due to heart beat, respiration and gross body movements, especially when recording from lightly anesthetized or awake animals [20]. Deviations resulting from motion artefacts will add to position deviations as detailed above. Therefore, efforts should be undertaken to minimize additional drifts of the specimen (see for example [21, 22]). A commonly used approach for reducing the impact of slow mechanical drift comprises repeated manual re-alignments which typically require brief interruptions of a recording session.
4.4. Technical aspects of reflection measurement
We estimated the maximal error of the reflection measurement to be ±2.4 µm. The following errors were included: 1) ±1.1 µm (calibrated) due to analog-to-digital conversion of the feedback signal (corresponds to ± 8.8 mV of the data acquisition interface with a resolution of 2.4 mV in a range of ±5 V), 2) ±1.0 µm induced by peak detection error of the PMT signal (assuming a peak detection inaccuracy of ± 1 sample and a minimum number of samples per 10-µm tick interval of 10), 3) ±0.1 µm due to horizontal misalignment of the stage micrometer, 4) tick mark precision of ±0.2 µm.
A further constraint of the presented reflection measurement is related to the fact that only discrete positions can be analyzed. Highest accelerations occur at positions at which the galvanometer changes its motion direction. In fact, the deviations of those positions cannot be measured using the described technique because the detection of tick marks requires a minimum change in position. Hence, scans of different amplitudes and frequencies were used to scan the same reference positions at different accelerations. The fact that this technique uses a commercial stage micrometer renders it applicable to a wide range of microscopes. This may also be valid for the calibration of positioning systems without feedback signals, such as acousto-optical deflectors [14, 15].
4.5. Technical aspects of laser triangulation
The introduced method supports a contact free position measurement for 2PLSM systems using a mechanical focusing device. As laser triangulation is based on the detection of a diffuse reflection on a target, the latter should support high light scattering, while maintaining a plain surface. In our experiments we found that sandblasted brass, bronze or aluminum represents a good compromise. Therefore, the objective dummies were made of these materials and were sandblasted on the target surface (bottom). To overcome high noise levels due to laser speckle, raw data were averaged. We estimated the maximal error of the measurement to be ±2.3 µm. The following errors were included: 1) ±0.4 µm (calibrated) due to analog-to-digital conversion of the feedback signal (corresponds to ±9.0 mV of the data acquisition interface with a resolution of 4.9 mV in a range of ± 10 V, taking noise reduction via averaging into account), 2) ±1.8 µm (calibrated) due to analog-to-digital conversion of the reference signal (corresponds to ±9.0 mV of the data acquisition interface with a resolution of 4.9 mV in a range of ±10 V, taking noise reduction via averaging into account), 3) resolution limit of the triangulation device of ±0.1 µm.
4.6. Applicability of the method
The proposed method for quantification of lateral positioning accuracy is mainly applicable to line-scanning approaches that lack regular image formation (e.g. spiral or arbitrary line-scanning). In contrast, for morphological investigations, laser-scanning microscopy typically follows a raster-scanning approach producing two-dimensional images. In this case, analysis of position feedback signals is largely dispensable since absolute position information can be derived from imaging of two-dimensional fluorescent or reflective stage micrometers used as external references. Therefore, in the case of raster-scanning, position information can be directly obtained on the basis of the PMT signal which, in the present study, was used to calibrate position feedback signals. The precision of quantification depends on several parameters including: 1) sampling bandwidth and frequency of the PMT signal, 2) sampling frequency and bit depth of analog-to-digital conversion of the position feedback signal, 3) width of tick marks (preferably below the optical resolution of the microscope) and 4) tick mark distance (determining the number of discrete positions that can be analyzed).
The proposed method for quantification of axial positioning accuracy is supposed to be applicable to microscopes which employ mechanical objective movements for focusing. Accordingly, the method may also be useful for three-dimensional imaging techniques combining x-y raster-scanning with z-movements of the objective (e.g. z-stack, tilted-frame scanning [23]). In our analyses, the main component of the measurement error is related to the bit depth of the analog-to-digital conversion (12-bit) of the feedback and reference signal, respectively (see above). Hence, a major reduction of the maximum error may be achieved by using an analog-to-digital converter with a higher bit depth (e.g. 16 or 32 bit) which renders the method suitable for applications that require higher spatial precision. In addition, speckle noise could be further reduced by averaging, if high temporal resolution is not a requirement of the application.
4.7. Important practical aspects for assessing positioning accuracy
When establishing the proposed method for quantification of lateral and axial positioning accuracy, special attention should be paid to the following critical steps: 1) Selection of an adequate stage micrometer, triangulation sensor and triangulation target (we recommend an objective dummy with a plain, but scattering target area); 2) Proper alignment of the stage micrometer (i.e. parallel to the axis examined) and triangulation sensor (i.e. along the axis of objective motion) – a micromanipulator in combination with a pitch and yaw platform should provide sufficient flexibility and stability; 3) Determination of hardware lags (note that time lags may depend on scan amplitude and should therefore be tested for the respective scan configuration); 4) Calibration of position feedback signals from galvanometer-mirrors and the piezo actuator (slow scans with low accelerations should be used); 5) Measurement of positioning accuracy of the desired scan configuration by correlating position feedback signals to reference signals.
4.8. Concluding remarks
We showed that axial positioning accuracy depends on objective acceleration, mass and geometry. This may limit not only the volume of interest, but also restricts the applicability of certain types of objectives. Care should be taken when using scan trajectories with positioning deviations along the z-axis beyond the tolerable threshold, as tilt of the lever arm also influences the lateral position. This effect is neither detectable by the feedback signals of the galvanometric scan mirrors nor can it be calibrated by the demonstrated laser triangulation. Therefore, only scan trajectories with sub-threshold axial deviations should be used in three-dimensional scanning.
Acknowledgments
This work was supported by the Priority Program 1665 (HO 2156/3-1 to K.H., KI 1816/1-1 to K.K.), the Collaborative Research Center/Transregio 166 (HO 2156/4-1 to K.H., KI 1816/2-1 to K.K.) and the Research Unit 1738 of the German Research Foundation (WI 830/10-2 to O.W.W. and K.H.), the Bernstein Focus (01GQ0923 to K.H., O.W.W.), the Gerontosys JenAge (031 5581B to O.W.W.), and the Irestra (16SV7209 to O.W.W.) of the Federal Ministry of Education and Research, the EU BrainAge (FP 7/HEALTH.2011.2.22-2: 2798219 to O.W.W.) and the Interdisciplinary Centre for Clinical Research Jena (K.K., K.H.).
References and links
- 1.Denk W., Strickler J. H., Webb W. W., “Two-photon laser scanning fluorescence microscopy,” Science 248(4951), 73–76 (1990). 10.1126/science.2321027 [DOI] [PubMed] [Google Scholar]
- 2.Göbel W., Kampa B. M., Helmchen F., “Imaging cellular network dynamics in three dimensions using fast 3D laser scanning,” Nat. Methods 4(1), 73–79 (2007). 10.1038/nmeth989 [DOI] [PubMed] [Google Scholar]
- 3.Duemani Reddy G., Kelleher K., Fink R., Saggau P., “Three-dimensional random access multiphoton microscopy for functional imaging of neuronal activity,” Nat. Neurosci. 11(6), 713–720 (2008). 10.1038/nn.2116 [DOI] [PMC free article] [PubMed] [Google Scholar]
- 4.Lillis K. P., Eng A., White J. A., Mertz J., “Two-photon imaging of spatially extended neuronal network dynamics with high temporal resolution,” J. Neurosci. Methods 172(2), 178–184 (2008). 10.1016/j.jneumeth.2008.04.024 [DOI] [PMC free article] [PubMed] [Google Scholar]
- 5.Grewe B. F., Langer D., Kasper H., Kampa B. M., Helmchen F., “High-speed in vivo calcium imaging reveals neuronal network activity with near-millisecond precision,” Nat. Methods 7(5), 399–405 (2010). 10.1038/nmeth.1453 [DOI] [PubMed] [Google Scholar]
- 6.Cheng A., Gonçalves J. T., Golshani P., Arisaka K., Portera-Cailliau C., “Simultaneous two-photon calcium imaging at different depths with spatiotemporal multiplexing,” Nat. Methods 8(2), 139–142 (2011). 10.1038/nmeth.1552 [DOI] [PMC free article] [PubMed] [Google Scholar]
- 7.Katona G., Kaszás A., Turi G. F., Hájos N., Tamás G., Vizi E. S., Rózsa B., “Roller Coaster Scanning reveals spontaneous triggering of dendritic spikes in CA1 interneurons,” Proc. Natl. Acad. Sci. U.S.A. 108(5), 2148–2153 (2011). 10.1073/pnas.1009270108 [DOI] [PMC free article] [PubMed] [Google Scholar]
- 8.Grewe B. F., Voigt F. F., van ’t Hoff M., Helmchen F., “Fast two-layer two-photon imaging of neuronal cell populations using an electrically tunable lens,” Biomed. Opt. Express 2(7), 2035–2046 (2011). 10.1364/BOE.2.002035 [DOI] [PMC free article] [PubMed] [Google Scholar]
- 9.Dal Maschio M., De Stasi A. M., Benfenati F., Fellin T., “Three-dimensional in vivo scanning microscopy with inertia-free focus control,” Opt. Lett. 36(17), 3503–3505 (2011). 10.1364/OL.36.003503 [DOI] [PubMed] [Google Scholar]
- 10.Botcherby E. J., Smith C. W., Kohl M. M., Débarre D., Booth M. J., Juškaitis R., Paulsen O., Wilson T., “Aberration-free three-dimensional multiphoton imaging of neuronal activity at kHz rates,” Proc. Natl. Acad. Sci. U.S.A. 109(8), 2919–2924 (2012). 10.1073/pnas.1111662109 [DOI] [PMC free article] [PubMed] [Google Scholar]
- 11.Ducros M., Houssen Y., Bradley J., de Sars V., Charpak S., “Encoded multisite two-photon microscopy,” Proc. Natl. Acad. Sci. U.S.A. 110(32), 13138–13143 (2013). 10.1073/pnas.1307818110 [DOI] [PMC free article] [PubMed] [Google Scholar]
- 12.Quirin S., Jackson J., Peterka D. S., Yuste R., “Simultaneous imaging of neural activity in three dimensions,” Front. Neural Circuits 8(29), 29 (2014). [DOI] [PMC free article] [PubMed] [Google Scholar]
- 13.Bovetti S., Moretti C., Fellin T., “Mapping brain circuit function in vivo using two-photon fluorescence microscopy,” Microsc. Res. Tech. 77(7), 492–501 (2014). 10.1002/jemt.22342 [DOI] [PubMed] [Google Scholar]
- 14.Katona G., Szalay G., Maák P., Kaszás A., Veress M., Hillier D., Chiovini B., Vizi E. S., Roska B., Rózsa B., “Fast two-photon in vivo imaging with three-dimensional random-access scanning in large tissue volumes,” Nat. Methods 9(2), 201–208 (2012). 10.1038/nmeth.1851 [DOI] [PubMed] [Google Scholar]
- 15.Fernández-Alfonso T., Nadella K. M., Iacaruso M. F., Pichler B., Roš H., Kirkby P. A., Silver R. A., “Monitoring synaptic and neuronal activity in 3D with synthetic and genetic indicators using a compact acousto-optic lens two-photon microscope,” J. Neurosci. Methods 222, 69–81 (2014). 10.1016/j.jneumeth.2013.10.021 [DOI] [PMC free article] [PubMed] [Google Scholar]
- 16.Cotton R. J., Froudarakis E., Storer P., Saggau P., Tolias A. S., “Three-dimensional mapping of microcircuit correlation structure,” Front. Neural Circuits 7(151), 151 (2013). [DOI] [PMC free article] [PubMed] [Google Scholar]
- 17.Kampa B. M., Roth M. M., Göbel W., Helmchen F., “Representation of visual scenes by local neuronal populations in layer 2/3 of mouse visual cortex,” Front. Neural Circuits 5(18), 18 (2011). [DOI] [PMC free article] [PubMed] [Google Scholar]
- 18.Kirkby P. A., Srinivas Nadella K. M., Silver R. A., “A compact acousto-optic lens for 2D and 3D femtosecond based 2-photon microscopy,” Opt. Express 18(13), 13720–13745 (2010). 10.1364/OE.18.013720 [DOI] [PMC free article] [PubMed] [Google Scholar]
- 19.Diaspro A., Chirico G., Collini M., “Two-photon fluorescence excitation and related techniques in biological microscopy,” Q. Rev. Biophys. 38(2), 97–166 (2005). 10.1017/S0033583505004129 [DOI] [PubMed] [Google Scholar]
- 20.Kirmse K., Kummer M., Kovalchuk Y., Witte O. W., Garaschuk O., Holthoff K., “GABA depolarizes immature neurons and inhibits network activity in the neonatal neocortex in vivo,” Nat. Commun. 6, 7750 (2015). 10.1038/ncomms8750 [DOI] [PubMed] [Google Scholar]
- 21.Paukert M., Bergles D. E., “Reduction of motion artifacts during in vivo two-photon imaging of brain through heartbeat triggered scanning,” J. Physiol. 590(13), 2955–2963 (2012). 10.1113/jphysiol.2012.228114 [DOI] [PMC free article] [PubMed] [Google Scholar]
- 22.Chen J. L., Pfäffli O. A., Voigt F. F., Margolis D. J., Helmchen F., “Online correction of licking-induced brain motion during two-photon imaging with a tunable lens,” J. Physiol. 591(19), 4689–4698 (2013). 10.1113/jphysiol.2013.259804 [DOI] [PMC free article] [PubMed] [Google Scholar]
- 23.Kerlin A. M., Andermann M. L., Berezovskii V. K., Reid R. C., “Broadly tuned response properties of diverse inhibitory neuron subtypes in mouse visual cortex,” Neuron 67(5), 858–871 (2010). 10.1016/j.neuron.2010.08.002 [DOI] [PMC free article] [PubMed] [Google Scholar]


