Abstract
Light propagation models often simplify the interface between the optical fiber probe tip and tissue to a laterally uniform boundary with mismatched refractive indices. Such simplification neglects the precise optical properties of the commonly used probe tip materials, e.g. stainless steel or black epoxy. In this paper, we investigate the limitations of the laterally uniform probe-tissue interface in Monte Carlo simulations of diffuse reflectance. In comparison to a realistic probe-tissue interface that accounts for the layout and properties of the probe tip materials, the simplified laterally uniform interface is shown to introduce significant errors into the simulated diffuse reflectance.
OCIS codes: (060.2370) Fiber optics sensors, (170.3660) Light propagation in tissues, (170.7050) Turbid media
1. Introduction
Throughout the years, numerous applications of diffuse reflectance (DR) spectroscopy have demonstrated the usefulness of the method for non-invasive study, characterization, and analysis of various biological tissues. DR spectroscopy has been used as a diagnostic tool in a wide range of organs such as bladder [1], brain [2,3], breast [4,5], cervix [6], colon [7,8], esophagus [9,10], ovaries [11], pancreas [12,13], and skin [14,15]. In addition, the acquired DR spectra along with different light propagation models have enabled quantification of tissue optical properties (i.e., absorption and scattering properties) [7,16–19].
Among the many different measurement setups, optical fiber probes are frequently used for collecting the sample DR spectrum. The main advantage of optical fiber probes lies in the flexible configuration that enables measurements for a number of different samples and simple integration into endoscopic and surgical tools. Generally, the optical fiber probes consist of one or more source and detector fibers that come in a variety of fiber geometries, each designed for a specific application. Common geometries include linear fiber arrays [2,20], tightly packed source fibers around a single central detector fiber (e.g. six-around-one geometry [7,21,22]) and other customized geometries [23–25]. Optical fiber probes are commonly manufactured by arranging fibers in the desired source-detector layout and mounting them in a stainless steel tubing or in a black epoxy cylinder [26] that make the optical fiber probes resistant to disinfection between uses.
Measured DR spectra can be used to assess the optical properties of different tissues by utilizing a light propagation model. Monte Carlo (MC) method, which is regarded as the gold standard in the biomedical community, is often used to model the DR spectra as it offers accurate description of the light propagation for an arbitrary tissue geometry and experimental setup. However, due to the stochastic nature of MC the modeling is time consuming. Therefore, the structure and geometry of the tissue and optical fiber probes are frequently described by employing substantial simplifications. The optical fiber probe-tissue interface is often approximated by a laterally uniform boundary with mismatched refractive indices [27–30]. Even though the laterally uniform interface approximation might be valid in some cases, in general, it could lead to significant errors in the MC simulated DR spectra. The importance of a more detailed description of the probe-tissue interface was first acknowledged by Bevilacqua et al. and Cappon et al. [2,31]. Both authors have analyzed the probe edge boundary effect and noticed significant deviations of the simulated DR spectra from the spectra predicted by the laterally uniform probe-tissue interface approximation. The deviations were most significant when the optical fibers were located near the edge of the optical fiber probe tubing. Although the probe edge boundary effects have been investigated, there has not yet been a study on how the different materials at the optical fiber probe tip (i.e., stainless steel or black epoxy) and optical fiber arrangement affect the simulated DR spectra. Moreover, a question arises whether the inner part of the probe tip can be adequately described by a uniform layer or is a more detailed description of the probe tip required. The recent advancements in the computational power of graphics processing units (GPUs) have provided the means to explore more realistic optical fiber probe tip geometries in terms of MC simulations and compare them to their commonly used simplified counterparts.
In this study, we compare the MC simulated DR values obtained by the laterally uniform probe-tissue interface (PTI) approximation and the realistic PTI description that takes into account the fiber layout, the materials within the optical fiber probe tip and their interactions with the light. Two common optical fiber probe geometries are studied, namely a linear and a six-around-one. The DR values were calculated and assessed across the biologically relevant range of optical properties. In addition, we study the errors introduced by the laterally uniform PTI-based inverse MC model for extraction of optical properties from a set of synthetic biological DR spectra simulated by the realistic PTI-based forward MC model. Lastly, we provide experimental evidence showing that the over-simplified laterally uniform PTI description can introduce significant errors into the calibration of MC models.
2. Materials and methods
2.1 Monte Carlo (MC) simulations
Diffuse reflectance values were simulated by a modified version of the MC for multi-layered tissues (MCML [32],) implemented on a GPU [33]. The existing GPU-based MC implementation was modified to account for the specific characteristics of the optical fibers (the numerical aperture NA and radius), the geometry of the fiber assembly (e.g., the fiber-fiber distance and placement) and the characteristics of the probe tip (i.e., specular reflections from the stainless steel and/or light interaction with black epoxy).
Photon packets were launched uniformly over the source fiber opening and uniformly over the solid angle defined by the numerical aperture of the fiber. For an arbitrary optical fiber of radius r centered at (x0, y0), the photon packets were launched at coordinates
| (1) |
Here ξ1 and ξ2 denote uniform random numbers drawn from the interval [0.0, 1.0]. Each photon packet was launched into the tissue following the direction of a unit vector
| (2) |
where cos(θA) = 1 – ξ4 (1 – cos(arcsin(NA/nm))). The corresponding sin(θA) can be calculated from cos(θA). Here we denoted ξ3 and ξ4 as uniform random numbers drawn from the interval [0.0, 1.0], NA as the numerical aperture of the source fiber and nm as the refractive index of the tissue. A schematic illustration of the photon packet launching is presented in Fig. 1.
Fig. 1.
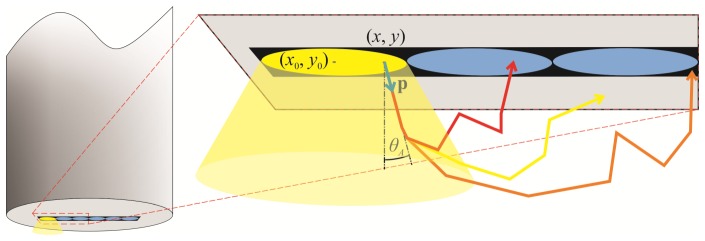
An example of a realistic stainless steel probe-tissue interface with a photon packet propagation schematic. Photon packet is launched from the point (x, y) in the direction of the unit vector p (blue arrow). The photon packet then propagates through the medium and can afterwards hit the detector fiber (red arrow), stainless steel (yellow arrow) or black epoxy (orange arrow).
A single MC simulation included 109 photon packets launched at the probe-tissue interface (PTI). The tissue was taken as a semi-infinite homogeneous layer with known absorption coefficient (µa), scattering coefficient (µs) and anisotropy factor (g), which defines the Henyey-Greenstein phase function. The tissue scattering properties are usually described by the reduced scattering coefficient µs' = µs (1 – g), that can be derived from the scattering coefficient and the anisotropy factor. The range of optical properties used in this study was selected to reflect the range observed in biological tissues within the visible spectral range [34]. The absorption coefficient µa varied from 0 cm−1 to 25 cm−1 in 35 uniform steps, the reduced scattering coefficient µs' varied from 10 cm−1 to 100 cm−1 in 35 uniform steps, and g was set to 0.8. In this way, the 2D maps of DR values as a function of the absorption and reduced scattering coefficients could be obtained.
Once the photon packet has propagated through the semi-infinite layer and hit the PTI (Fig. 1), depending on the arrangement of optical fibers and details of the interface description, several decisions were made. If the photon packet hit the interface within any of the optical fibers, the photon packet was either reflected or transmitted in accordance with the Fresnel equations and refractive indices of the optical fiber nfib and tissue nm. The weight of the transmitted photon packet was added to the fiber, if the exit direction was within the cone of acceptance defined by the NA. In the case of a realistic PTI, a photon packet that hit the stainless steel interface was either reflected or absorbed. The incident photon packet was reflected from the stainless steel interface, if a uniform random number drawn from the interval [0.0, 1.0] was smaller or equal to the stainless steel reflectivity Rsteel. Otherwise, the photon packet was absorbed. A photon packet that hit the black epoxy interface was either reflected or transmitted in accordance with the Fresnel equations and refractive indices of the black epoxy nepox and tissue nm. The transmitted photon packets were terminated due to absorption in the black epoxy. In contrast, the laterally uniform PTI assumed a boundary with mismatched refractive indices nfib and nm.
In order to speed up the simulations, we found that for the range of optical properties used in this paper it was sufficient to propagate the photon packets up to a radius of 0.5 cm and up to a depth of 0.8 cm. Beyond these limits, the photon packets were terminated as their contribution to the acquired reflectance data was negligible.
2.2 Optical fiber probes
The optical fiber probe geometries used in this study were selected based on their frequent use in the literature [2,7,20–22] and are depicted in Fig. 2. The purpose of this study is not to cover the entire range of available optical fiber probe geometries, but rather to stress the importance of considering a more detailed description of the PTI in the MC simulations. In the conducted experiments, all the optical fibers had a diameter of 200 µm with the closest possible fiber-fiber distance of 220 µm. The refractive index of the optical fibers was set to nfib = 1.452 [29] and the refractive index of the black epoxy was set to nepox = 1.6 (EpoTek 353ND Black, Epoxy Technology Inc., MA, USA). The reflectivity of several polished stainless steel probe tips was measured by observing the attenuation of a reflected diode laser beam (670 nm) (Newport Optical Power Meter 1936-C and Thermopile Sensor 818P-001-12). The obtained average reflectivity Rsteel = 0.43 was used throughout the MC simulations unless specified otherwise.
Fig. 2.

Different realistic probe-tissue interfaces used in this study. A linear fiber array stainless steel probe tip (Geometry I-s) and black epoxy probe tip (Geometry I-e). A six-around-one stainless steel probe tip (Geometry II-s) and black epoxy probe tip (Geometry II-e). The color-coded probe tip materials are listed in the legend.
As a first example, we studied a linear fiber array geometry (Fig. 2), with one of the fibers serving as a source and one as a detector. The geometry included six fibers, which provided the means to assess the DR for five different source-detector separations (SDS). In the case of a realistic stainless steel PTI (Geometry I-s), the tip comprised a small rectangular cutout (dimensions 220 µm × 1320 µm) accommodating the linear array of optical fibers held together by black epoxy. Depending on the diameter and arrangement of the optical fibers, the refractive index within the cutout was set to nfib or nepox. For the remaining part of the stainless steel probe tip, specular reflections were assumed according to the Rsteel. In the case of a realistic black epoxy PTI (Geometry I-e), the stainless steel was replaced by black epoxy and its corresponding refractive index nepox.
As a second example, we studied a six-around-one fiber geometry depicted in Fig. 2, where the central fiber served as a detector and the surrounding fibers as sources. Similarly to the linear fiber array probe tip, the stainless steel probe tip comprised a small circular cutout (radius 330 µm) accommodating the fibers (Geometry II-s). The refractive index within the cutout was either set to nfib or nepox, and specular reflections according to Rsteel were assumed for the remaining part of the optical fiber probe tip. Analogically to the Geometry I-e, a realistic black epoxy PTI was also investigated for the six-around-one fiber geometry (Geometry II-e).
2.3 Synthetic biological tissue diffuse reflectance spectra and inverse modeling
Synthetic biological tissue DR spectra were obtained by a realistic stainless steel PTI-based MC model. Subsequently, the synthetic DR spectra were analyzed by a laterally uniform PTI-based inverse MC model. In this way, any errors arising from fitting the laterally uniform PTI-based inverse MC model could be attributed solely to the differences between the two PTIs.
A semi-infinite medium with the optical properties of a human dermis was used as the biological tissue. The reduced scattering coefficient was modeled as [35]
| (3) |
where a is the reduced scattering coefficient at normalization wavelength of 500 nm and b the scattering power-law exponent. The absorption coefficient was assumed to be dominated by hemoglobin and therefore defined as
| (4) |
where B is the total hemoglobin volume fraction, α the hemoglobin oxygen saturation, µa,HbO the absorption coefficient of the oxygenated hemoglobin, and µa,Hb the absorption coefficient of the deoxygenated hemoglobin. The absorption coefficients were adopted according to Zijlstra et al. [36]. The phase function in the simulations was assumed to be Henyey-Greenstein and the anisotropy factor was kept constant at 0.8 over the entire spectral range. Nine DR spectra were simulated by varying the blood content B ∊ {0.5, 1.0, 1.5%} and the reduced scattering amplitude a ∊ {33, 46, 59 cm−1}. The hemoglobin oxygen saturation was set to α = 75% and the scattering power-law exponent was set to b = 1.4.
The inverse model employed in this study was based on the Monte Carlo lookup table approach proposed by Hennessy et al. [29]. The lookup table was created for the absorption coefficient from 0 cm−1 to 35 cm−1 in 45 uniform steps, the reduced scattering coefficient from 10 cm−1 to 100 cm−1 in 35 uniform steps, and anisotropy of 0.8. The inverse model consisted of parameters B, α, a, and b, which were estimated by a nonlinear least-squares method minimizing the sum of squared differences between the DR spectra from the Monte Carlo lookup table and the synthetic biological tissue DR spectra. A trust-region-reflective algorithm available in the Matlab Optimization Toolbox (The Mathworks Inc., Massachusetts, USA) was used to solve the inverse problem.
2.4 Turbid optical phantoms and measurement setup
Monte Carlo simulated DR spectra were verified by acquiring DR spectra from six turbid optical phantoms with well-defined optical properties. For this purpose, a purely scattering medium comprising water suspended polystyrene microspheres was used (diameter 0.99 μm; Polysciences Inc., Pennsylvania, USA), thereby eliminating errors that might arise from the addition of an absorber. The wavelength dependent scattering coefficient µs and Mie phase function were calculated according to the Mie theory [37] using the refractive index of bulk polystyrene [38]. The concentration of polystyrene microspheres was selected to yield the following values of the reduced scattering coefficient at 630 nm (10.2, 14.9, 21.8, 32.0, 46.9, 68.8 cm−1), see Fig. 3. The DR spectra of turbid phantoms were simulated by employing the Mie phase function. Due to the complexity of the Mie phase function, the random sampling of the scattering angle was performed by incorporating a lookup table into the MC code as done by Toublanc [39].
Fig. 3.
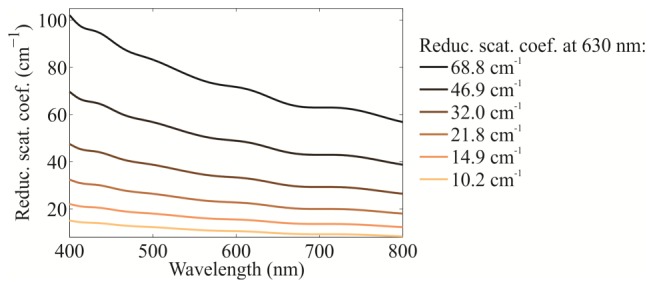
The wavelength dependence of the reduced scattering coefficient for different concentrations of the polystyrene microspheres used in the turbid phantoms.
The measurement system consisted of a broadband halogen light source (AvaLight-Hal LS, Avantes, Apeldoorn, Netherlands), a spectrometer (wavelength range from 177 to 1100 nm, AvaSpec-2048TEC-FT, Avantes) and a linear fiber array stainless steel optical probe (as depicted in Fig. 2 under Geometry I-s, FiberTech Optica Inc., Ontario, Canada). The turbid phantoms were poured into a cylindrical container with inner walls coated by a black absorbing layer that eliminated specular reflections. Fiber optic probe was completely suspended in the solution, keeping the probe tip sufficiently away from the solution surface and the cylindrical container boundaries that could affect the spectral measurements. The raw phantom spectra were recorded in the wavelength range from 400 to 800 nm and were corrected for the dark current and stray light effects. The DR spectra were obtained by dividing each corrected raw spectrum of the phantom by a corrected reference white spectrum collected from a reflectance standard (Spectralon, Avantes).
3. Results
3.1 Diffuse reflectance: Linear fiber array geometry
In this section we assessed the differences between the DR values obtained by the laterally uniform and realistic PTI for a linear fiber array geometry (Geometry I). An example of typical distributions of the simulated DR for the 220 µm SDS with different PTIs is given in Fig. 4. The differences between PTIs are more evident, if presented as a relative error
| (5) |
where Rlu and Rreal denote the MC simulated DR values obtained by adopting the laterally uniform and realistic PTI, respectively. The relative errors were calculated for the range of optical properties defined in the Subsection 2.1.
Fig. 4.

Typical distributions of the simulated diffuse reflectance for different probe-tissue interfaces (PTI) obtained at 220 µm source-detector separation.
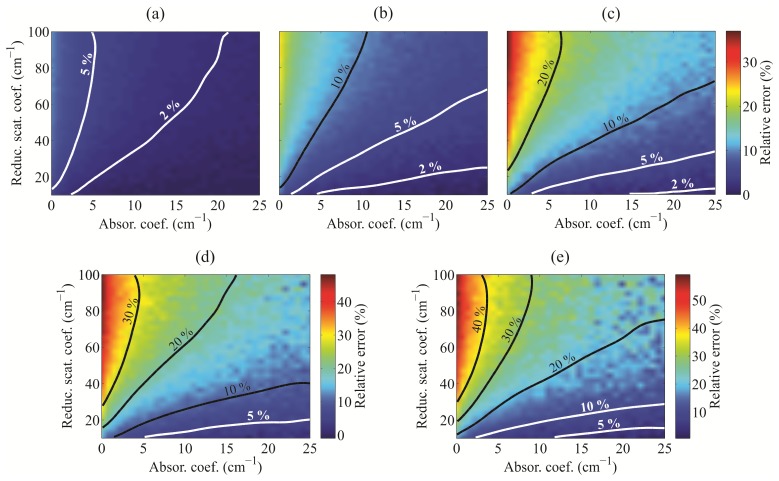
Figure 5 presents the calculated relative errors between the laterally uniform PTI and realistic stainless steel PTI (Geometry I-s). The relative error rises significantly with the SDS. In addition, the relative error is the highest for low-absorption media, where it can reach 9% even at the shortest SDS of 220 µm. The relative error is positive at all SDS, suggesting that the DR values obtained by the laterally uniform PTI are underestimated.
Fig. 5.
Relative errors between the Monte Carlo simulations of diffuse reflectance obtained for the laterally uniform and the realistic stainless steel probe-tissue interfaces (Geometry I-s) as a function of the single-layer semi-infinite medium absorption and reduced scattering coefficients. The relative errors are given for the source-detector separations of (a) 220 µm, (b) 440 µm, (c) 660 µm, (d) 880 µm and (e) 1100 µm.
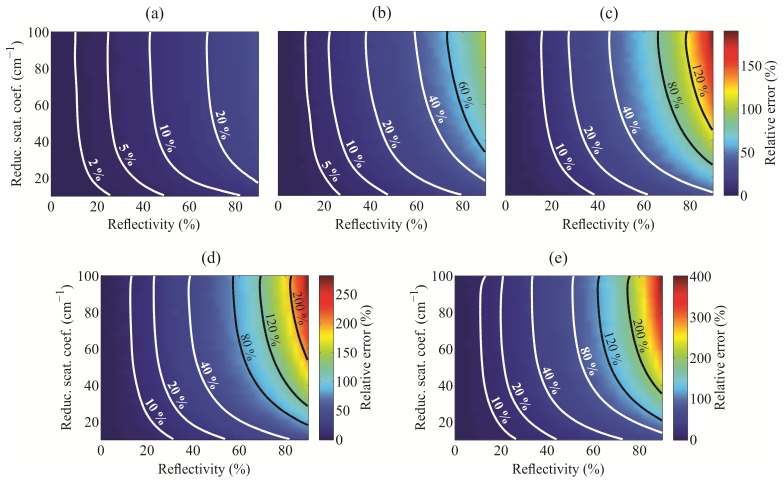
The stainless steel reflectivity Rsteel was set to 43% to match the measured values obtained for the linear fiber array stainless steel optical probe. However, the reflectivity of different probes can vary, therefore the relative errors were assessed for the reflectivity range from 0 to 90%. The calculations were performed for zero absorption coefficient, while the reduced scattering coefficient varied from 10 to 100 cm−1. The results are presented in Fig. 6. As expected, the relative error rises considerably with the stainless steel reflectivity. For a very high reflectivity and large SDS, the discrepancy between the laterally uniform and realistic PTI can easily reach 200%.
Fig. 6.
Relative errors between the Monte Carlo simulations of diffuse reflectance obtained for the laterally uniform and the realistic stainless steel probe-tissue interfaces (Geometry I-s) as a function of the stainless steel probe tip reflectivity and single-layer semi-infinite medium reduced scattering coefficient. Absorption coefficient was set to 0 cm−1. The relative errors are given for the source-detector separations of (a) 220 µm, (b) 440 µm, (c) 660 µm, (d) 880 µm and (e) 1100 µm.
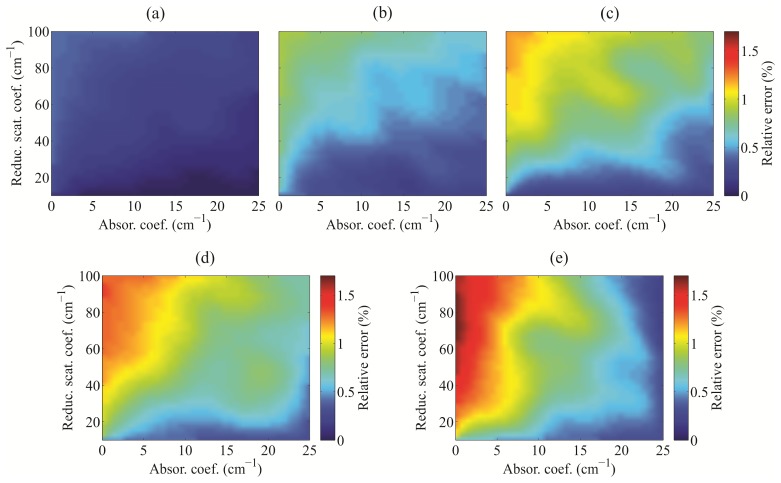
The relative errors between the laterally uniform PTI and realistic black epoxy PTI (Geometry I-e) proved to be much lower than the errors observed between the laterally uniform and realistic stainless steel PTI (Fig. 7). While the highest error observed for low-absorption media was under 0.5% at the shortest SDS, the error at 660 µm SDS rose slightly above 1%, but remained under 2% even at the longest SDS. It is, however, apparent that the relative errors are positive also for the black epoxy probe tip.
Fig. 7.
Relative errors between the Monte Carlo simulations of diffuse reflectance obtained for the laterally uniform and the realistic black epoxy probe-tissue interfaces (Geometry I-e) as a function of the single-layer semi-infinite medium absorption and reduced scattering coefficients. The relative errors are given for the source-detector separations of (a) 220 µm, (b) 440 µm, (c) 660 µm, (d) 880 µm and (e) 1100 µm.
3.2 Diffuse reflectance: Six-around-one fiber geometry
The relative errors between the MC simulated DR values utilizing the laterally uniform and realistic PTI of the six-around-one fiber geometry were calculated analogically to the linear fiber array geometry.
Figure 8(a) shows the relative errors between the MC simulated DR utilizing the laterally uniform PTI and realistic stainless steel PTI (Geometry II-s). The error rises above 2% only for absorption coefficients below 5 cm−1. However, for zero absorption medium, the relative error can exceed 5%. Figure 8(b) shows the dependence of the relative error between the laterally uniform and realistic PTI on the stainless steel reflectivity in the range from 0 to 90%. The results are presented for zero absorption coefficient. For reflectivity below 20%, the effect of the reflections from the stainless steel probe tip on the DR values drops under 2%. For probe tips of higher reflectivity, the relative errors can rise considerably, exceeding 10%.
Fig. 8.
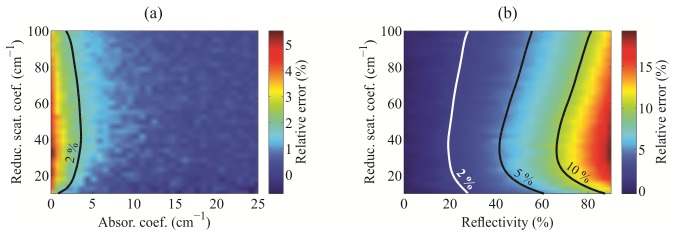
Relative errors between the Monte Carlo simulations of diffuse reflectance obtained for the laterally uniform and the realistic stainless steel probe-tissue interfaces (Geometry II-s) as a function of (a) the single-layer semi-infinite medium absorption and reduced scattering coefficients, and as a function of (b) the stainless steel probe tip reflectivity and single-layer semi-infinite medium reduced scattering coefficient. Absorption coefficient in the latter case was set to 0 cm−1.
Figure 9 presents the relative errors between the laterally uniform PTI and the realistic black epoxy PTI (Geometry II-e). Unlike the realistic stainless steel PTI, the realistic black epoxy PTI does not seem to significantly differ from its simplified counterpart. Although a trend can be observed with decreasing absorption coefficient, the maximum error stays well under 0.5%. With respect to the stochastic noise of the MC simulations, the discrepancy between the two PTIs can be considered negligible.
Fig. 9.
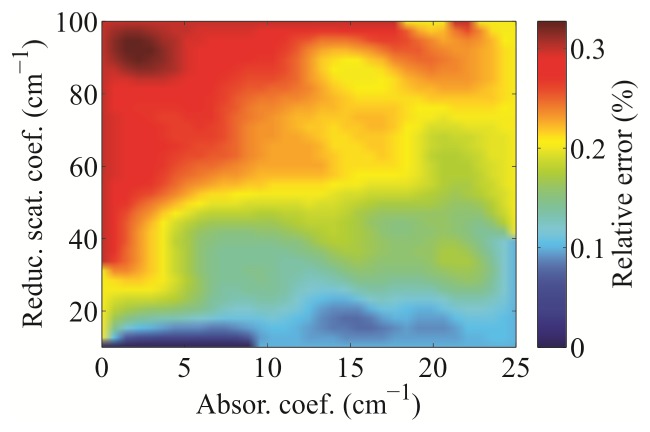
Relative errors between the Monte Carlo simulations of diffuse reflectance obtained for the laterally uniform probe-tissue interface and the realistic black epoxy probe-tissue interface (Geometry II-e) as a function of the single-layer semi-infinite medium absorption and reduced scattering coefficients.
3.3 Impact of the probe tip interface on the extraction of optical properties
The results and relative errors presented in the subsections 3.1 and 3.2 do not provide insight into the impact of the PTI description on the extraction of optical properties from the DR spectra. In this section, we analyzed the synthetic biological DR spectra that were simulated by a realistic stainless steel PTI-based MC model. Subsequently, the simulated DR spectra were analyzed using an inverse laterally uniform PTI-based MC model. In this way, the extracted optimal fit parameters could be directly compared to the parameters used to create the synthetic biological DR spectra. Any discrepancies observed between the two sets of parameters are a direct consequence of the differences between the laterally uniform and realistic PTI descriptions. For this purpose, only the shortest SDS (i.e. 220 µm) of Geometry I-s and Geometry II-s were analyzed.
Figures 10(a) and 10(b) show an example of three simulated synthetic biological DR spectra obtained for the Geometry I-s and Geometry II-s, respectively. In addition, the fitted DR spectra obtained by the laterally uniform PTI-based inverse MC model are presented. The two DR spectra exhibit an almost perfect match without any indication of differences between the synthetic biological spectra and the respective fits.
Fig. 10.
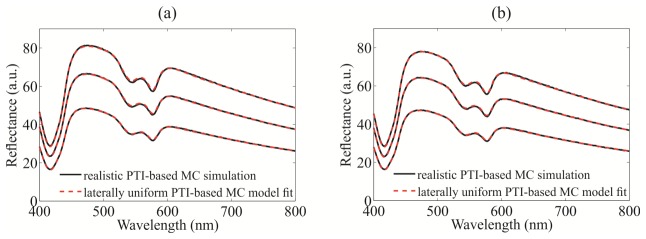
Monte Carlo (MC) simulations of synthetic biological diffuse reflectance spectra based on the realistic stainless steel probe-tissue interface (PTI) (black line). The corresponding inverse MC model fits based on the laterally uniform PTI (red dashed line) for the (a) 220 µm source-detector separation linear fiber array geometry (Geometry I-s), and the (b) six-around-one fiber geometry (Geometry II-s).
The extracted parameters obtained by fitting the laterally uniform PTI-based inverse MC model to the realistic synthetic biological DR spectra are gathered in Tables 1 and 2. Each extracted parameter is provided with the variability reported by the fitting procedure and a relative error εX calculated as a relative deviation from the true parameter value:
| (6) |
where X is the extracted and X0 the true parameter value. As it can be observed, the relative deviations of the extracted parameters from the true values are significantly higher than the errors that arise from the fitting procedure.
Table 1. Extracted parameters obtained by fitting the inverse Monte Carlo model based on the laterally uniform probe-tissue interface to the synthetic biological diffuse reflectance spectra simulated by a Monte Carlo model based on the realistic stainless steel probe-tissue interface. Results are presented for the linear fiber array geometry at a source-detector separation of 220 µm (Geometry I-s).
| B (%) | εB (%) | α (%) | εα (%) | a (cm−1) | εa (%) | b | εb (%) |
|---|---|---|---|---|---|---|---|
| 0.550 ± 0.001 | 10.0 | 74.5 ± 0.2 | –0.7 | 35.41 ± 0.01 | 7.3 | 1.429 ± 0.001 | 2.1 |
| 0.550 ± 0.001 | 10.0 | 74.3 ± 0.2 | –0.9 | 50.39 ± 0.02 | 9.5 | 1.45 ± 0.002 | 3.6 |
| 0.549 ± 0.001 | 9.8 | 74.2 ± 0.3 | –1.1 | 66.26 ± 0.04 | 12.3 | 1.485 ± 0.002 | 6.1 |
| 1.077 ± 0.002 | 7.7 | 74.8 ± 0.2 | –0.3 | 35.18 ± 0.02 | 6.6 | 1.414 ± 0.002 | 1.0 |
| 1.083 ± 0.002 | 8.3 | 74.7 ± 0.2 | –0.4 | 50.03 ± 0.03 | 8.8 | 1.434 ± 0.002 | 2.4 |
| 1.087 ± 0.003 | 8.7 | 74.5 ± 0.2 | –0.7 | 65.76 ± 0.05 | 11.5 | 1.467 ± 0.003 | 4.8 |
| 1.611 ± 0.003 | 7.4 | 75.3 ± 0.2 | 0.4 | 35.10 ± 0.02 | 6.4 | 1.411 ± 0.002 | 0.8 |
| 1.622 ± 0.004 | 8.1 | 75.2 ± 0.2 | 0.3 | 49.85 ± 0.04 | 8.4 | 1.426 ± 0.003 | 1.9 |
| 1.624 ± 0.004 | 8.3 | 75.0 ± 0.2 | 0.0 | 65.41 ± 0.06 | 10.8 | 1.454 ± 0.003 | 3.9 |
Table 2. Extracted parameters obtained by fitting the inverse Monte Carlo model based on the laterally uniform probe-tissue interface to the synthetic biological diffuse reflectance spectra simulated by a Monte Carlo model based on the realistic stainless steel probe-tissue interface. Results are presented for the six-around-one fiber geometry (Geometry II-s).
| B (%) | εB (%) | α (%) | εα (%) | a (cm−1) | εa (%) | b | εb (%) |
|---|---|---|---|---|---|---|---|
| 0.532 ± 0.001 | 6.4 | 74.7 ± 0.2 | –0.4 | 34.40 ± 0.01 | 4.2 | 1.391 ± 0.001 | –0.6 |
| 0.527 ± 0.001 | 5.4 | 74.2 ± 0.2 | –1.1 | 48.10 ± 0.02 | 4.6 | 1.386 ± 0.001 | –1.0 |
| 0.526 ± 0.001 | 5.2 | 74.5 ± 0.2 | –0.7 | 62.05 ± 0.03 | 5.2 | 1.395 ± 0.002 | –0.4 |
| 1.049 ± 0.002 | 4.9 | 74.9 ± 0.2 | –0.1 | 34.23 ± 0.02 | 3.7 | 1.380 ± 0.002 | –1.4 |
| 1.044 ± 0.002 | 4.4 | 75.0 ± 0.2 | 0.0 | 47.90 ± 0.02 | 4.1 | 1.378 ± 0.002 | –1.6 |
| 1.039 ± 0.002 | 3.9 | 75.0 ± 0.2 | 0.0 | 61.68 ± 0.04 | 4.5 | 1.381 ± 0.002 | –1.4 |
| 1.567 ± 0.003 | 4.5 | 75.3 ± 0.2 | 0.4 | 34.15 ± 0.02 | 3.5 | 1.377 ± 0.002 | –1.6 |
| 1.560 ± 0.003 | 4.0 | 75.2 ± 0.2 | 0.3 | 47.72 ± 0.03 | 3.7 | 1.371 ± 0.002 | –2.1 |
| 1.561 ± 0.003 | 4.1 | 75.5 ± 0.2 | 0.7 | 61.56 ± 0.04 | 4.3 | 1.378 ± 0.002 | –1.6 |
In the case of the linear fiber array geometry with an SDS of 220 µm, the laterally uniform PTI-based inverse MC model most prominently affects the extraction of hemoglobin volume fraction B and scattering parameter a, exhibiting an average relative error of 8.7% and 9.1%, respectively. Significant effect was also observed for the scattering parameter b, with an average relative error of 2.9%. No significant and systematic errors were observed for the hemoglobin oxygen saturation α.
In the case of the six-around-one fiber geometry, the laterally uniform PTI-based inverse MC model introduces less, however not negligible, error into the hemoglobin volume fraction B and scattering parameter a estimates, with an average relative errors of 4.8% and 4.2%, respectively. A significant average relative error of −1.3% was also observed for the scattering parameter b. No significant and systematic errors were observed for the hemoglobin oxygen saturation α.
3.4 Impact of the probe tip interface on the Monte Carlo model calibration
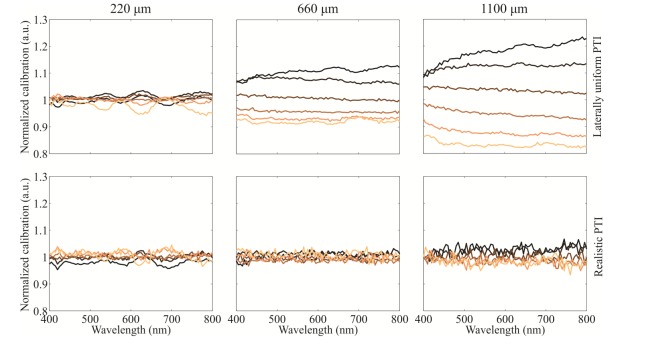
In order to directly compare the measured and simulated DR spectra, a calibration based on phantoms with exactly defined optical properties is required. For this purpose, 6 phantoms containing different concentrations of polystyrene microspheres were measured by a linear fiber array stainless steel optical probe and compared to the corresponding simulated DR spectra based on either the laterally uniform or the realistic stainless steel PTI. A calibration curve for each phantom was obtained by computing the quotient between the measured and the corresponding simulated DR spectrum. Ideally, the calibration curves should be the same for all the phantoms, therefore, the calibration curves were divided by the average of all calibration curves. The obtained normalized calibration curves should exhibit values that are close to 1 over the entire spectral range.
Figure 11 shows the normalized calibration curves for the linear fiber array geometry at SDS of 220, 660 and 1100 µm obtained by the laterally uniform and realistic PTI. For the laterally uniform PTI, the normalized calibration curves at SDS of 220 µm are close to 1 with a root-mean-square (rms) error of 1.6% over the entire spectral range. In contrast, the deviations from 1 are clearly visible for the 660 and 1100 µm SDS with a rms error of 7.1% and 12.7%, respectively. The consistency among the normalized calibration curves obtained by the realistic PTI-based MC simulations is significantly improved. For the 220, 660, and 1100 µm SDS the rms error dropps to 1.5%, 1.4%, and 2.4%, respectively.
Fig. 11.
Normalized calibration curves derived from the Monte Carlo (MC) simulated and measured diffuse reflectance spectra of polystyrene microsphere suspensions obtained for the linear fiber array optical probe. MC simulations utilizing (top) the laterally uniform and (bottom) the realistic stainless steel probe tissue interface (PTI) (Geometry I-s). Each column pair represents a different source-detector separation.
4. Discussion
In this study, we evaluated the impact of the commonly used laterally uniform PTI approximation on the MC simulated DR and performance of inverse models. The study included a linear array and six-around-one fiber geometries that are most commonly used in the literature.
Significant differences between the MC simulated DR obtained by the laterally uniform and realistic stainless steel PTI were observed. For the linear fiber array geometry, the deviations were more pronounced at longer SDS (Fig. 5). Moreover, the relative error was always positive indicating that more photon packets were able to reflect from the stainless steel probe tip and score in the detector fiber. Because the photon packets detected at longer SDS have a longer photon path-length, there is a higher probability that a specific photon packet will hit and reflect from the stainless steel interface along its path. In purely scattering media, the photon packets are not attenuated along their path, thus the differences are the highest. For the six-around-one fiber geometry, the differences are significant (over 2%) only for samples with low absorption coefficient. This observation could be explained by the fact that the photon packets interacting with the stainless steel interface need to take an unlikely path to the outer region of the probe tip and then return back inwards to score in the detector fiber.
As shown in Figs. 6 and 8(b), the stainless steel probe tip reflectivity significantly influences the relative errors between the simulated DR obtained by the laterally uniform and realistic stainless steel PTI. The result suggests that the probe tip reflectivity should be measured and not treated as a perfect reflector in order to obtain accurate MC simulations of the DR.
In our study, the anisotropy factor was fixed to 0.8 due to its frequent use in biological tissues. As an example, Fig. 12 shows the relative errors between the MC simulated DR values obtained for laterally uniform and realistic stainless steel PTI as a function of the anisotropy factor for a set of absorption and scattering coefficients (Geometry I-s). It can be observed, that the relative error decreases with increasing anisotropy factor. Such observation is somewhat expected as with higher anisotropy, the photon packets are more forward scattered and thus the influence of the PTI is decreased. In addition, the observation is in agreement with the relative error dependency on the reduced scattering coefficient in Fig. 5, because an increase in the anisotropy factor causes a decrease in the reduced scattering coefficient according to µs' = µs (1 – g). In fact, in turbid media it is common to assume a similarity relation, where the diffuse reflectance values approximately depend only on the reduced scattering coefficient and not on the combination of the scattering coefficient and anisotropy factor. The similarity relation is commonly used in the MC lookup table inverse models [28,29].
Fig. 12.

Relative errors between the Monte Carlo simulations of diffuse reflectance obtained for the laterally uniform and the realistic stainless steel probe-tissue interfaces (Geometry I-s) as a function of the anisotropy factor for different absorption and scattering coefficients (see legend). The source-detector separation is provided above each figure.
The relative errors between the laterally uniform and realistic black epoxy PTI have proved to be negligible. The relative errors obtained for the linear fiber array geometry were under 2% for all SDS and the relative errors obtained for the six-around-one fiber geometry were under 0.5%. It should be noted that the relative errors are always positive, thus suggesting that the photon packets reflect more from the realistic black epoxy PTI than the laterally uniform PTI. This observation is somewhat expected, as the black epoxy used in this study had a refractive index of 1.6, producing a higher refractive index mismatch than the fiber-tissue interface. The obtained relative errors between the laterally uniform and realistic black epoxy PTI are well within the accuracy of the employed measurement setting. In the literature, a 2% or 3% accuracy is often considered as the margin for a successful measurement [40,41].
Synthetic biological DR spectra simulated by the realistic stainless steel PTI were analyzed to investigate the impact of the laterally uniform PTI on the inverse model. For this purpose, the DR spectra were analyzed for probe geometries that exhibited low relative errors between the laterally uniform and realistic PTI, i.e. a linear fiber array with 220 µm SDS and six-around-one fiber geometry. As the two measurement settings exhibited significant errors only for low absorption samples, one would expect negligible errors when fitting the laterally uniform PTI-based inverse model to the synthetic biological DR spectra with dominant blood absorption. While the fitted DR spectra show good agreement with the synthetic biological DR spectra in Fig. 10, the extracted parameters reported in Tables 1 and 2 show clear systematic deviations in the hemoglobin volume fraction B, and scattering parameters a and b. These deviations indicate that the MC model utilizing the laterally uniform PTI is inadequate even for biological DR spectra with non-zero absorption. For example, the hemoglobin absorption spectrum at 1% blood content and 75% oxygen saturation is higher than 5 cm−1 only below 450 nm and falls under 1 cm−1 above 600 nm. Consequently, the laterally uniform PTI-based inverse MC model used to fit the synthetic biological DR spectra introduces spectrally non-uniform error that affects the accuracy of both the absorption and reduced scattering coefficient estimates. In addition to the 220 µm SDS, we have analyzed the laterally uniform PTI-based inverse model for the remaining SDS and observed a progressively deteriorating performance leading to clear discrepancies between the fitted and synthetic biological DR spectra and significantly higher relative deviations of the extracted parameters.
The relative deviations of the extracted parameters for the six-around-one probe geometry (Geometry II-s) are almost two-fold smaller than those of the linear fiber array (Geometry I-s) at 220 µm SDS. This result is somewhat expected, with respect to results reported in Figs. 5(a) and 8(a). While at absorption coefficients near 0 cm−1 the relative errors for Geometry I-s at 220 µm SDS can reach up to 10%, the relative errors hardly exceed 5% for Geometry II-s. Therefore, when fitting the inverse MC model based on the laterally uniform PTI, the extracted parameters in the case of Geometry II-s show smaller relative deviations.
Accurate calibration of the optical probe experimental setup is necessary to allow inverse model-based assessment of the DR spectra measurements made in samples with unknown optical properties [28,29,41,42]. Such calibration is used to establish relation between the forward model and the measured DR spectra, therefore any calibration errors will hamper the accuracy of extracted optical parameters. The results presented in Fig. 11 clearly show that the calibration procedure is significantly affected by the level of details encompassed by the PTI description. In the case of a linear fiber array geometry with a stainless steel probe tip, it is necessary to employ the realistic stainless steel PTI. Once the reflections from the stainless steel are accounted for, the normalized calibration curves are much closer to 1, in particular for the longer SDS. However, there is no significant improvement at the SDS of 220 µm. This lack of improvement is most likely due to the following reasons. Firstly, the phase function and the scattering coefficient of the polystyrene microspheres greatly depend on the values of diameter and refractive index. Any errors in the two values might reflect in the lobes, which are visible in the 220 µm normalized calibration curves (Fig. 11). Secondly, the relative errors between the laterally uniform and realistic stainless steel PTI-based DR estimates are the smallest for the 220 µm SDS. Therefore, even for the laterally uniform PTI, the normalized calibration curves are expected to be close to 1.
The significant differences between the DR spectra simulated by the laterally uniform and realistic PTI can have important implications for the use of other light propagation models. Analytical expression proposed by Farrell et al. is often used to estimate DR values for various optical fiber probe geometries [20,43]. This expression treats the PTI as a laterally uniform boundary with mismatched refractive indices. As observed in our study, one should carefully consider the effects of the simplified laterally uniform PTI before employing the proposed expression. While it might be appropriate to use the expression for non-contact optical fiber probes, the model is likely to introduce significant errors when used with e.g. stainless steel optical fiber probes. In order to speed up the MC simulations, many authors have proposed and used response to an infinitely narrow light beam and convolution in order to account for the finite diameter of a light beam exiting the optical fiber [44]. The convolution principle depends on the symmetry and homogeneity of the medium and the upper boundary which are broken by the introduction of a realistic PTI. However, the convolution-based estimate might produce accurate results under certain fiber probe geometries and probe tip materials. For example, as seen in Figs. 7 and 9, black epoxy optical fiber probes can be approximated by a laterally uniform PTI without introducing significant errors into the MC simulation.
5. Conclusion
In this paper we highlighted the importance of considering a realistic description of the probe-tissue interface (PTI) for modelling the diffuse reflectance (DR) spectra. The problem has not yet been addressed properly in the literature. Many of the authors utilized a simplified laterally uniform PTI that accounts only for the refractive index mismatch at the optical fiber probe tip. Thus, in order to assess the impact of such simplifications on the simulation and analysis of DR spectra, we systematically investigated the most common optical fiber probe geometries used in DR spectroscopy.
In the case of a stainless steel probe tip, the reflections from the stainless steel greatly influence the DR spectra. A laterally uniform PTI approximation can significantly affect the Monte Carlo (MC) simulated DR spectra. The effect was observed for both the linear array and six-around-one fiber geometries. Moreover, the simplified laterally uniform PTI can have a deteriorating effect on the accuracy of the inverse model and model calibration. Therefore, it is imperative that a realistic stainless steel PTI is included in the MC simulation. What is more, the MC simulated DR spectra significantly depend on the stainless steel reflectivity, therefore the reflectivity should be measured.
In the case of a black epoxy probe tip, the difference between the MC simulated DR spectra obtained by the laterally uniform and realistic PTI is small and in most cases well within the experimental measurement variability. Thus, in our opinion, a simplified laterally uniform PTI adequately describes the geometry of such optical fiber probes.
Acknowledgments
This work was supported by the Slovenian Research Agency through grants J7-6781, J2-5473, L2-5472 and L2-4072.
References and links
- 1.Mourant J. R., Bigio I. J., Boyer J., Conn R. L., Johnson T., Shimada T., “Spectroscopic diagnosis of bladder cancer with elastic light scattering,” Lasers Surg. Med. 17(4), 350–357 (1995). 10.1002/lsm.1900170403 [DOI] [PubMed] [Google Scholar]
- 2.Bevilacqua F., Piguet D., Marquet P., Gross J. D., Tromberg B. J., Depeursinge C., “In vivo Local Determination of Tissue Optical Properties: Applications to Human Brain,” Appl. Opt. 38(22), 4939–4950 (1999). 10.1364/AO.38.004939 [DOI] [PubMed] [Google Scholar]
- 3.Yaroslavsky A. N., Schulze P. C., Yaroslavsky I. V., Schober R., Ulrich F., Schwarzmaier H. J., “Optical properties of selected native and coagulated human brain tissues in vitro in the visible and near infrared spectral range,” Phys. Med. Biol. 47(12), 2059–2073 (2002). 10.1088/0031-9155/47/12/305 [DOI] [PubMed] [Google Scholar]
- 4.Bigio I. J., Bown S. G., Briggs G., Kelley C., Lakhani S., Pickard D., Ripley P. M., Rose I. G., Saunders C., “Diagnosis of breast cancer using elastic-scattering spectroscopy: preliminary clinical results,” J. Biomed. Opt. 5(2), 221–228 (2000). 10.1117/1.429990 [DOI] [PubMed] [Google Scholar]
- 5.Palmer G. M., Zhu C., Breslin T. M., Xu F., Gilchrist K. W., Ramanujam N., “Monte Carlo-based inverse model for calculating tissue optical properties. Part II: Application to breast cancer diagnosis,” Appl. Opt. 45(5), 1072–1078 (2006). 10.1364/AO.45.001072 [DOI] [PubMed] [Google Scholar]
- 6.Arifler D., MacAulay C., Follen M., Richards-Kortum R., “Spatially resolved reflectance spectroscopy for diagnosis of cervical precancer: Monte Carlo modeling and comparison to clinical measurements,” J. Biomed. Opt. 11(6), 064027 (2006). 10.1117/1.2398932 [DOI] [PubMed] [Google Scholar]
- 7.Zonios G., Perelman L. T., Backman V., Manoharan R., Fitzmaurice M., Van Dam J., Feld M. S., “Diffuse Reflectance Spectroscopy of Human Adenomatous Colon Polyps In Vivo,” Appl. Opt. 38(31), 6628–6637 (1999). 10.1364/AO.38.006628 [DOI] [PubMed] [Google Scholar]
- 8.Ge Z., Schomacker K. T., Nishioka N. S., “Identification of Colonic Dysplasia and Neoplasia by Diffuse Reflectance Spectroscopy and Pattern Recognition Techniques,” Appl. Spectrosc. 52(6), 833–839 (1998). 10.1366/0003702981944571 [DOI] [Google Scholar]
- 9.Wallace M. B., Perelman L. T., Backman V., Crawford J. M., Fitzmaurice M., Seiler M., Badizadegan K., Shields S. J., Itzkan I., Dasari R. R., Van Dam J., Feld M. S., “Endoscopic detection of dysplasia in patients with Barrett’s esophagus using light-scattering spectroscopy,” Gastroenterology 119(3), 677–682 (2000). 10.1053/gast.2000.16511 [DOI] [PubMed] [Google Scholar]
- 10.Georgakoudi I., Jacobson B. C., Van Dam J., Backman V., Wallace M. B., Müller M. G., Zhang Q., Badizadegan K., Sun D., Thomas G. A., Perelman L. T., Feld M. S., “Fluorescence, reflectance, and light-scattering spectroscopy for evaluating dysplasia in patients with Barrett’s esophagus,” Gastroenterology 120(7), 1620–1629 (2001). 10.1053/gast.2001.24842 [DOI] [PubMed] [Google Scholar]
- 11.Utzinger U., Brewer M., Silva E., Gershenson D., Blast R. C., Jr, Follen M., Richards-Kortum R., “Reflectance spectroscopy for in vivo characterization of ovarian tissue,” Lasers Surg. Med. 28(1), 56–66 (2001). [DOI] [PubMed] [Google Scholar]
- 12.Wilson R. H., Chandra M., Scheiman J., Simeone D., McKenna B., Purdy J., Mycek M.-A., “Optical spectroscopy detects histological hallmarks of pancreatic cancer,” Opt. Express 17(20), 17502–17516 (2009). 10.1364/OE.17.017502 [DOI] [PubMed] [Google Scholar]
- 13.Lee S. Y., Lloyd W. R., Chandra M., Wilson R. H., McKenna B., Simeone D., Scheiman J., Mycek M.-A., “Characterizing human pancreatic cancer precursor using quantitative tissue optical spectroscopy,” Biomed. Opt. Express 4(12), 2828–2834 (2013). 10.1364/BOE.4.002828 [DOI] [PMC free article] [PubMed] [Google Scholar]
- 14.Salomatina E., Jiang B., Novak J., Yaroslavsky A. N., “Optical properties of normal and cancerous human skin in the visible and near-infrared spectral range,” J. Biomed. Opt. 11(6), 064026 (2006). 10.1117/1.2398928 [DOI] [PubMed] [Google Scholar]
- 15.Zonios G., Dimou A., Bassukas I., Galaris D., Tsolakidis A., Kaxiras E., “Melanin absorption spectroscopy: new method for noninvasive skin investigation and melanoma detection,” J. Biomed. Opt. 13(1), 014017 (2008). 10.1117/1.2844710 [DOI] [PubMed] [Google Scholar]
- 16.Kienle A., Lilge L., Patterson M. S., Hibst R., Steiner R., Wilson B. C., “Spatially resolved absolute diffuse reflectance measurements for noninvasive determination of the optical scattering and absorption coefficients of biological tissue,” Appl. Opt. 35(13), 2304–2314 (1996). 10.1364/AO.35.002304 [DOI] [PubMed] [Google Scholar]
- 17.Doornbos R. M. P., Lang R., Aalders M. C., Cross F. W., Sterenborg H. J., “The determination of in vivo human tissue optical properties and absolute chromophore concentrations using spatially resolved steady-state diffuse reflectance spectroscopy,” Phys. Med. Biol. 44(4), 967–981 (1999). 10.1088/0031-9155/44/4/012 [DOI] [PubMed] [Google Scholar]
- 18.Zonios G., Bykowski J., Kollias N., “Skin melanin, hemoglobin, and light scattering properties can be quantitatively assessed in vivo using diffuse reflectance spectroscopy,” J. Invest. Dermatol. 117(6), 1452–1457 (2001). 10.1046/j.0022-202x.2001.01577.x [DOI] [PubMed] [Google Scholar]
- 19.Bargo P. R., Prahl S. A., Goodell T. T., Sleven R. A., Koval G., Blair G., Jacques S. L., “In vivo determination of optical properties of normal and tumor tissue with white light reflectance and an empirical light transport model during endoscopy,” J. Biomed. Opt. 10(3), 034018 (2005). 10.1117/1.1921907 [DOI] [PubMed] [Google Scholar]
- 20.Kim A., Roy M., Dadani F., Wilson B. C., “A fiberoptic reflectance probe with multiple source-collector separations to increase the dynamic range of derived tissue optical absorption and scattering coefficients,” Opt. Express 18(6), 5580–5594 (2010). 10.1364/OE.18.005580 [DOI] [PubMed] [Google Scholar]
- 21.Lin W.-C., Toms S. A., Johnson M., Jansen E. D., Mahadevan-Jansen A., “In Vivo Brain Tumor Demarcation Using Optical Spectroscopy,” Photochem. Photobiol. 73(4), 396–402 (2001). [DOI] [PubMed] [Google Scholar]
- 22.Yu B., Shah A., Nagarajan V. K., Ferris D. G., “Diffuse reflectance spectroscopy of epithelial tissue with a smart fiber-optic probe,” Biomed. Opt. Express 5(3), 675–689 (2014). 10.1364/BOE.5.000675 [DOI] [PMC free article] [PubMed] [Google Scholar]
- 23.Papaioannou T., Preyer N. W., Fang Q., Brightwell A., Carnohan M., Cottone G., Ross R., Jones L. R., Marcu L., “Effects of fiber-optic probe design and probe-to-target distance on diffuse reflectance measurements of turbid media: an experimental and computational study at 337 nm,” Appl. Opt. 43(14), 2846–2860 (2004). 10.1364/AO.43.002846 [DOI] [PMC free article] [PubMed] [Google Scholar]
- 24.Gamm U. A., Kanick S. C., Sterenborg H. J., Robinson D. J., Amelink A., “Measurement of tissue scattering properties using multi-diameter single fiber reflectance spectroscopy: in silico sensitivity analysis,” Biomed. Opt. Express 2(11), 3150–3166 (2011). 10.1364/BOE.2.003150 [DOI] [PMC free article] [PubMed] [Google Scholar]
- 25.Sharma V., Shivalingaiah S., Peng Y., Euhus D., Gryczynski Z., Liu H., “Auto-fluorescence lifetime and light reflectance spectroscopy for breast cancer diagnosis: potential tools for intraoperative margin detection,” Biomed. Opt. Express 3(8), 1825–1840 (2012). 10.1364/BOE.3.001825 [DOI] [PMC free article] [PubMed] [Google Scholar]
- 26.Utzinger U., Richards-Kortum R. R., “Fiber optic probes for biomedical optical spectroscopy,” J. Biomed. Opt. 8(1), 121–147 (2003). 10.1117/1.1528207 [DOI] [PubMed] [Google Scholar]
- 27.Zhu C., Liu Q., Ramanujam N., “Effect of fiber optic probe geometry on depth-resolved fluorescence measurements from epithelial tissues: a Monte Carlo simulation,” J. Biomed. Opt. 8(2), 237–247 (2003). 10.1117/1.1559058 [DOI] [PubMed] [Google Scholar]
- 28.Palmer G. M., Ramanujam N., “Monte Carlo-based inverse model for calculating tissue optical properties. Part I: Theory and validation on synthetic phantoms,” Appl. Opt. 45(5), 1062–1071 (2006). 10.1364/AO.45.001062 [DOI] [PubMed] [Google Scholar]
- 29.Hennessy R., Lim S. L., Markey M. K., Tunnell J. W., “Monte Carlo lookup table-based inverse model for extracting optical properties from tissue-simulating phantoms using diffuse reflectance spectroscopy,” J. Biomed. Opt. 18(3), 037003 (2013). 10.1117/1.JBO.18.3.037003 [DOI] [PMC free article] [PubMed] [Google Scholar]
- 30.Fredriksson I., Larsson M., Strömberg T., “Inverse Monte Carlo method in a multilayered tissue model for diffuse reflectance spectroscopy,” J. Biomed. Opt. 17(4), 047004 (2012). 10.1117/1.JBO.17.4.047004 [DOI] [PubMed] [Google Scholar]
- 31.Cappon D. J., Farrell T. J., Fang Q., Hayward J. E., “Fiber-optic probe design and optical property recovery algorithm for optical biopsy of brain tissue,” J. Biomed. Opt. 18(10), 107004 (2013). 10.1117/1.JBO.18.10.107004 [DOI] [PubMed] [Google Scholar]
- 32.Wang L., Jacques S. L., Zheng L., “MCML-Monte Carlo modeling of light transport in multi-layered tissues,” Comput. Methods Programs Biomed. 47(2), 131–146 (1995). 10.1016/0169-2607(95)01640-F [DOI] [PubMed] [Google Scholar]
- 33.Alerstam E., Svensson T., Andersson-Engels S., “Parallel computing with graphics processing units for high-speed Monte Carlo simulation of photon migration,” J. Biomed. Opt. 13(6), 060504 (2008). 10.1117/1.3041496 [DOI] [PubMed] [Google Scholar]
- 34.Bashkatov A. N., Genina E. A., Tuchin V. V., “Optical properties of skin, subcutaneous, and muscle tissues: a review,” J. Innov. Opt. Health Sci. 4(1), 9–38 (2011). 10.1142/S1793545811001319 [DOI] [Google Scholar]
- 35.Jacques S. L., “Optical properties of biological tissues: a review,” Phys. Med. Biol. 58(11), R37–R61 (2013). 10.1088/0031-9155/58/11/R37 [DOI] [PubMed] [Google Scholar]
- 36.Zijlstra W. G., Buursma A., van Assendelft O. W., Visible and Near Infrared Absorption Spectra of Human and Animal Haemoglobin: Determination and Application (VSP, 2000). [Google Scholar]
- 37.Bohren C. F., Huffman D. R., Absorption and Scattering of Light by Small Particles (John Wiley & Sons, 2008). [Google Scholar]
- 38.Nikolov I. D., Ivanov C. D., “Optical plastic refractive measurements in the visible and the near-infrared regions,” Appl. Opt. 39(13), 2067–2070 (2000). 10.1364/AO.39.002067 [DOI] [PubMed] [Google Scholar]
- 39.Toublanc D., “Henyey-Greenstein and Mie phase functions in Monte Carlo radiative transfer computations,” Appl. Opt. 35(18), 3270–3274 (1996). 10.1364/AO.35.003270 [DOI] [PubMed] [Google Scholar]
- 40.Rajaram N., Nguyen T. H., Tunnell J. W., “Lookup table-based inverse model for determining optical properties of turbid media,” J. Biomed. Opt. 13(5), 050501 (2008). 10.1117/1.2981797 [DOI] [PMC free article] [PubMed] [Google Scholar]
- 41.Kanick S. C., Krishnaswamy V., Gamm U. A., Sterenborg H. J., Robinson D. J., Amelink A., Pogue B. W., “Scattering phase function spectrum makes reflectance spectrum measured from intralipid phantoms and tissue sensitive to the device detection geometry,” Biomed. Opt. Express 3(5), 1086–1100 (2012). 10.1364/BOE.3.001086 [DOI] [PMC free article] [PubMed] [Google Scholar]
- 42.Zhong X., Wen X., Zhu D., “Lookup-table-based inverse model for human skin reflectance spectroscopy: two-layered Monte Carlo simulations and experiments,” Opt. Express 22(2), 1852–1864 (2014). 10.1364/OE.22.001852 [DOI] [PubMed] [Google Scholar]
- 43.Farrell T. J., Patterson M. S., Wilson B., “A diffusion theory model of spatially resolved, steady-state diffuse reflectance for the noninvasive determination of tissue optical properties in vivo,” Med. Phys. 19(4), 879–888 (1992). 10.1118/1.596777 [DOI] [PubMed] [Google Scholar]
- 44.Wang L., Jacques S. L., Zheng L., “CONV-convolution for responses to a finite diameter photon beam incident on multi-layered tissues,” Comput. Methods Programs Biomed. 54(3), 141–150 (1997). 10.1016/S0169-2607(97)00021-7 [DOI] [PubMed] [Google Scholar]


