Abstract
An ultrafast investigation is carried out on synthetic eumelanin suspended either in water or in DMSO-methanol. Upon photoexcitation by visible femtosecond pulses, the transient absorption (TA) dynamics of the suspensions are probed in a broad visible spectral range, showing clear nonlinearities. The latter arise from pump-probe interactions that induce the inverse Raman scattering (IRS) effect. We show how eumelanin TA dynamics are modified in proximity of the solvent Stokes and anti-Stokes scattering peaks, demonstrating that IRS affects the sign of TA but not the relaxation times. We compare the results obtained in both suspensions, unveiling the role of the surrounding environment. Eventually, the intrinsic response of synthetic eumelanin to ultrafast photoexcitation is evaluated.
OCIS codes: (160.1435) Biomaterials; (320.7150) Ultrafast spectroscopy; (300.6240) Spectroscopy, coherent transient; (190.5890) Scattering, stimulated
1. Introduction
In the picosecond/femtosecond time regime, the transient absorption can be probed by an ultrafast broadband white-light continuum probe pulse, delayed from the pump pulse via an optical delay line. In case of Raman active media, Femtosecond Transient Absorption (FTA) is a valid tool to investigate the inverse Raman scattering (IRS), a stimulated Raman scattering process. In IRS the anti-Stokes scattering peaks appear upside-down as opposed to the Stokes peaks at ultrashort time delays, due to the physical processes occurring at specific energies [1–3]. In fact, the direction of stimulated processes depends on the number of vibrationally excited species compared with the number of unexcited molecules in the medium. Upon proper excitation, molecules and atoms are stimulated to emit radiation at the Stokes frequencies and to absorb radiation at the anti-Stokes frequencies [4], since high-frequency states are not highly populated at room temperature [1].
In this paper, we investigate the relaxation of eumelanin suspensions by means of FTA in different solvents. We show specific features which will be attributed to IRS, significantly affecting the temporal evolution of eumelanin relaxation. The importance of recognizing the IRS contribution in such dynamics is crucial to avoid imaging misinterpretation, since a different number of photons could be detected, due to the stimulated Raman scattering process. Providing an in-depth analysis, we address whether or not this coherent artifact changes the decay time constants too. Once precisely identified the IRS impact on such samples, IRS-free eumelanin dynamics are presented, and the influence of the solvent on this pigment is discussed.
Melanins, a major class of biological pigments, are ubiquitous in nature, being found in most organisms. They are usually classified into eumelanin, dark- brown nitrogenous pigments, and pheomelanin, yellow to reddish pigments also containing sulphur and nitrogen [5]. Eumelanin is a heterogeneous macromolecule of 5,6-dihydroxyindole (DHI) and its 2-carboxylated form 5,6-dihydroxyindole-2-carboxylic acid (DHICA) [6]. Melanin exhibits many interesting physical and chemical properties such as anti-oxidant and free-radical scavenger behavior, metal and drug binding nature [7–9], and broad band UV-Vis absorption [10, 11] leading to photoprotective function [12,13]. A strong non-radiative relaxation of photo-excited electronic states was also measured [6]. The most diffuse form of melanin is natural eumelanin. The latter is well known to be a highly complex system, and its high protein content makes it challenging to investigate [10]. A simpler approach is to study synthetic eumelanin, which is instead prepared through a nonenzymatic method [14]. The obtained pigment is considered to be an appropriate model of the physical properties of natural eumelanin [14].
Thus far, few time-resolved investigations have been performed on eumelanin suspensions, where molar absorptivities and relaxation pathways are estimated [15–19]. More recently, a deeper insight into eumelanin pigments has been provided using transient absorption spectroscopy [20] and microscopy [21, 22]. However, to the best of our knowledge, each of these studies explored only the temporal evolution of the transient absorption signal in the eumelanin, but not the spectral one. By means of a white light supercontinuum probe, it is possible to simultaneously investigate how the FTA evolves at different probe energies. This will easily reveal coherent artifacts occurring at specific probe energies, such as the IRS, and will allow the analysis of the transient dynamics of eumelanin pigments over the entire visible range.
This study aims to investigate the temporal evolution of broadband spectral features in eumelanin pigments dispersed in different liquids using ultrafast transient light absorption in the visible range. Our experimental results demonstrate that the intrinsic eumelanin response always consists of a positive ΔA signal, which is attributed to photoinduced absorption, in both DMSO-methanol and HPLC-grade water. On the contrary, the negative signals observed only at specific energies are due to the IRS effect of the solvent. To address the influence of this coherent artifact on eumelanin FTA dynamics, three probing energies have been selected: i) ħωprobe < ħωStokes, ii) ħωStokes < ħωprobe < ħωpump, iii) ħωpump < ħωprobe < ħωanti–Stokes. Finally, we evaluate the time constants of the intrinsic eumelanin decay processes, demonstrating how the IRS effect changes the sign of the dynamics at very short time delays, while leaving the time constants of the decays essentially unaltered.
2. Materials and methods
2.1. Sample preparation
Commercial synthetic eumelanin powder produced by oxidation of tyrosine with hydrogen peroxide (Sigma Aldrich) was used to prepare the investigated eumelanin suspensions. Dimethyl-sulfoxide (DMSO) eumelanin suspension was prepared by dissolving 4 mg of eumelanin powder into 20 ml of DMSO-CH3OH mixture (ratio 1 : 20). Aqueous eumelanin solutions were obtained by dissolving 50 mg of eumelanin powder into 10 ml of HPLC-grade water. The above mixture was initially sonicated for 30 min and then centrifuged (Heraeus Megafuge 1.0 R) at 3000 rpm at 4°C for 30 min, in order to remove larger suspended aggregates. The supernatant was used for optical measurements. The lower solubility of eumelanin pigments in water forced us to begin with a higher concentration of eumelanin in order get roughly the same amount of compound in the supernatant, as demonstrated by the absorption spectra of the two suspensions in Fig. 1.
Fig. 1.
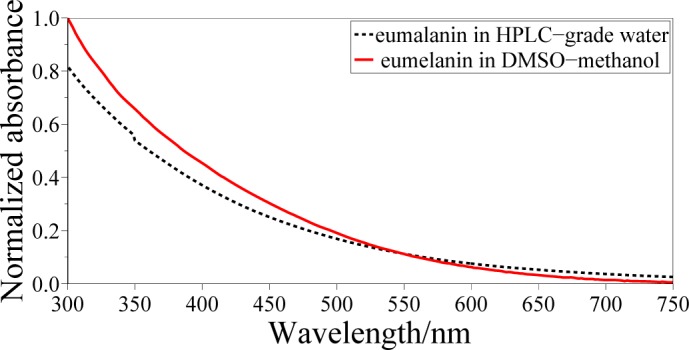
Absorbance of synthetic eumelanin suspensions in HPLC-grade water (black dashed line) and in DMSO-methanol mixture 1:20 ratio (red solid line), both normalized to absorbance of eumelanin in DMSO-methanol at 300 nm.
2.2. Optical spectroscopy investigations
UV-Vis absorption spectra were recorded at room temperature by means of a CARY VARIAN 5000 spectrophotometer. Raman spectra were recorded at room temperature by means of a Raman confocal micro-spectrometer apparatus (Labram, Jobin-Yvon Horiba) using the 488 nm line of an Ar+ ion laser as excitation source. The laser beam was focused through a 40 mm focal length lens onto the cuvette containing the suspension. The laser power focused onto the sample was 6 mW. Each Raman spectrum was measured with an acquisition time of 30 s. Scattered light from the sample was collected in backscattering geometry [23] (through the same lens used to excite the sample), analyzed by means of a 1800 grooves/mm diffraction grating, and detected by means of a CCD cooled at 223 K. The spectral resolution was ~2 cm−1/pixel.
Femtosecond pump-probe experiments were carried out in a typical non-collinear configuration at room temperature (Fig. 2). A commercial diode-pumped Ti:Sapphire femtosecond oscillator (Mai Tai, Spectra Physics), operating at a repetition rate of 78 MHz produced pulses of ∼ 85 fs width. These pulses were stretched and then amplified by a regenerative Ti:Sapphire amplifier (Spitfire Pro, Spectra Physics), pumped by a Q-switched Nd3+:YLF laser (Empower, Spectra Physics) at 1 kHz repetition rate, and finally compressed to produce 4 mJ, 85 fs pulses at 798 nm. The amplified laser beam was divided by a beam splitter into two parts (90% transmitted and 10% reflected); the transmitted pulses were sent to an OPA (optical parametric amplifier, TOPAS-C, Spectra Physics) that provided 90 fs pump pulses, tunable in a broad spectral range (290 – 2600 nm). The pump beam crossed a depolarizer, then an optical chopper and eventually it was focused onto the sample. The pump pulses (E ≃ 5μJ pulse−1) were focused onto a spot of ≃ 100 μm diameter, yielding excitation densities of ~ 5 × 10¹⁴ photon pulse−1 cm−2. The beam reflected by the beam splitter after the output of the Ti:Sapphire regenerative amplifier was time delayed by using a variable optical delay line and then it was focused onto a CaF2 crystal to generate a white light continuum (WLC) in a broad spectral range (450 – 800 nm). WLC was used as a probe and focussed onto the sample within the pump spot area. After passing through the sample, the WLC was detected using a fiber-coupled CCD spectrometer. The time resolution of the experiment was obtained by the width of the temporal cross correlation between pump and probe pulses (≃ 200 fs). For each transient absorption measurement the chromatic aberrations were significantly reduced using a chirp correction software procedure.
Fig. 2.
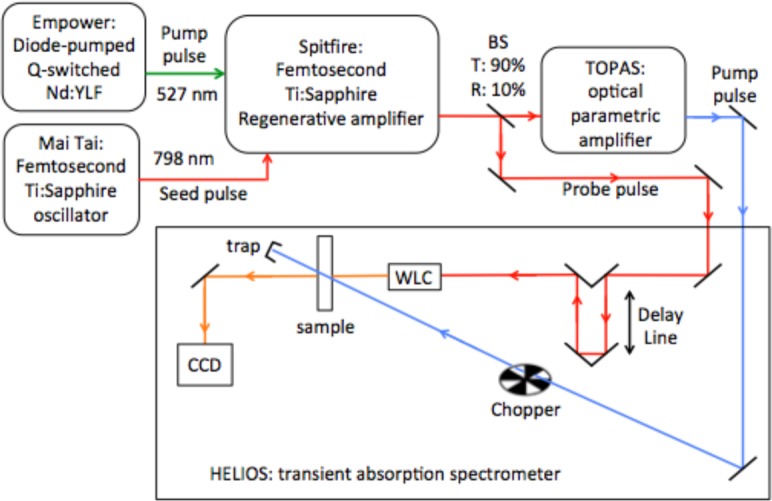
Schematic representation of experimental pump & probe setup used; WLC is a CaF2 non-linear crystal used to generate the white light supercontinuum probe beam.
3. Results and discussion
Figure 1 displays the normalized absorbances at room temperature of synthetic eumelanin suspensions in two different solvents: HPLC-grade water and DMSO-methanol mixture (1 : 20 ratio). Both suspensions are characterized by a strong absorption in the UV spectral region and by a monotonic decrease at increasing wavelengths. Such a profile has been deeply investigated and partially attributed to scattering and electronic effects at the molecular level [6]. Accordingly to these spectra, FTA measurements have been carried out pumping the suspensions between 300 and 500 nm and probing over the entire visible range.
3.1. Theory of IRS involved in FTA measurements
To fully understand the main contributions in the FTA measurements on eumelanin suspensions, it is worth mentioning how the IRS process is involved in a transient absorption experiment. The IRS is well described by the generalized Kramers-Heisenberg dispersion formula [24]. The depletion of the pump beam is consequent to the emission of a pump photon (gain process) into the probe beam at Stokes frequencies. On the contrary, a probe beam photon annihilation (loss process) at the anti-Stokes frequencies is due to the emission of a probe photon into the pump beam [25]. If Stokes and anti-Stokes frequencies fall into the white light supercontinuum frequency range, Raman peaks can be observed when the time delay between pump and probe pulses, τ, is around zero, i.e. when the two pulses are temporally overlapped.
In this temporal window it can be demonstrated that if |ħωprobe − ħωpump|= ħωv (where ωv is the angular frequency of a vibrational mode of the molecule), a loss in the probe pulse intensity at the anti-Stokes frequency can be achieved, provided that ħωprobe − ħωpump > 0; conversely, a gain in the probe pulse intensity at Stokes frequency can occur when ħωprobe − ħωpump < 0 [26]. The loss and gain processes can be explained considering that the Raman gain spectrum is proportional to the opposite of the imaginary part of the third order susceptibility, ℑ(χ(3)) [27] and that ℑ(χ(3)) > 0 at anti-Stokes frequencies while ℑ(χ(3)) < 0 at Stokes frequencies [2]. In this way, an increase (decrease) of the probe intensity at Stokes (anti-Stokes) frequencies is experienced due to the IRS process [28]. In a FTA experiment, the variation in the probe intensity at particular time delay and energy is proportional to the opposite of the intensity change due to the IRS process:
| (1) |
where is defined as the difference between the transmitted intensity in absence and in presence of the pump pulse, respectively. In the transient absorption experiments the measured differential absorption is defined as:
| (2) |
So, due to IRS, taking into account Eq. (1), ΔA is positive at anti-Stokes frequencies and negative at Stokes frequencies. In the next session we will link the IRS effect to the solvent used in the two suspensions through clear experimental evidences.
3.2. Identification of solvent Raman features in the FTA spectral domain
In order to distinguish the sample response from the solvent contribution in FTA measurements, Raman spectra of both solvents were collected (only DMSO-methanol Raman spectrum is shown here, Fig. 3(a)).
Fig. 3.
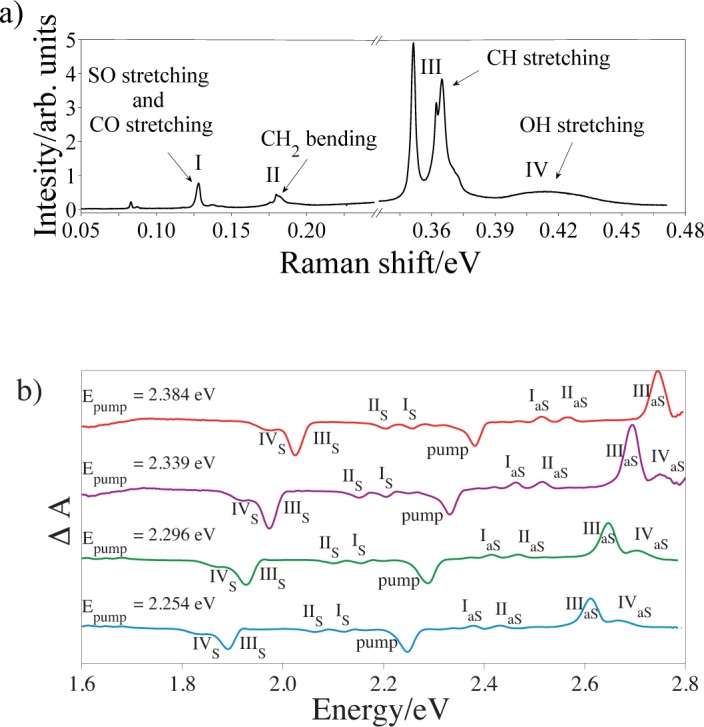
a) DMSO-methanol (ratio 1 : 20) Raman spectrum pumped with 488 nm Ar+ laser line (Pincident ≃ 6 mW), 30 s acquisition time. b) Transient absorption spectra of synthetic eumelanin obtained with different pump photon energies and detected at τ ~ 0 in DMSO-methanol (ratio 1 : 20) suspension. The curves have been vertically shifted for clarity.
The Raman spectrum of DMSO-methanol mixture is dominated by three narrow peaks, centered at 0.352, 0.361 and 0.365 eV, respectively. These are due to CH stretching vibrations in both methanol (0.352 and 0.365 eV for symmetric and antisymmetric mode, respectively) and DMSO (0.361 eV). The broad Raman band at 0.414 eV is associated to OH stretching mode in methanol. Furthermore, the weakest peak at 0.125 eV is related to CO and SO stretching modes in methanol and in DMSO, respectively. The feature at 0.177 eV is due to the bending of CH2 bond in methanol [29–31].
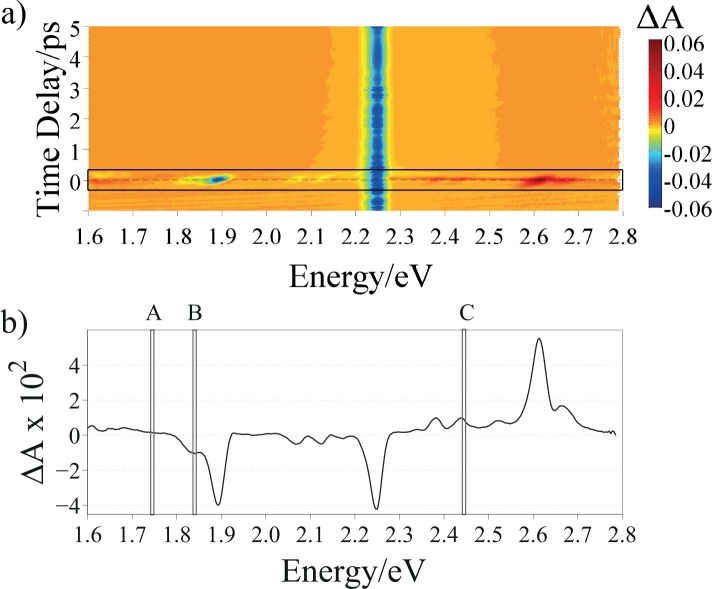
Performing FTA measurements on eumelanin suspension in the mentioned solvents, we found a unique correspondence between the Raman peaks shown in Fig. 3(a) and the spectral features observed at ultrashort time delays in Fig. 3(b). In particular, feature I corresponds to the convolution of the CH stretching modes, feature II to the OH stretching mode, feature III to the CH2 bending mode, and feature IV to the CO and SO stretching modes. According to IRS theory, all the Stokes peaks (labelled from IS to IVS) shown in Fig. 3(b) display a negative ΔA, while the anti-Stokes peaks (labelled from IaS to IVaS) experience a positive ΔA.
As further proof of the Stokes/anti-Stokes nature of the coherent artifact encountered, the spectral evolution of the signal at τ ≃ 0 has been analyzed at different excitation energies. As shown in Fig. 3(b), if the pump laser energy increases, the spectral features appear at higher energies too, maintaining a constant energy difference ΔE that is equal to the Raman shift observed in Fig. 3(a). This uniform energy shift clearly and irrefutably prove that the observed coherent artifact originates from a Raman scattering process.
3.3. Decoupling of IRS and FTA dynamics
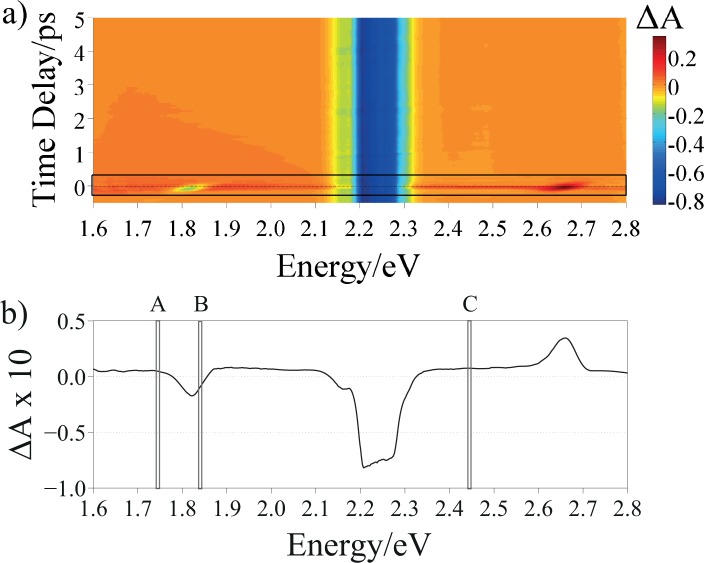
According to the explanation given before on the IRS in section 3.1 and looking at the energies of the solvent Raman peaks, we decided to excite the suspensions at 2.254 eV, in order to have both Stokes and anti-Stokes features falling in the range of the WLC probe. Figure 4 shows the 3D matrix of FTA for synthetic eumelanin in DMSO-methanol suspension. In this matrix, energies of the probe pulse are reported on the x-axes, time delays on the y-axes, and transient differential absorption signal on the z-axes. In this way, the influence of the IRS effect on the temporal dynamics can be analyzed. The corresponding matrix for the eumelanin dispersed in HPLC-grade water is reported in Fig. 5.
Fig. 4.
a) ΔA 3D matrix of synthetic eumelanin in DMSO-methanol suspension excited at 2.254 eV: probe energy on the x-axes, time delay on the y-axes and differential absorption on the z-axes; the black rectangle highlights the region around τ = 0, whose spectrum is reported in b). The A, B and C regions in b) indicate the energies at which the transient absorption dynamics has been probed and shown in Figs. 6(A), 6(B) and 6(C), respectively.
Fig. 5.
a) ΔA 3D matrix of synthetic eumelanin in HPLC-grade water suspension excited at 2.254 eV: probe energy on the x-axes, time delay on the y-axes and differential absorption on the z-axes; the black rectangle highlights the region around τ = 0, whose spectrum is reported in b). The A, B and C regions in b) indicate the energies at which the transient absorption dynamics has been probed and shown in Figs. 7(A), 7(B) and 7(C), respectively.
The highest intensity FTA features in Figs. 4(a) and 5(a), according to the colormap scale, are due to the laser light diffused by the sample holder.
To compare the eumelanin dynamics in the two solvents, the same probing energies were chosen. Specifically, the OH bond stretching, which is common to both solvents was taken as a reference point. Thus, we chose to probe the samples at: (i) ħωprobe=1.741 eV (IRS-free region), (ii) ħωprobe=1.823 eV, (in between the Stokes peak and the energy of the pump pulse) and, eventually (iii) ħωprobe=2.460 eV (in between the energy of the pump pulse and the anti-Stokes peak). By doing so, it was possible to give a clear explanation of the different contributions affecting the sample dynamics, as explained later. The aforementioned probing energies are highlighted as A, B and C respectively, in Figs. 4(b) and 5(b) where the spectral evolution of ΔA(τ ≃ 0) is shown.
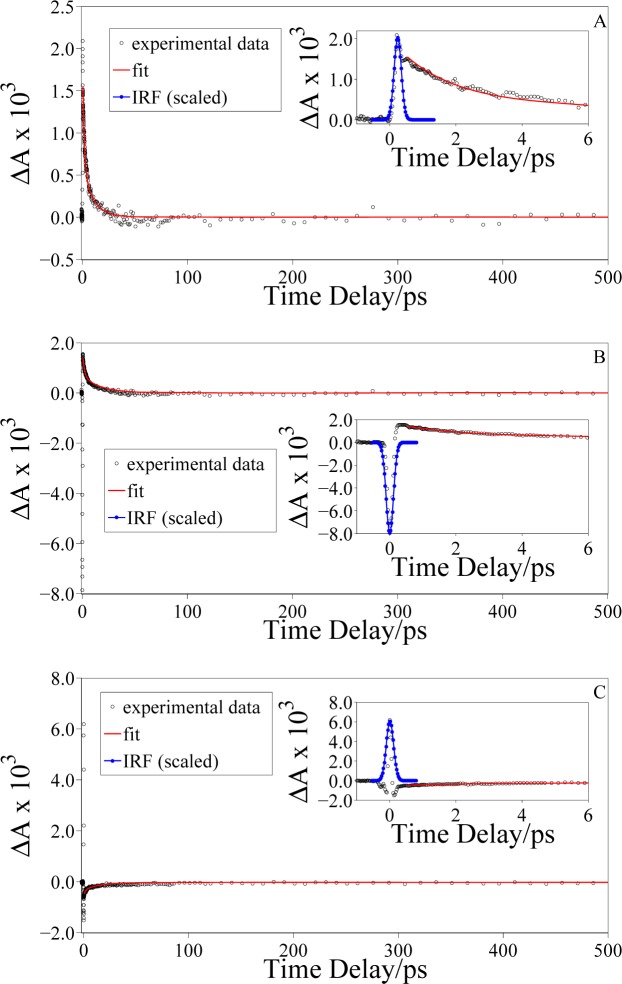
The FTA dynamics reported in Fig. 6(A) is obtained by pumping the eumelanin sample at 2.254 eV and probing it at 1.741 eV (region A in Fig. 4(b)). The eumelanin suspension exhibits a positive ΔA signal, which is indicative of photoinduced absorption. In fact, this signal can be associated to an excited state absorption (ESA) process where, upon pump excitation, optically allowed transitions to higher excited states may occur [32]. The fitting routine produced a bi-exponential decay which is in strong agreement with the experimental data (solid red line in the graph); the decay time constants (see Table 1) are in total agreement with the results previously reported in literature [33].
Fig. 6.
Transient absorption dynamics of synthetic eumelanin in DMSO-methanol suspension excited at 2.254 eV and probed at: (A) 1.741 eV (ħωprobe < ħωStokes), (B) 1.823 eV (ħωStokes < ħωprobe < ħωpump), and (C) 2.460 eV (ħωpump < ħωprobe < ħωanti–Stokes). The red lines are the result of a fitting procedure using a bi-exponential decay function; the blue line is the measured IRF.
Table 1.
Decay times of synthetic eumelanin suspensions in DMSO-methanol and HPLC-grade water, both excited at 2.254 eV and obtained from the fitting procedure for the dynamics reported in Figs. 6(A), 6(B) and 6(C) and Figs. 7(A), 7(B) and 7(C), respectively.
| fitting routine parameters
| |||
|---|---|---|---|
| solvent | probe energy (eV) | τ1 (ps) | τ2 (ps) |
|
|
|
|
|
| DMSO-methanol | 1.741 | 1.5 ± 0.2 | 10.1 ± 0.9 |
| 1.823 | 1.6 ± 0.3 | 16.9 ± 1.4 | |
| 2.460 | 1.5 ± 0.1 | 15.3 ± 1.2 | |
|
|
|
|
|
| HPLC-grade water | 1.741 | 1.3 ± 0.4 | 15.2 ± 0.8 |
| 1.823 | 1.3 ± 0.2 | 13.7 ± 1.1 | |
| 2.460 | 1.5 ± 0.3 | 10.4 ± 1.4 | |
We then probed the dynamics of the sample at 1.823 eV, in between the Stokes and laser peak energies (region B in Fig. 4(b)). An initial negative ΔA is observed, followed by a steep rise and a subsequent bi-exponential decay. In this pump-probe configuration, the detected dynamics results from two different contributions: absorption by eumelanin pigment and solvent Raman scattering. The first contribution occurs at each (positive) time delay between the pump and probe pulses, and consists of a positive ΔA (photoinduced absorption) because the transmitted probe light in the presence of the pump pulse is lower than the one transmitted without sample excitation. The second contribution, i.e. the Raman scattering, occurs only in the first few hundreds fs, when pump and probe pulses are temporally overlapped. Since ħωStokes < ħωprobe < ħωpump, the IRS leads to an emission of radiation by the sample, as described by the theoretical models [25]. As this emission process can be seen as an increase of the transmitted probe light in the FTA measurement, a negative ΔA signal is observed. Therefore, the FTA dynamics can be explained considering that in the first few hundreds fs the ΔA signal is mainly affected by the solvent Raman scattering, because it is much more intense than the eumelanin signal. As soon as the probe pulse separates temporally from the pump pulse, the nonlinear artifact does not occur anymore and the eumelanin absorption becomes the only contribution, leading to a positive ΔA signal. The sample then relaxes to the ground state in a bi-exponential way.
In Fig. 6(C) the dynamics of synthetic eumelanin in DMSO-methanol suspension probed at 2.460 eV (region C in Fig. 4(b)) is reported. When probing the eumelanin dynamics at energies higher than the pump one, a bleaching process can be observed at each positive time delay. In this case a fraction of the molecules in the ground state has been promoted to an excited energy level through the action of the pump beam. This process depletes the ground state and hence the transmitted probe intensity in the presence of the pump laser pulse is higher than the one transmitted in absence of excitation. This bleaching process explains why the dynamics shown in Fig. 6(C) presents a negative transient absorption signal. However, the ground state bleaching does not explain the positive peak detected in the first hundreds fs. This feature at ultrashort time delays can be understood only if we take into account a second contribution coming from IRS process. Since ħωpump < ħωprobe < ħωanti−Stokes, the IRS artifact causes a photon loss in the probe pulse, resulting in an apparent increase of the absorbance, thus justifying the positive ΔA signal. In the first hundreds fs, pump and probe pulses are temporally overlapped fulfilling the requirements for the IRS effect. After that, the eumelanin pigments bleaching process becomes predominant, and this leads to a negative ΔA signal which recovers bi-exponentially (solid red line in the graph).
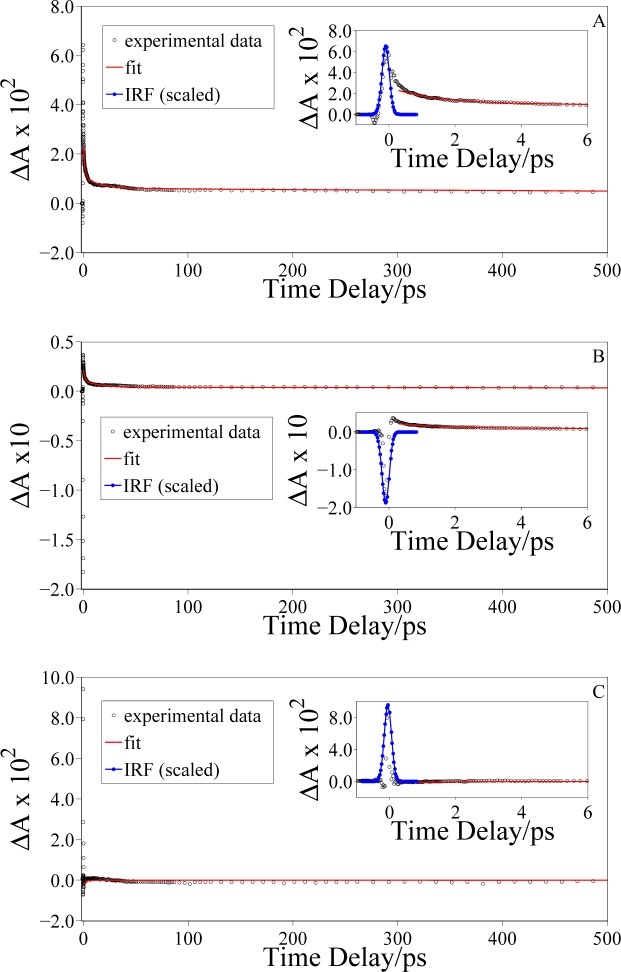
The time constants of the decays obtained from the fitting routine for the three FTA dynamics are comparable among them, within experimental error (see Table 1). This evidence clearly demonstrates that the inverse Raman scattering essentially influences the amplitude and the sign of transient absorption only at very short time delays, but it does not significantly alter the intrinsic relaxation dynamics of the eumelanin.
The same measurements for the eumelanin suspension in HPLC-grade water are reported in Fig. 7. It is worth noting that the temporal evolution of the FTA signal is the same as the one reported for the eumelanin pigment suspended in DMSO-methanol. The IRS influences the FTA measurements in the same way because of the Raman response of the solvent, in particular owing to the stretching of OH bond, as pointed out previously. The analysis performed on the transient absorption spectra in the HPLC-grade water suspension provides time constants that are comparable to the ones estimated for eumelanin suspension in DMSO-methanol. This leads us to one of the conclusions of this work: the photo-physics of eumelanin is not affected by the solvent used, and its relaxation pathways are unaffected by the surrounding environment.
Fig. 7.
Transient absorption dynamics of synthetic eumelanin in HPLC-grade water suspension excited at 2.254 eV and probed at: (A) 1.741 eV (ħωprobe < ħωStokes), (B) 1.823 eV (ħωStokes < ħωprobe < ħωpump), and (C) 2.460 eV (ħωpump < ħωprobe < ħωanti–Stokes). The red lines are the result of a fitting procedure using a bi-exponential decay function; the blue line is the measured IRF.
3.4. IRS-free FTA eumelanin dynamics
In order to measure the intrinsic dynamics of eumelanin, we performed additional measurements at different pump and probe wavelengths (Fig. 8). In particular, we set the pump energy at 4.133 eV to take advantage of high eumelanin absorption (Fig. 1), and we tuned the probe energy at 2.480 eV to avoid Raman scattering artifacts. In this case, we fitted the experimental curves by using a convolution function C(t) between the instrumental response R(t) and a sample response S(t):
| (3) |
Fig. 8.
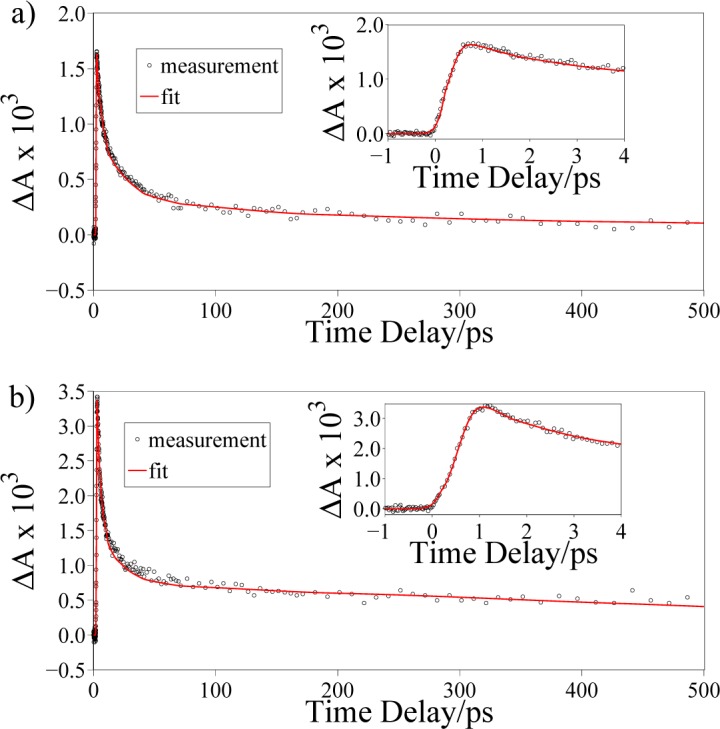
Transient absorption dynamics of synthetic eumelanin in (a) DMSO-methanol solution and (b) HPLC-grade water, respectively, both obtained exciting at 4.133 eV and probing at 2.480 eV; the red solid lines are the result of the fitting routine. The insets show the short time delay dynamics.
The instrumental response function (IRF) R(t) is assumed to be a Gaussian, [34]:
| (4) |
where σ is related to the experimental full width at half maximum (FWHM) of the cross correlation between pump and probe pulses according to the equation .
The sample response S(t) is a bi-exponential decay function with time constants τi and amplitudes Ai (i=1,2):
| (5) |
Figure 8 shows that a two-exponential function satisfactory fits the experimental data. On the other hand, a three-exponential function has also been used to fit the absorption decay in Ref. [33] for similar melanin samples. We attribute this discrepancy to a different chemical composition and protein content between our samples (synthetic eumelanin) and those investigated in Ref. [33] (eumelanin from Sepia officinalis and pheomelanin).
The decay times in Table 2 are different from those reported in Table 1. The differences can be explained taking into account the monotonic decrease of the static absorption spectrum of eumelanin pigments. Pumping at lower energies, different excited states are involved, leading to different decay times. In particular, pumping at lower energies gives access to fewer deexcitation pathways, and this could reflect in longer decay times. To deeper investigate this effect more measurements, performed at different pumping energies, would be required, but this is beyond the scope of this work.
Table 2.
Parameters obtained from the fitting procedure of the eumelanin transient absorption dynamics in Fig. 8
| fitting routine parameters | ||||
|---|---|---|---|---|
| solvent | pump energy (eV) | probe energy (eV) | τ1 (ps) | τ2 (ps) |
| DMSO-methanol | 4.133 | 2.480 | 3.5 ± 0.2 | 35 ± 4 |
| HPLC-grade water | 4.133 | 2.480 | 3.3 ± 0.1 | 40 ± 5 |
4. Conclusions
In this paper the inverse Raman scattering in synthetic eumelanin suspensions of different solvents was investigated by means of femtosecond transient absorption spectroscopy. We studied how IRS affects the temporal evolution of FTA and presented eumelanin dynamics free of this coherent artifact. Tuning appropriately pump and probe pulses over the entire UV-Vis range, we thoroughly investigated how the transient absorption of synthetic eumelanin solutions evolves in time after photoexcitation. We found that at specific probe energies the sample transient absorption signal shows an intense peak in the first hundreds of femtoseconds. The peak sign, due to nonlinear interaction between pump and probe pulses, could be related to emission or absorption of photons at Stokes and anti-Stokes frequencies, respectively. The same IRS features were observed in the dynamics of eumelanin collected in both DMSO-methanol and HPLC-grade water suspensions, even though they showed different spectral features. Through application of fitting routines, we demonstrated that IRS did not affect the eumelanin decay times. Moreover, we showed that the surrounding environment does not change the relaxation pathways since equivalent time decays were recorded for both solvents. Furthermore, by selecting suitable pump and probe energies we were able to avoid the Raman features and measure the intrinsic transient absorption dynamics of eumelanin. Eventually, we fitted our experimental data and evaluated the typical relaxation times of synthetic eumelanin in DMSO-methanol and HPLC-grade water suspensions.
Acknowledgments
This research was partially supported by Regione Puglia, project “Reti di Laboratori Pubblici di Ricerca” prog. cod. 20.
References and links
- 1.Lau A., Werncke W., Pfeiffer M., Lenz K., Wingmann H. J., “Inverse Raman scattering,” Sov. J. Quant. Electron. 6, 402–408 (1976). 10.1070/QE1976v006n04ABEH011129 [DOI] [Google Scholar]
- 2.Boyd R., Nonlinear Optics, 3rd ed. (Academic Press, 2008). [Google Scholar]
- 3.Szymanski H. A., Raman Spectroscopy: Theory and Practice (Springer US, 1970). 10.1007/978-1-4684-3027-1 [DOI] [Google Scholar]
- 4.Jones W. J., Stoicheff B. P., “Inverse Raman spectra: induced absorption at optical frequencies,” Phys. Rev. Lett. 13, 657–660 (1964). 10.1103/PhysRevLett.13.657 [DOI] [Google Scholar]
- 5.Nordlund J. J., Boissy R. E., Hearing V. J., King R. A., Oetting W. S., Ortonne J. P., The Pigmentary System, 2nd ed. (Blackwell publishing, 2006). 10.1002/9780470987100 [DOI] [Google Scholar]
- 6.Meredith P., Sarna T., “The physical and chemical properties of eumelanin,” Pigment Cell Research 19, 572–594 (2006). 10.1111/j.1600-0749.2006.00345.x [DOI] [PubMed] [Google Scholar]
- 7.Bridelli M. G., Ciati A., Crippa P. R., “Binding of chemicals to melanins re-examined: Adsorption of some drugs to the surface of melanin particles,” Biophys. Chem. 119, 137–145 (2006). 10.1016/j.bpc.2005.06.004 [DOI] [PubMed] [Google Scholar]
- 8.Hong L., Liu Y., Simon J. D., “Binding of metal ions to melanin and their effects on the aerobic reactivity,” Photochem. Photobiol. 80, 477–481 (2004). 10.1562/2004-05-17-RA-172.1 [DOI] [PubMed] [Google Scholar]
- 9.Samokhvalov A., Liu Y., Simon J. D., “Characterization of the Fe(III)-binding site in Sepia eumelanin by resonance Raman confocal microspectroscopy,” Photochem. Photobiol. 80, 84–88 (2004). 10.1562/2004-01-18-RA-047.1 [DOI] [PubMed] [Google Scholar]
- 10.Capozzi V., Perna G., Carmone P., Gallone A., Lastella M., Mezzenga E., Quartucci G., Ambrico M., Augelli V., Biagi P. F., Ligonzo T., Minafra A., Schiavulli L., Pallara M., Cicero R., “Optical and photoelectronic properties of melanin,” Thin Solid Films 511–512, 362–366 (2006). 10.1016/j.tsf.2005.12.065 [DOI] [Google Scholar]
- 11.LinhTran M., Powell B. J., Meredith P., “Chemical and structural disorder in eumelanins: a possible explanation for broadband absorbance,” Biophys. J. 90, 743–752 (2006). 10.1529/biophysj.105.069096 [DOI] [PMC free article] [PubMed] [Google Scholar]
- 12.Perna G., Palazzo G., Mallardi A., Capozzi V., “Fluorescence properties of natural eumelanin biopolymer,” J. Lumin. 131, 1584–1588 (2011). 10.1016/j.jlumin.2011.03.055 [DOI] [Google Scholar]
- 13.Meredith P., Powell B. J., Riesz J., Nighswander-Rempel S. P., Pederson M. R., Moore E. G., “Towards structure-property-function relationships for eumelanin,” Soft Matter 2, 37–44 (2006). 10.1039/B511922G [DOI] [PubMed] [Google Scholar]
- 14.Perna G., Frassanito M.C., Palazzo G., Gallone A., Mallardi A., Biagi P. F., Capozzi V., “Fluorescence spectroscopy of synthetic melanin in solution,” J. Lumin. 129, 44–49 (2009). 10.1016/j.jlumin.2008.07.014 [DOI] [Google Scholar]
- 15.Nofsinger J. B., Ye T., Simon J. D., “Ultrafast Nonradiative Relaxation dynamics of Eumelanin,” J. Phys. Chem. B 105, 2864–2866 (2001). 10.1021/jp004045y [DOI] [Google Scholar]
- 16.Piletic I. R., Matthews T. E., Warren W. S., “Estimation of molar absorptivities and pigment sizes for eumelanin and pheomelanin using femtosecond transient absorption spectroscopy,” J. Chem. Phys. 13, 181106 (2009). 10.1063/1.3265861 [DOI] [PMC free article] [PubMed] [Google Scholar]
- 17.Piletic I. R., Matthews T. E., Warren W. S., “Probing near infrared photo- relaxation pathways in Eumelanins and Pheomelanins,” J. Phys. Chem. A. 114, 11483–11491 (2010). 10.1021/jp103608d [DOI] [PMC free article] [PubMed] [Google Scholar]
- 18.Matthews T. E., Piletic I. R., Selim M. A., Simpson M. J., Warren W. S., “Pump-Probe imaging differentiates melanoma from Melanocytic Nevi,” Sci. Transl. Med. 3, 71–89 (2011). 10.1126/scitranslmed.3001604 [DOI] [PMC free article] [PubMed] [Google Scholar]
- 19.Matthews T. E., Wilson J. W., Degan S., Simpson M. J., Jin J. Y., Zhang J. Y., Warren W. S., “In vivo and ex vivo epi-mode pump-probe imaging of melanin and microvasculature,” Biomed. Opt. Express 2, 1576–1583 (2011). 10.1364/BOE.2.001576 [DOI] [PMC free article] [PubMed] [Google Scholar]
- 20.Godfrey T. J., Yu Hui, Ullrich S., “Investigation of electronically excited indole relaxation dynamics via photoionization and fragmentation pump-probe spectroscopy,” J. Chem. Phys. 141, 044314 (2014). 10.1063/1.4890875 [DOI] [PubMed] [Google Scholar]
- 21.Simpson M. J., Wilson J. W., Robles F. E., Dall C. P., Glass K., Simon J. D., Warren W. S., “Near-Infrared Excited State Dynamics of Melanins: The Effects of Iron Content, Photo-Damage, Chemical Oxidation, and Aggregate Size,” J. Phys. Chem. A 118, 993–1003 (2014). 10.1021/jp4107475 [DOI] [PMC free article] [PubMed] [Google Scholar]
- 22.Simpson M. J., Wilson J. W., Phipps M. A., Robles F. E., Selim M. A., Warren W. S., “Nonlinear Microscopy of Eumelanin and Pheomelanin with Subcellular Resolution,” J. Invest. Dermatol. 133, 1822–1826 (2013). 10.1038/jid.2013.37 [DOI] [PMC free article] [PubMed] [Google Scholar]
- 23.Shriver D. F., Dunn J. B. R., “The Backscattering Geometry for Raman Spectroscopy of Colored Materials,” Appl. Spectrosc. 28, 319–323 (1974). 10.1366/000370274774332371 [DOI] [Google Scholar]
- 24.Roslyak O., Marx C. A., Mukamel S., “Generalized Kramers-Heisenberg expressions for stimulated Raman scattering and two-photon absorption,” Phys. Rev. A 79, 638271 (2009). 10.1103/PhysRevA.79.063827 [DOI] [PMC free article] [PubMed] [Google Scholar]
- 25.Mallik B., Lakhsmanna A., Umapathy S., “Ultrafast Raman loss spectroscopy (URLS): instrumentation and principle,” J. Raman Spectrosc. 42, 1883–1890 (2011). 10.1002/jrs.2996 [DOI] [Google Scholar]
- 26.Ploetz E., Laimgruber S., Berner S., Zinth W., Gilch P., “Femtosecond stimulated Raman microscopy,” Appl. Phys. B 87, 389–393 (2007). 10.1007/s00340-007-2630-x [DOI] [Google Scholar]
- 27.Sun Z., Lu J., Zhang D. H., Lee S. Y., “Quantum theory of (femtosecond) time-resolved stimulated Raman scattering,” J. Chem. Phys. 128, 144114 (2008). 10.1063/1.2888551 [DOI] [PubMed] [Google Scholar]
- 28.Rai N. K., Lakshmanna A. Y., Namboodiri V. V., Umapathy S., “Basic principles of ultrafast Raman loss spectroscopy,” J. Chem. Sci. 124, 177–186 (2012). 10.1007/s12039-012-0214-8 [DOI] [Google Scholar]
- 29.Martens W. N., Frost R. L., Kristof J., Kloprogge J. T., “Raman spectroscopy of dimethyl sulphoxide and deuterated dimethyl sulphoxide at 298 and 77 K,” J. Raman Spectrosc. 33, 84–91 (2002). 10.1002/jrs.827 [DOI] [Google Scholar]
- 30.Cheng J. X., Xie X. S., Coherent Raman scattering microscopy (CRC, 2012). [Google Scholar]
- 31.Ellis A., Zehentbauer F. M., Kieferab J., “Probing the balance of attraction and repulsion in binary mixtures of dimethyl sulfoxide and n-alcohols,” Phys. Chem. Chem. Phys. 15, 1093–1096 (2013). 10.1039/C2CP42902K [DOI] [PubMed] [Google Scholar]
- 32.Berera R., van Grondelle R., Kennis J. T. M., “Ultrafast transient absorption spectroscopy: principles and application to photosynthetic sytems,” Photosynth. Res. 101, 105–118 (2009). 10.1007/s11120-009-9454-y [DOI] [PMC free article] [PubMed] [Google Scholar]
- 33.Ye T., Simon J., “Comparison of the ultrafast absorption dynamics of eumelanin and pheomelanin,” J. Phys. Chem. B 107, 11240–11244 (2003). 10.1021/jp0352837 [DOI] [Google Scholar]
- 34.Ziolek M., Lorenc M., Naskrecki R., “Determination of the temporal response function in femtosecond pump-probe systems,” Appl. Phys. B 72, 843–847 (2001). 10.1007/s003400100587 [DOI] [Google Scholar]


