Abstract
We present the first endoscopic Doppler optical coherence tomography and co-registered autofluorescence imaging (DOCT-AFI) of peripheral pulmonary nodules and vascular networks in vivo using a small 0.9 mm diameter catheter. Using exemplary images from volumetric data sets collected from 31 patients during flexible bronchoscopy, we demonstrate how DOCT and AFI offer complementary information that may increase the ability to locate and characterize pulmonary nodules. AFI offers a sensitive visual presentation for the rapid identification of suspicious airway sites, while co-registered OCT provides detailed structural information to assess the airway morphology. We demonstrate the ability of AFI to visualize vascular networks in vivo and validate this finding using Doppler and structural OCT. Given the advantages of higher resolution, smaller probe size, and ability to visualize vasculature, DOCT-AFI has the potential to increase diagnostic accuracy and minimize bleeding to guide biopsy of pulmonary nodules compared to radial endobronchial ultrasound, the current standard of care.
OCIS codes: (170.0170) Medical optics and biotechnology, (170.0110) Imaging systems, (170.4500) Optical coherence tomography, (170.2520) Fluorescence microscopy
1. Introduction
Accurate, safe, and timely diagnosis is crucial in the clinical management of suspicious CT-scan detected pulmonary nodules to guide clinical decisions and avoid further unnecessary invasive tests for patients with benign tissue. Diagnosis of pulmonary nodules relies on the evaluation of histological and/or cytological samples collected from the nodule. Depending on the proximity of nodules to the pleural surface, CT-guided transthoracic needle aspiration biopsy (TNAB) or transbronchial lung biopsy can be used for sample collection. The former has high diagnostic yield (~90%) [1, 2] but also considerable risk of complications such as pneumothorax [2, 3]. The latter is a safer approach if the nodule is accessible through a bronchus with a 60% to 70% overall diagnostic yield [4, 5].
Peripheral lung nodules are difficult to localize and biopsy bronchoscopically and therefore, they are challenging to sample clinically. Radial endobronchial ultrasound (R-EBUS) technique with rotary probes is used to localize nodules in the current standard-of-care. Although R-EBUS has proven to be a powerful technique in visualizing solid large nodules [6, 7] it often fails to detect sub-solid or small pulmonary nodules [7]. The relatively large diameter of current R-EBUS probes (1.4 mm) restricts their access to small peripheral airways. Also, R-EBUS has no Doppler capability to visualize blood flow in the airway. Thus, there is an unmet clinical need for tools that localize and guide sample collection in the peripheral airways.
Autofluorescence imaging (AFI) can provide biochemical information about tissue by visualizing fluorescent tissue components such as collagen and elastin. AFI has been implemented in commercial bronchoscopes for wide-field imaging in central airway. When illuminated by blue light, normal central airway tissue emits green autofluorescence (AF) while cancerous tissue is known to have a markedly reduced and red-shifted AF signal due to the breakdown of extracellular matrix components as well as increased absorption by blood [8]. Owing to this contrast mechanism, AFI has shown to be up to 6 times more sensitive compared to white-light bronchoscopy in detecting intraepithelial neoplastic lesions [9, 10]. The increased sensitivity comes at the cost of reduced specificity as inflammation and chronic bronchitis can also lead to reduced AF.
Optical coherence tomography (OCT) can visualize significantly (at least an order of magnitude) finer tissue structures compared to R-EBUS with 1-2 mm imaging depth penetration into tissue [11–13]. Given that the vast majority of lung cancers are epithelial in origin and that peripheral airway walls are usually thin, OCT appears to be a suitable technique for imaging small airways for early cancer detection despite its limited imaging depth. Fiber optic OCT catheters can be made very small to access and image peripheral airways endoscopically [14–18]. Also, Doppler OCT allows functional imaging of pulmonary vasculature [19]. Ex vivo studies have shown that OCT can visualize structural features associated with pulmonary nodules that precisely correlate with those in histopathology [20, 21] and by using these features trained readers can differentiate nodules from normal lung tissue with good sensitivity and specificity [22–24]. In vivo OCT can distinguish pathological grades of airway lesions by measuring epithelium thickness [25].
This work explores the guiding and localization capabilities of OCT and AFI by a small-diameter fiber-optic catheter. We use this dual modality technique, referred to as DOCT-AFI, to localize and visualize CT-detected modules in normal and abnormal airways in vivo.
2. Materials and methods
2.1 DOCT-AFI system
We have previously described our endoscopic DOCT-AFI system [14]. Briefly, the OCT subsystem is comprised of a fiber Mach-Zehnder interferometer driven by a 50.4 kHz wavelength-swept source (SSOCT-1310, Axsun Technologies Inc., Billerica, MA, USA) with 20 mW output power at 1310 nm with 100 nm bandwidth. A balanced photodetector (PDB420A, ThorLabs, Newton, NJ, USA) detects the interference of the reflections from the sample and reference arms in the OCT subsystem. The AFI subsystem uses a 445 nm semiconductor laser (CUBE 445-40C, Coherent, Santa Clara, CA, USA) as the excitation source and a photo-multiplier tube detector module (H9433-201, Hamamatsu, Japan) for the detection of collected AF emission. A custom wavelength multiplexing fiber optic rotary joint (Princetel Inc., Pennington, NJ) with an embedded dichroic mirror combines the OCT and AFI modalities into a single double-clad fiber (DCF)-based catheter. The catheter fiber optic assembly consists of a length of DCF (9/105/125-20PI, FUD-3489, Nufern, East Granby, CT, USA) spliced to beam-shaping fiber optics comprised of step-index multimode, graded-index, and angle-polished no-core fibers. A rotary-pullback drive unit scans the catheter to allow volumetric DOCT-AFI of airways up to 7 cm in length. In this work, OCT-AFI scans were acquired with rotational and pullback speeds of 25 Hz (1008 A-scans/frame) and 4 mm/s, respectively. DOCT-AFI scans that require higher density A-scans/frame were acquired with rotational and pullback speed of 12.5 Hz (4032 A-scans/frame) and 1 mm/s, respectively. Both OCT and AFI signals are collected simultaneously on a k-clocked high speed data acquisition card (ATS9350, AlazarTech, Pointe-Claire, QC, Canada). As there is no depth-encoding of the AFI signal, the AFI signal for each angular position is averaged over the duration of the OCT A-scans. Custom data acquisition software collects and processes data for immediate display.
2.2 Subjects
In this study, endobronchial (D)OCT-AFI scans were performed on 31 patients referred to the British Columbia Cancer Agency from April to December 2014 for bronchoscopy with standard radial endobronchial ultrasound (R-EBUS) examination for the evaluation of CT-detected peripheral lung nodules. The study included 19 males and 12 females aged 70.64 ± 10.27 years. The pulmonary nodules were between 6 mm and 55 mm in size measured from CT scans performed on the patients prior to bronchoscopy. In vivo (D)OCT-AFI of human subjects was approved by the Research Ethics Board of the University of British Columbia and the British Columbia Cancer Agency (H14-00695) and informed consents were obtained from all participants.
2.3 Clinical procedures
Patients underwent flexible bronchoscopy under local anesthesia applied to the upper airways and conscious sedation [25, 26]. Localization of peripheral nodules was attempted by inserting an R-EBUS probe (Olympus EU-ME1, UM-S20-17S 20 MHz Endoscopic Ultrasonic Probe, Olympus America Inc.) inside a guide sheath through the working channel of the bronchoscope into the targeted airways with or without the guidance of the virtual bronchoscopy navigation system (LungPoint Virtual Navigation System, Bronchus Medical, Inc. Mountain View, CA, USA). Representative cross-sectional R-EBUS images were collected for comparison with the results of OCT-AFI. The R-EBUS probe was then retracted leaving the guide sheath in place to form a positionally-defined extended working channel to the nodule for subsequent (D)OCT-AFI and histological/cytological sample collections. Saline flushing and suctioning were applied to the airways before imaging to reduce the effects of bronchial secretions and blood in the field. (D)OCT-AFI scans were carried out on lesions by advancing the catheter through the R-EBUS guide sheath. (D)OCT-AFI pullbacks covered the airway regions identified by R-EBUS. For the majority of the cases, (D)OCT-AFI scans were also carried out on normal, adjacent or contralateral airways, based on CT-scans and/or R-EBUS imaging prior to optical imaging. In some cases multiple scans were performed over the same region to ensure reproducibility of imaging. When clinically indicated, following removal of the catheter, histological and/or cytological samples were collected. The OCT-AFI scans added 5 to 10 minutes to the standard procedure time and all patients tolerated the procedure well with no adverse effects.
2.4 Data analysis
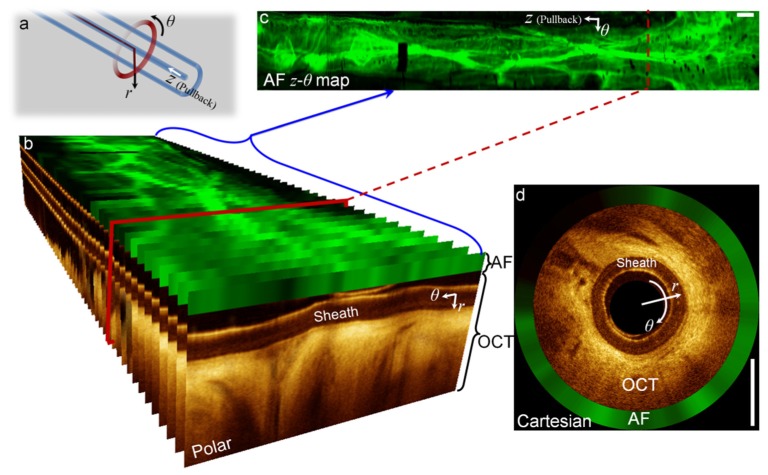
Figure 1 shows the scanning geometry of imaging and the presentation of OCT and AFI data. As the catheter’s fiber assembly spins, AFI and OCT data sets are acquired simultaneously in polar coordinates where r and θ are the depth and azimuthal coordinates as shown in Fig. 1(a). Three-dimensional OCT scans are created by pulling back catheter’s fiber assembly along the z-axis. Figure 1(b) shows an example OCT-AFI volume with the OCT frames presented in polar coordinates with the AFI data overlaid above each OCT frame. A pseudo en face AF z-θ map is shown in Fig. 1(c). We note that the en face label is a misnomer as θ is an angular coordinate. Frames in polar coordinates can be transformed to Cartesian coordinates as illustrated in Fig. 1(d) with the AFI data set presented on the outer edge of the OCT image.
Fig. 1.
OCT-AFI image presentation: (a) coordinate system defined with respect to the catheter tip, (b) OCT-AFI frames along the pullback presented in polar coordinates, en face AFI z-θ image, and (d) an OCT-AFI frame presented in Cartesian coordinates. Scale-bars are 1mm.
Doppler overlays are created by analyzing the OCT data stream using the Kasai velocity estimator to evaluate the Doppler phase shift between A-scans in each frame (intra-line color Doppler algorithm) as described in [19]. Color Doppler processing requires high-density A-scans/frame for reliable detection of slow velocities deep into the airway wall as fanning out of A-scans in the rotational scanning geometry results in larger pixel sizes in the azimuthal direction at greater depths. The Doppler phase shift calculation is averaged over 8 pixels in the radial and 32 pixels in the azimuthal scan directions. Artifact-based Doppler signal due to a combination of subject and catheter motion are largely reduced using a bulk tissue motion correction algorithm. In this algorithm, for each A-scan (n), a Doppler velocity histogram is created from the adjacent n-5 to n + 5 A-scans and the Doppler velocity of the peak of this histogram is subtracted from all Doppler velocities in the nth A-scan.
3. Results and discussion
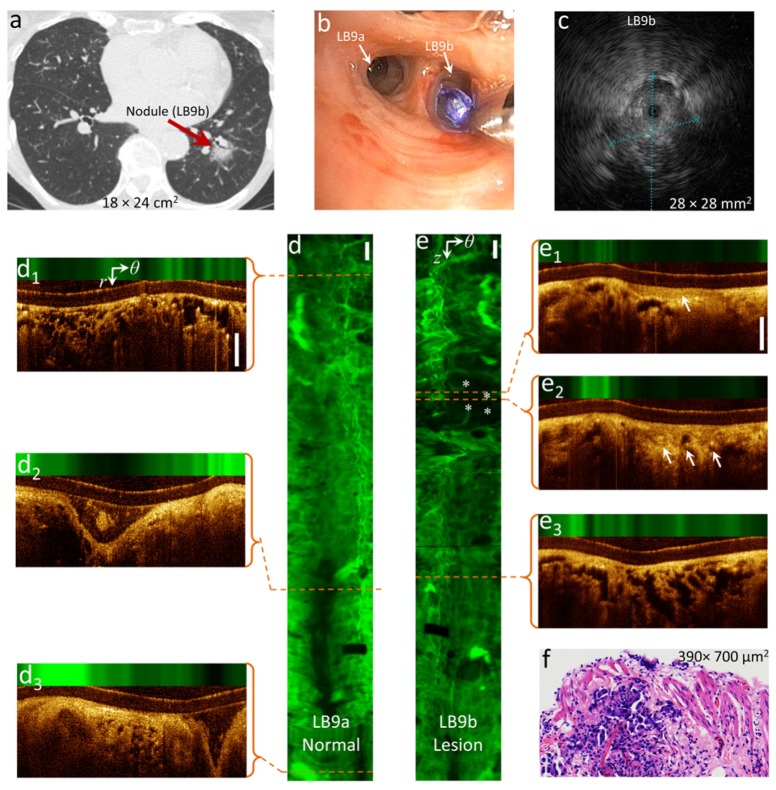
Figure 2 shows an example OCT-AFI scan from an 86 year-old female with suspected nodule in the left lung (CT scan, panel a) accessible via a segmental bronchus in the lower lobe (LB9b). An R-EBUS sonogram of the nodule is shown in panel c. AFI of a normal control airway (LB9a) and the target airway (LB9b) are shown in panels d and e with illustrative OCT sections shown in panels d1-d3 and e1-e3. The control airway shows high AF intensity along the entire imaged airway indicating healthy tissue structures containing elastin and collagen. Signal-poor AF regions in the AF image of the control airway only occur where the airway wall separates from the catheter due to branching confirmed by examining OCT sections d2 and d3. The AF segment of airway containing alveoli seen in OCT (d1) appears as a cobblestone pattern (top of panel d) due to AF from the structural proteins in the alveolar walls. In contrast to the control airway, the AF image of the target airway illustrated in panel e shows an AF signal-poor region that is not associated with an airway branchpoint. OCT sections in this region show thickened epithelium (e1) and the lack of basement membrane visualization suggestive of invasive carcinoma (e2). Comparing alveolar structures in Fig. 2(d1) and Fig. 2(e3), one can appreciate alveolar wall thickening in the target airway resembling pulmonary lepidic lesions in adenocarcinoma. Histopathology on biopsy samples collected from this site indicated invasive adenocarcinoma (panel f). Ideally, optical imaging results are compared with histological samples from exactly the same sites. However, this is difficult to accomplish in vivo with the current biopsy sample collection method, in that, beside movements of the guide sheath, the imaging is side-looking while biopsy forceps sample tissue in the forward direction along the guide sheath axis. Therefore, there is an uncertainty as to which part of the image correlates with collected biopsy samples even though they are referenced with respect to the opening of the guide sheath.
Fig. 2.
Tumor detection by OCT-AFI: (a) A nodule accessible through LB9b detected in CT-scan, (b) white-light image of LB9a and LB9b being imaged by OCT-AFI, (c) R-EBUS image of the nodule, (d, e) AF z-θ maps of the normal (LB9a) and target (LB9b) airways, respectively, the airway images are oriented distally to proximally top to bottom, (d1-d3, e1-e3) cross-sectional OCT-AFI images in the polar coordinates (r, θ) corresponding to the red dashed lines along the scans of the normal and target airways, respectively, and (f) H&E image of the biopsy sample collected from LB9b. * indicate suspicious area in the AF image (e) and arrows indicate epithelial thickening and invasive tumor in (e1) and (e2), respectively. Scale-bars are 1mm.
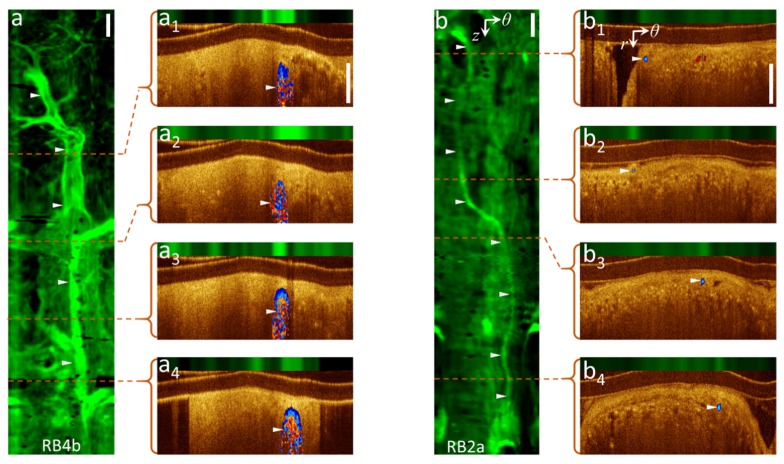
Figure 3 illustrates vasculature detection by AFI with validation by Doppler OCT. Panel a shows the AF image and illustrative OCT sections of an airway (RB4b) from a 71 year-old male. A large vessel running parallel to the airways with several smaller branching vessels is clearly visualized in the AF image. Cross-sectional Doppler OCT (a1-a4) validates these structures as blood vessels. In another case, a small vessel is detected in the AF image (panel b) of an airway (RB2a) from a 79 year-old female that correlates with the Doppler signal in the cross-sectional Doppler OCT (b1-b4). DOCT-AFI scans for these cases were performed with high density A-scans/frame and, in turn, low rotational speed as described in subsection 2.1.
Fig. 3.
Vascular network visualization by AFI with confirmation by DOCT: (a, b) AF z-θ maps of pullbacks from airways RB4b and RB2a, (a1-4, b1-4) cross-sectional DOCT-AFI frames in polar coordinates (r, θ) corresponding to the red dashed lines along the pullbacks. ► indicate vessel locations. Scale-bars are 1mm.
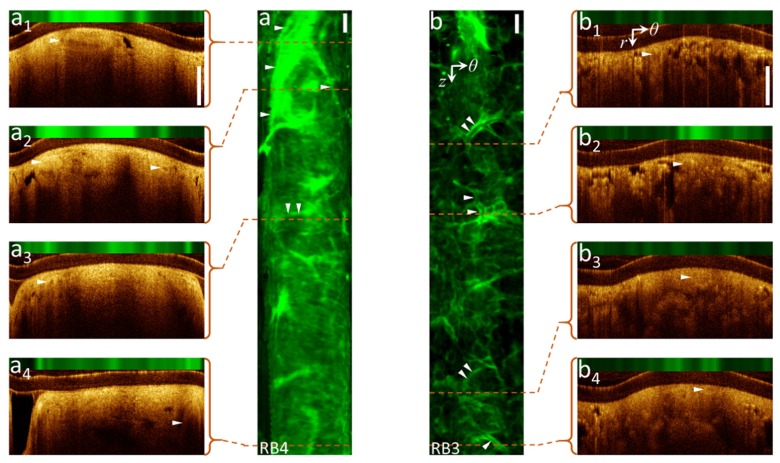
Figure 4 shows AF images of two airways (RB3 and RB4) from a 73 year-old female with several small branching vessels acquired at higher rotational speed with low-density A-line/frame (without Doppler mode). Some vascular structures can be identified in the OCT movies files Visualization 1 (32.3MB, AVI) and Visualization 2 (37.3MB, AVI) of the pullback scans – these are indicated in panels a1-a4 and b1-b4. However, these and other vessels can be clearly detected in the AF images. We hypothesize that AFI can visualize vasculature patterns in the lung periphery because the dearth of cartilage and connective tissue, leaving the relatively dense collagen and elastic tissues of blood vessel walls as the dominant fluorescent structures.
Fig. 4.
Vascular network visualization by AFI without OCT Doppler contrast: (a, b) AF z-θ maps of pullbacks from airway RB4 and RB3, (a1-4, b1-4) cross-sectional OCT-AFI in polar coordinates (r, θ) corresponding to the red dashed lines along pullbacks. Supplement files Visualization 1 (32.3MB, AVI) and Visualization 2 (37.3MB, AVI) include full OCT-AFI pullback scans of (a) and (b). ► indicate vessel locations. Scale-bars are 1mm.
AFI vascular imaging has some advantages over Doppler OCT because it does not require dense A-scans/frame and, consequently, relatively low rotational scanning. Thus, AFI can rapidly visualize in vivo vascular networks using fast scanning parameters resulting in vascular-sensitive imaging with less breathing and cardiac motion artifacts compared to Doppler OCT. Additionally, Doppler OCT is not sensitive to blood flow perpendicular to the excitation light, while the AFI visualizes fibers in the vessel walls independent of the blood flow orientation with respect to the excitation light. However, AFI vascular imaging lacks information about vessels’ blood flow rate/direction and depth resolution.
The ability to visualize vascular networks enables comparison of vascular networks in normal and abnormal airways. It is known that tumor vasculature is structurally and functionally different from normal vessels; tumor vasculature is highly disorganized with tortuous vessels, uneven diameter, and excessive branching and shunts [27]. AFI can provide a tool to study vascular remodeling due to vasculogenesis and angiogenesis processes inside aggressive tumors that may potentially enable further diagnostic ability. This tool also might find applications in studying vessel targeting/damaging treatment strategies [28] to control and maintain stable disease and for vascular research in other lung diseases such as asthma and chronic obstructive pulmonary disease.
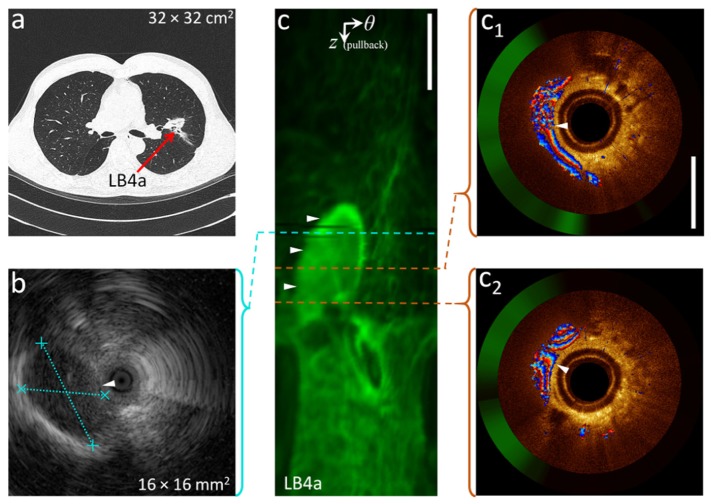
Figure 5(b) shows the R-EBUS image acquired from a 58-year old male with a suspected nodule in or adjacent to LB4a based on the CT-scan (Fig. 5(a)). Based solely on this image, clinical assessment indicated that the signal-poor region demarcated by the dashed blue lines in the R-EBUS image was the target nodule. Prior to biopsy, DOCT-AFI (Fig. 5(c) and Fig. 5(c1)-(c2)) acquired from the same site shows the structure to be a large blood vessel. In this case, to avoid the risk of severe bleeding, biopsy collection was not performed. Thus, by detecting large vessels near tissue surface, DOCT-AFI may reduce the risk of hemorrhage and resulting complications during biopsy collection. Unlike R-EBUS with no Doppler contrast (currently the only alternative imaging modality deployable in the small airways), DOCT-AFI can differentiate large blood vessels from nodules (biopsy collection is required for the latter case but is risky for the former case).
Fig. 5.
Differentiation of large blood vessels from nodules by DOCT-AFI: (a) a CT-scan showing a nodule in LB4a, (b) R-EBUS image of the nodule, (c) AF z-θ map of a pullback from the same airway site, (c1-2) cross-sectional DOCT-AFI in Cartesian coordinates corresponding to the red dashed lines along the pullback. R-EBUS and DOCT-AFI are referenced with respect to the end of the guide sheath. ► indicates vessel location. Scale-bars are 1mm.
Our group and others have proposed imaging guidance by OCT to improve biopsy site selection. The addition of co-registered AFI as a complementary imaging modality may further improve biopsy guidance over OCT alone. Further studies to quantify the ability of OCT-AFI to localize nodules and measure diagnostic yield are required to confirm this hypothesis.
5. Conclusion
We introduce (D)OCT-AFI and illustrate how this imaging technique can offer both structural and function information for the localization and management of pulmonary nodules. Exemplary images from volumetric data sets collected from a pilot study of 31 patients were presented. This study supports the safety and feasibility of DOCT-AFI for the evaluation of pulmonary nodules. We demonstrate that AFI can rapidly identify vasculature and suspicious areas along centimeters-long airway segments. Once identified, closer examination of OCT can verify if the site is appropriate for biopsy collection. Thus, (D)OCT-AFI may increase the ability to identify and locate pulmonary nodules and improve the safety of biopsy collection.
Acknowledgments
This work was supported through grants from the Natural Sciences and Engineering Research Council of Canada (NSERC) and Canadian Institutes of Health Research (CIHR). NSERC, the Michael Smith Foundation for Health Research (MSFHR), and the Lotte & John Hecht Memorial Foundation provided Postdoctoral fellowships for HP.
References and links
- 1.Lee W. J., Chong S., Seo J. S., Shim H. J., “Transthoracic fine-needle aspiration biopsy of the lungs using a C-arm cone-beam CT system: diagnostic accuracy and post-procedural complications,” Br. J. Radiol. 85(1014), e217–e222 (2012). 10.1259/bjr/64727750 [DOI] [PMC free article] [PubMed] [Google Scholar]
- 2.Gould M. K., Fletcher J., Iannettoni M. D., Lynch W. R., Midthun D. E., Naidich D. P., Ost D. E., “Evaluation of patients with pulmonary nodules: when is it lung cancer?: ACCP evidence-based clinical practice guidelines (2nd edition)”. Chest, 132(3 Suppl): p. 108S–130S (2007). [DOI] [PubMed] [Google Scholar]
- 3.Wiener R. S., Schwartz L. M., Woloshin S., Welch H. G., “Population-based risk for complications after transthoracic needle lung biopsy of a pulmonary nodule: an analysis of discharge records,” Ann. Intern. Med. 155(3), 137–144 (2011). 10.7326/0003-4819-155-3-201108020-00003 [DOI] [PMC free article] [PubMed] [Google Scholar]
- 4.Wang Memoli J. S., Nietert P. J., Silvestri G. A., “Meta-analysis of guided bronchoscopy for the evaluation of the pulmonary nodule,” Chest 142(2), 385–393 (2012). 10.1378/chest.11-1764 [DOI] [PMC free article] [PubMed] [Google Scholar]
- 5.McWilliams A., Shaipanich T., Lam S., “Fluorescence and navigational bronchoscopy,” Thorac. Surg. Clin. 23(2), 153–161 (2013). 10.1016/j.thorsurg.2013.01.008 [DOI] [PubMed] [Google Scholar]
- 6.Chen A., Chenna P., Loiselle A., Massoni J., Mayse M., Misselhorn D., “Radial probe endobronchial ultrasound for peripheral pulmonary lesions. A 5-year institutional experience,” Ann. Am. Thorac. Soc. 11(4), 578–582 (2014). 10.1513/AnnalsATS.201311-384OC [DOI] [PubMed] [Google Scholar]
- 7.Tay J. H., Irving L., Antippa P., Steinfort D. P., “Radial probe endobronchial ultrasound: factors influencing visualization yield of peripheral pulmonary lesions,” Respirology 18(1), 185–190 (2013). 10.1111/j.1440-1843.2012.02276.x [DOI] [PubMed] [Google Scholar]
- 8.Hung J., Lam S., LeRiche J. C., Palcic B., “Autofluorescence of normal and malignant bronchial tissue,” Lasers Surg. Med. 11(2), 99–105 (1991). 10.1002/lsm.1900110203 [DOI] [PubMed] [Google Scholar]
- 9.Lam S., Kennedy T., Unger M., Miller Y. E., Gelmont D., Rusch V., Gipe B., Howard D., LeRiche J. C., Coldman A., Gazdar A. F., “Localization of bronchial intraepithelial neoplastic lesions by fluorescence bronchoscopy,” Chest 113(3), 696–702 (1998). 10.1378/chest.113.3.696 [DOI] [PubMed] [Google Scholar]
- 10.Kennedy T. C., Lam S., Hirsch F. R., “Review of recent advances in fluorescence bronchoscopy in early localization of central airway lung cancer,” Oncologist 6(3), 257–262 (2001). 10.1634/theoncologist.6-3-257 [DOI] [PubMed] [Google Scholar]
- 11.Huang D., Swanson E. A., Lin C. P., Schuman J. S., Stinson W. G., Chang W., Hee M. R., Flotte T., Gregory K., Puliafito C. A., Fujimoto J. G., “Optical coherence tomography,” Science 254(5035), 1178–1181 (1991). 10.1126/science.1957169 [DOI] [PMC free article] [PubMed] [Google Scholar]
- 12.Fujimoto J. G., Brezinski M. E., Tearney G. J., Boppart S. A., Bouma B., Hee M. R., Southern J. F., Swanson E. A., “Optical Biopsy and Imaging Using Optical Coherence Tomography,” Nat. Med. 1(9), 970–972 (1995). 10.1038/nm0995-970 [DOI] [PubMed] [Google Scholar]
- 13.Tearney G. J., Brezinski M. E., Bouma B. E., Boppart S. A., Pitris C., Southern J. F., Fujimoto J. G., “In vivo endoscopic optical biopsy with optical coherence tomography,” Science 276(5321), 2037–2039 (1997). 10.1126/science.276.5321.2037 [DOI] [PubMed] [Google Scholar]
- 14.Pahlevaninezhad H., Lee A. M. D., Shaipanich T., Raizada R., Cahill L., Hohert G., Yang V. X. D., Lam S., MacAulay C., Lane P., “A high-efficiency fiber-based imaging system for co-registered autofluorescence and optical coherence tomography,” Biomed. Opt. Express 5(9), 2978–2987 (2014). 10.1364/BOE.5.002978 [DOI] [PMC free article] [PubMed] [Google Scholar]
- 15.Tan K. M., Shishkov M., Chee A., Applegate M. B., Bouma B. E., Suter M. J., “Flexible transbronchial optical frequency domain imaging smart needle for biopsy guidance,” Biomed. Opt. Express 3(8), 1947–1954 (2012). 10.1364/BOE.3.001947 [DOI] [PMC free article] [PubMed] [Google Scholar]
- 16.Lorenser D., Yang X., Kirk R. W., Quirk B. C., McLaughlin R. A., Sampson D. D., “Ultrathin side-viewing needle probe for optical coherence tomography,” Opt. Lett. 36(19), 3894–3896 (2011). 10.1364/OL.36.003894 [DOI] [PubMed] [Google Scholar]
- 17.Quirk B. C., McLaughlin R. A., Curatolo A., Kirk R. W., Noble P. B., Sampson D. D., “In situ imaging of lung alveoli with an optical coherence tomography needle probe,” J. Biomed. Opt. 16(3), 036009 (2011). 10.1117/1.3556719 [DOI] [PubMed] [Google Scholar]
- 18.Scolaro L., Lorenser D., Madore W. J., Kirk R. W., Kramer A. S., Yeoh G. C., Godbout N., Sampson D. D., Boudoux C., McLaughlin R. A., “Molecular imaging needles: dual-modality optical coherence tomography and fluorescence imaging of labeled antibodies deep in tissue,” Biomed. Opt. Express 6(5), 1767–1781 (2015). 10.1364/BOE.6.001767 [DOI] [PMC free article] [PubMed] [Google Scholar]
- 19.Lee A. M. D., Ohtani K., Macaulay C., McWilliams A., Shaipanich T., Yang V. X. D., Lam S., Lane P., “In vivo lung microvasculature visualized in three dimensions using fiber-optic color Doppler optical coherence tomography,” J. Biomed. Opt. 18(5), 050501 (2013). 10.1117/1.JBO.18.5.050501 [DOI] [PubMed] [Google Scholar]
- 20.Hariri L. P., Applegate M. B., Kenudson M. M., Mark E. J., Bouma B. E., Tearney G. J., Suter M. J., “Optical frequency domain imaging of ex vivo pulmonary resection specimens: obtaining one to one image to histopathology correlation,” J. Vis. Exp. 71, 3855 (2013). [DOI] [PMC free article] [PubMed] [Google Scholar]
- 21.Hariri L. P., Applegate M. B., Mino-Kenudson M., Mark E. J., Medoff B. D., Luster A. D., Bouma B. E., Tearney G. J., Suter M. J., “Volumetric optical frequency domain imaging of pulmonary pathology with precise correlation to histopathology,” Chest 143(1), 64–74 (2013). 10.1378/chest.11-2797 [DOI] [PMC free article] [PubMed] [Google Scholar]
- 22.Hariri L. P., Mino-Kenudson M., Applegate M. B., Mark E. J., Tearney G. J., Lanuti M., Channick C. L., Chee A., Suter M. J., “Toward the guidance of transbronchial biopsy: identifying pulmonary nodules with optical coherence tomography,” Chest 144(4), 1261–1268 (2013). 10.1378/chest.13-0534 [DOI] [PMC free article] [PubMed] [Google Scholar]
- 23.Hariri L. P., Villiger M., Applegate M. B., Mino-Kenudson M., Mark E. J., Bouma B. E., Suter M. J., “Seeing beyond the bronchoscope to increase the diagnostic yield of bronchoscopic biopsy,” Am. J. Respir. Crit. Care Med. 187(2), 125–129 (2013). 10.1164/rccm.201208-1483OE [DOI] [PMC free article] [PubMed] [Google Scholar]
- 24.Hariri L. P., Mino-Kenudson M., Lanuti M., Miller A. J., Mark E. J., Suter M. J., “Diagnosing lung carcinomas with optical coherence tomography,” Ann. Am. Thorac. Soc. 12(2), 193–201 (2015). 10.1513/AnnalsATS.201408-370OC [DOI] [PMC free article] [PubMed] [Google Scholar]
- 25.Lam S., Standish B., Baldwin C., McWilliams A., leRiche J., Gazdar A., Vitkin A. I., Yang V., Ikeda N., MacAulay C., “In vivo optical coherence tomography imaging of preinvasive bronchial lesions,” Clin. Cancer Res. 14(7), 2006–2011 (2008). 10.1158/1078-0432.CCR-07-4418 [DOI] [PMC free article] [PubMed] [Google Scholar]
- 26.Lam S., leRiche J. C., McWilliams A., Macaulay C., Dyachkova Y., Szabo E., Mayo J., Schellenberg R., Coldman A., Hawk E., Gazdar A., “A randomized phase IIb trial of pulmicort turbuhaler (budesonide) in people with dysplasia of the bronchial epithelium,” Clin. Cancer Res. 10(19), 6502–6511 (2004). 10.1158/1078-0432.CCR-04-0686 [DOI] [PubMed] [Google Scholar]
- 27.Carmeliet P., Jain R. K., “Angiogenesis in cancer and other diseases,” Nature 407(6801), 249–257 (2000). 10.1038/35025220 [DOI] [PubMed] [Google Scholar]
- 28.Carter S. K., “Clinical strategy for the development of angiogenesis inhibitors,” Oncologist 5(90001 Suppl 1), 51–54 (2000). 10.1634/theoncologist.5-suppl_1-51 [DOI] [PubMed] [Google Scholar]


