

Abstract
The Autism Tissue Program (ATP), a science program of Autism Speaks, provides researchers with access to well-characterized postmortem brain tissues. Researchers access these tissues through a peer-reviewed, project-based approval process, and obtain related clinical information from a secure, online informatics portal. However, few of these samples have DNA banked from other sources (such as a blood sample from the same individual), hindering genotype–phenotype correlation and interpretation of gene expression data derived fromthe banked brain tissue. Here, we describe an initiative to extract DNA from Brodmann Area 19, and genotype these samples using both the Affymetrix Genome-Wide Human SNP Array 6.0 and the Illumina Human1M-Duo DNA Analysis BeadChip genome-wide microarray technologies. We additionally verify reported gender, and infer ethnic background from the single nucleotide polymorphism data. We have also used a rigorous, multiple algorithm approach to identify genomic copy number variation (CNV) from these array data. Following an initial proof of principle study using two samples, 52 experimental samples, consisting of 27 subjects with confirmed or suspected autism and related disorders, 5 subjects with cytogenetically visible duplications of 15q, 2 with epilepsy and 18 age-matched normal controls were processed, yielding high-quality genotype data in all cases. The genotype and CNV data are provided via the ATP informatics portal as a resource for the autism research community.
Keywords: autism, autism spectrum disorder, brain, brodmann area 19, copy number variation, genome-wide, microarray, single nucleotide polymorphism
Introduction
Autism (MIM 209850) is a highly heterogenous, complex neurodevelopmental condition that is typified by qualitative impairment in verbal communication and reciprocal social interactions, and by restricted and stereotyped interests and behaviors. The etiology is due at least in part to genetic factors, including copy number variation (CNV) encompassing critical loci [Cook & Scherer, 2008]. Among the resources available to investigators is the Autism Tissue Program [ATP; Haroutunian & Pickett, 2007], a brain repository program of Autism Speaks. This resource is composed of a collection of donated postmortem brain tissue samples from autistic and other individuals, providing for neuroanatomical, gene expression and other studies. These samples are held at established brain banks and are made available through a project-based, peer-reviewed process. Importantly, curated clinical and demographic data are also available through a secure, online informatics portal (www.atpportal.org), along with information on ongoing and completed research projects using these samples [Brimacombe, Pickett, & Pickett, 2007].
Although these brain samples have been used for a variety of gene expression and other studies, in most cases there has been no genomic DNA available for genotype–phenotype correlation. Thus, we have undertaken to prepare genomic DNA from a subset of these case and control samples and genotype this DNA using genomewide single nucleotide polymorphism (SNP) microarrays. We have additionally interrogated these microarray data in order to identify CNV. All these data are made available to interested investigators through the ATP, ensuring data release to investigators only after review by ATP’s Tissue Advisory Board, in a similar manner to approvals granted for use of the primary tissues.
Here, we report the constitution of the initial cohort of a total of 52 subjects (27 with confirmed or suspected autism and related disorders, 5 subjects with cytogenetically visible duplications of chromosome 15q11-q13 (4 of which also had a confirmed autism diagnosis), 2 with epilepsy and 18 age-matched normal controls), quality of the derived DNA and microarray data, and SNP and CNV analysis. We also make some preliminary observations regarding CNV events involving previously identified autism susceptibility genes. The primary objective of this work, however, is to describe this resource of genotype data and report its availability to the autism research community in general.
Methods
Tissue Accrual
Postmortem tissue samples were obtained from the Harvard Brain Tissue Resource Center (HBTRC), with approval for use of these specimens granted by the ATP tissue board for Project #1299 of the Autism Tissue Program, “Autism Genome Project brain tissue genotyping initiative”. An independent request for one sample was made to the Human Brain and Spinal Fluid Resource Center at the University of California Los Angeles (UCLA). Two cases were used initially for proof-of-principle studies (AN03217 and AN12875), in order to determine feasibility of DNA extraction and microarray analysis from both frozen and formalin fixed samples fromthe same subjects. Following this initial phase, an experimental set of fiftythree samples was identified as having suitable available material for genotyping (including both proof-of-principle cases). One sample (AN17777) was subsequently found to be positive for Hepatitis C and was not processed further. Fifty-two remaining cases were obtained and processed in two batches (28 and 24 samples, respectively). Overall, samples from 13 female and 39 male subjects were studied, including 26 subjects with confirmed or suspected autism, five subjects with cytogenetically visible duplications of chromosome 15q11-q13 (four of which also had a confirmed autism diagnosis), two subjects with epilepsy, one patient with Angelman syndrome, and 18 age-matched normal controls (two of whom had sibs with autism) (Table I). The average postmortem interval was 21 hours (median 22, range 4–43.25). Gender of all donors was later confirmed with microarray genotype data.
Table I.
Case Information
| Sample ID | Diagnosis | Age of donor (yr) | Gender | Ethnicity | PMI (hours) | Brain mass (g) | Source |
|---|---|---|---|---|---|---|---|
| Proof-of-Principle Phase | |||||||
| AN03217 | Control | 19 | M | European | 18.58 | 1,555 | HBTRC |
| AN12875 | Control; autism sib | 19 | F | European | 12.52 | 880 | HBTRC |
| Experimental Phase–Batch 1 | |||||||
| AN16641 | Autism | 9 | M | European | 27 | 1,320 | HBTRC |
| AN00493 | Autism | 27 | M | European | 8.3 | 1,575 | HBTRC |
| AN00764 | Autism | 20 | M | European | 23.7 | 1,144 | HBTRC |
| AN08792 | Autism | 30 | M | European | 20.3 | 1,230 | HBTRC |
| AN12875 | Control; autism sib | 19 | F | European | 12.52 | 880 | HBTRC |
| AN01227 | Autism—suspected | 82 | M | European | 26.47 | 1,345 | HBTRC |
| AN14613 | Autism—suspected | 39 | M | European | 22.75 | 1,440 | HBTRC |
| AN08873 | Autism | 5 | M | European | 25.5 | 1,560 | HBTRC |
| AN19511 | Autism | 8 | M | European | 22.2 | 1,570 | HBTRC |
| AN11479 | PDD—not otherwise specified | 44 | F | European | 13 | 1,040 | HBTRC |
| AN01570 | Autism | 18 | F | European | 6.75 | 2,100 | HBTRC |
| AN17138 | Autism; 15q duplication | 16 | M | East Asian | Not recorded | 1,663 | HBTRC |
| AN09730 | Autism | 22 | M | European | 25 | 1,375 | HBTRC |
| AN03345 | Autism | 2 | M | European | 4 | 1,328 | HBTRC |
| AN17777 | Autism; 3p duplication | 49 | F | Not determined | 16.33 | 1,675 | HBTRC |
| AN12457 | Autism | 29 | F | European | 17.83 | Not recorded | HBTRC |
| AN11989 | Autism | 30 | M | European | 16.06 | 1,800 | HBTRC |
| AN10656 | Control; autism sib | 49 weeks | M | European | 19.42 | 520 | HBTRC |
| AN07591 | Seizures | 16 | M | African | 22 | 1,230 | HBTRC |
| AN00090 | Angelman Syndrome | 10 | F | European | 16.58 | 1,050 | HBTRC |
| AN14829 | Autism—suspected; 15q duplication | 26 | F | European | 28.67 | 1,310 | HBTRC |
| AN08166 | Autism | 28 | M | European | 43.25 | 1,580 | HBTRC |
| AN13872 | Autism | 5 | F | East Asian | 33 | 1,360 | HBTRC |
| AN09402 | Autism—suspected; 15q duplication | 11 | M | European | 10.5 | 1,540 | HBTRC |
| AN17678 | Autism | 11 | M | European | Not recorded | 1,640 | HBTRC |
| AN04682 | Autism—suspected | 15 | M | European | 23.23 | 1,370 | HBTRC |
| AN03632 | Autism—suspected | 49 | F | European | 21.08 | 1,170 | HBTRC |
| AN09714 | Autism | 60 | M | European | 26.5 | 1,210 | HBTRC |
| AN17254 | Autism | 51 | M | European | 22.16 | 1,530 | HBTRC |
| Experimental Phase–Batch 2 | |||||||
| HSB-4640 | PDD—not otherwise specified | 8 | M | European | 13.8 | 1,740 | HBSFRC |
| AN13295 | Control | 56 | M | European | 22.12 | 1,370 | HBTRC |
| AN08161 | Control | 36 | F | European | 23.83 | 1,150 | HBTRC |
| AN07444 | Control | 17 | M | European | 30.75 | 1,460 | HBTRC |
| AN03217 | Control | 19 | M | European | 18.58 | 1,555 | HBTRC |
| AN12137 | Control | 31 | M | European | 32.92 | 1,810 | HBTRC |
| AN10833 | Control | 22 | M | European | 21.47 | 1,360 | HBTRC |
| AN15594 | Control | 51 | M | European | 22.47 | 1,425 | HBTRC |
| AN14757 | Control | 24 | M | African | 21.33 | 1,490 | HBTRC |
| AN17450 | Control | 0 | M | European | 5 | 1,000 | HBTRC |
| AN01093 | Autism | 56 | M | European | 19.48 | 1,630 | HBTRC |
| AN03935 | Autism; 15q duplication | 19 | M | European | 28.08 | 1,190 | HBTRC |
| AN12240 | Control | 51 | M | European | 4.75 | 1,370 | HBTRC |
| AN16115 | Autism | 11 | F | European | 12.88 | 1,460 | HBTRC |
| AN10679 | Control | 41 | F | African | 14 | 1,310 | HBTRC |
| AN14762 | 15q duplication | 9 | M | European | 13.63 | 1,130 | HBTRC |
| AN08043 | Autism | 52 | F | European | 39.15 | 1,070 | HBTRC |
| AN11184 | Control | 64 | M | European | 27.68 | 1,250 | HBTRC |
| AN02456 | Control | 4 | F | European | 17.02 | 1,530 | HBTRC |
| AN10949 | Epilepsy | 26 | M | European | 32.75 | 1,360 | HBTRC |
| AN19760 | Control | 28 | M | European | 23.25 | 1,580 | HBTRC |
| AN07176 | Control | 21 | M | European | 29.91 | Not recorded | HBTRC |
| AN06420 | Autism | 39 | M | European | 13.95 | 1,520 | HBTRC |
| AN17425 | Control | 16 | M | European | 26.16 | 1,500 | HBTRC |
PMI, postmortem interval; HBTRC, Harvard Brain Tissue Resource Center; HBSFRC, Human Brain and Spinal Fluid Resource Center (UCLA). Gender (M: male, F: female) was confirmed, and ethnicity inferred, from genotype data in all cases except AN17777, which was not processed for DNA extraction as it was reported to be from a Hepatitis C positive donor.
Tissue was obtained from Brodmann Area 19 (BA19) dissected from frozen coronal slabs or hemispheres, using the occipital pole and the calcarine sulcus as landmarks. For the initial batch of twenty-eight experimental samples, tissue samples were classified as “good” (n=6), “fair” (n=10) or “poor” (n=12) based on qualitative assessment of tissue integrity at dissection. BA19 was chosen for (a) ease and reproducibility of dissection, (b) quantity of available tissue, and (c) relatively lower likely importance for other types of studies such as those of gene expression or neuroanatomical assessment.
DNA Extraction
Initially, we attempted to isolate DNA from both frozen and formalin-fixed tissue from each of the two proof-of-principle samples. For fixed samples, initial Proteinase K digestion did not work effectively, and we instead homogenized the tissue and rehydrated it by stepping it through washes of 100, 95 and 70% ethanol before digestion in a solution of 500 μg/mL of Proteinase K (instead of the usual 100μg/mL for frozen tissue) at 37°C on an orbital shaker. Two overnight incubations at 37°C and one full day at 55°C, each with fresh Proteinase K, were required to fully digest tissue. We then proceeded with a standard Gentra Puregene (Qiagen Inc., Germantown, MD) or alternatively a phenol:chloroform extraction protocol from the tissue lysate. The resulting DNA was re-hydrated in 10 μL of TE. Attempts to amplify this DNA with a well-established forensic microsatellite kit (Identifiler, Life Technologies Corp., Carlsbad, CA) were not successful. Application of this method to other available test samples that had been preserved for less than one month in formalin resulted in similar poor DNA yield, and only the smallest markers of the Identifiler kit (~100bp in size) could be successfully amplified.
Frozen tissue was crushed to a powder in liquid nitrogen using a mortar and pestle. We initially used a semi-automated DNA extraction procedure (Gentra Autopure LS; Qiagen Inc.). Of the first 15 samples attempted, 8 were re-purified as there appeared to be some protein carryover from the initial automated purification, and seven failed, apparently due to fatty material carried over into the isopropanol phase. These and the remainder of the experimental samples were extracted manually with a standard Gentra Puregene kit (Qiagen Inc.).
Genome-Wide Microarray Genotyping
Genotyping was performed in three phases: first, two proof of principle samples, and subsequently two experimental batches of 28 and 24 samples, respectively. All samples were processed on the Affymetrix Genome-Wide Human SNP Array 6.0. The first two proof-of-principle samples were also processed on the Illumina Human 1M DNA Analysis BeadChip, and the 52 experimental samples on the newer Illumina Human 1 M-duo. All experiments and analysis were performed at The Centre for Applied Genomics, Toronto, Canada. To infer ethnicity, samples were clustered using 1,120 SNP genotypes from the Affymetrix SNP 6.0 array, using the program STRUCTURE [Pritchard, Stephens, & Donnelly, 2000]. These SNPs were chosen from those having clear differences in minor allele frequency between HapMap populations, and were spaced at genomic distances of about 4–5Mb to avoid association between them, in an approach similar to that we have used previously [Pinto, Marshall, Feuk, & Scherer, 2007]. Two hundred and seventy HapMap samples [International HapMap Consortium, 2003], also genotyped on the Affymetrix SNP 6.0 array, were utilized as reference samples of known ancestry. ATP samples were assigned to one of the three clusters: European, African and East Asian, on the basis of a threshold of cluster membership score > 0.9.
CNV Analysis
For the two proof-of-principle samples, CNV analysis was performed using four computational algorithms for the Affymetrix data (Hidden Markov Model and segmentation algorithm from Partek Genomics Suite (www.partek.com/partekgs), Affymetrix’s Genotyping Console, and dCHIP [Lin et al., 2004]). Illumina data were analyzed using QuantiSNP [Colella et al., 2007] and iPattern [Zhang et al., manuscript submitted]. For the full set of experimental samples, in order to minimize batch effects due to the generation of microarray data in separate batches, we analyzed each group separately with an appropriate set of reference samples run at the same centre during the same time periods as the experimental samples. Illumina data were analyzed with QuantiSNP and PennCNV [Wang et al., 2007], and Affymetrix data with Affymetrix’s Genotyping Console, Birdsuite [Korn et al., 2008] and iPattern. Support from a minimum of five probes on the array was required in order to call a CNV. In accordance with recommended practice [Scherer et al., 2007], we compiled a set of “stringent” CNV calls comprised of those identified in an individual sample at the same location by more than one algorithm (Supplementary Tables I and II). Our rationale for focusing on stringent calls is their very high (>90%) validation rate by quantitative PCR [Marshall et al., 2008]. These were then compared to control data sets and annotated with our standard analysis pipeline [Pinto et al., 2010]. For one sample, AN17450, we omitted CNVs detected with Genotyping Console, as there were considerably more calls in this sample than the average (181; mean of 46). For Affymetrix data, we then compared these stringent calls to CNVs detected in a total of 2,357 control samples (1,209 male and 1,148 female), comprised of 1,123 from Northern Germany [POPGEN cohort; Krawczak et al., 2006] and 1,234 from the Ottawa Heart Institute [Stewart et al., 2009]. These controls are 99% of European origin as determined with the program STRUCTURE [Pritchard et al., 2000]. From this comparison we obtained a “rare stringent” set of CNVs detected in the ATP brain samples, where a call is defined as rare if at least 50% of its length is unique when compared with calls in the controls (Supplementary Table III). Calls with greater than 50% overlap with known segmental duplications were also excluded. For Illumina data, we used a similar approach comparing with 1,287 European controls from the SAGE study [Bierut et al., 2010] (Supplementary Table IV). Following our normal practice, three samples with the number of calls exceeding three times the standard deviation fromthe mean were excluded from these results.
Statistical Analyses
For the first batch of 28 samples, a Kruskal–Wallis nonparametric test was used to compare medians of DNA concentration or several QC metrics (Illumina SNP call rate, Affymetrix QC call rate, Affymetrix Contrast QC) for the microarray data, between the different qualitative tissue groups. As there did not appear to be any correlation between gross observation of tissue quality at dissection and subsequent DNA and array data quality, we did not pursue this approach for the subsequent batch. A Mann–Whitney test was used to compare numbers of CNVs detected by the Affymetrix and Illumina arrays.
Data Availability
Genotype data and CNV calls are available from the Autism Tissue Program via the secure Informatics Portal at www.atpportal.org. Availability of these data is subject to project-by-project review by ATP’s Tissue Advisory Board. Additionally, for ease of interpretation, CNV calls are displayed in the genome browser of the Autism Chromosome Rearrangement Database [http://projects.tcag.ca/autism; Marshall et al., 2008; Xu, Zwaigenbaum, Szatmari, & Scherer, 2004].
Results
Genotyping and CNV Analysis of Proof-of-Principle Samples
For the two POP samples, Affymetrix SNP call rates were 99.55 and 99.67%, and Illumina SNP Call Rates were 99.55 and 99.74%, respectively, indicating that these data were of sufficient quality to warrant analysis of further samples. Formalin-fixed samples from the same donors did not yield DNA of high enough quality to yield products even using a well-established forensic microsatellite marker panel (data not shown). Accordingly, we did not pursue the use of fixed specimens.
Of 205 CNVs detected in these two samples, 70 were identified by at least two algorithms (34 in one sample and 36 in the other). The mean size of these events was 130 kb (range 1.1 kb to 1.3 Mb); 55% were relative losses of genetic material, and 45% were gains. These results are consistent with our observations from other studies using these microarray platforms and this analytical approach, and encouraged us to proceed with the expanded set of experimental samples.
DNA Extractions and Quality of Experimental Samples
Extraction of DNA from approximately 150 ng of frozen BA19 samples yielded high-quality DNA (range 2.16–61 μg; average 28.7) in all but one case (AN01093), which was clearly degraded on agarose gel electrophoresis. There was no correlation between observed frozen tissue quality and either DNA yield, SNP call rate (Illumina array data), QC call rate or contrast QC (Affymetrix data), as measured by a comparison of median values between groups (not significant; Kruskal–Wallis nonparametric test; Fig. 1).
Figure 1.
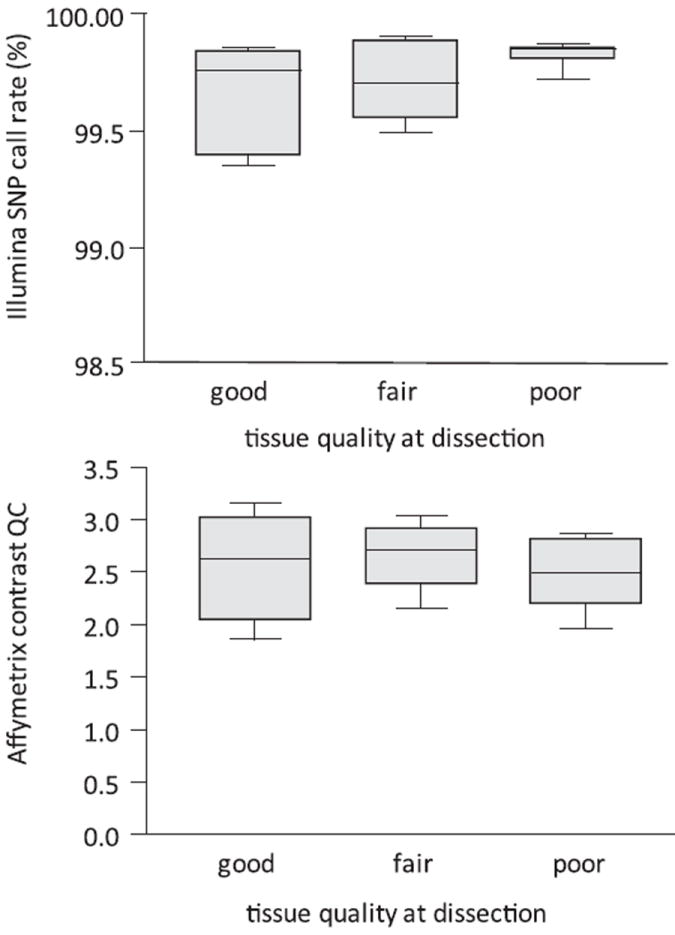
Microarray QC metrics compared with tissue quality at dissection. Top panel: Illumina SNP array call rate. Bottom panel: Affymetrix Contrast QC statistic. Tissue sections from the first batch were classified as “good” (n = 6), “fair” (n = 10) or “poor” (n = 12) based on the qualitative assessment of tissue integrity at dissection by one of the authors (S.D.G.). There is no significant difference between the medians of the three groups (Kruskal–Wallis test).
Performance on Genome-Wide Genotyping Arrays and SNP Calls
All 52 experimental samples passed quality control (QC) thresholds on both arrays. Samples yielded uniformly high SNP call rates on the Illumina (mean 99.8%; range 99.4–99.9) and Affymetrix (mean 99.5%; range 97.9–99.7) arrays. Similarly, Affymetrix QC metrics were also high: mean QC Call Rate of 98.4% (range 95.5–99.6) and mean Contrast QC of 2.65 (range 1.86–3.16). These exceed Affymetrix’s recommended cutoffs (Contrast QC, 0.4; QC Call Rate, 95%), and in our experience are comparable to high quality DNA from fresh blood. For 50 samples with known postmortem index (PMI), there was no correlation of PMI with QC Call Rate, Contrast QC or Illumina SNP Call Rate (correlation coefficients (r) of 0.057, 0.014 and −0.093, respectively).
CNV
For the experimental phase, we analyzed Affymetrix and Illumina array data separately, using an updated analytical pipeline as compared with the proof-of-principle phase. In either case, stringent CNV calls were identified as those detected in the same sample by at least two CNV analysis algorithms. The results of these analyses are presented in Supplementary Tables I and II. This approach identified a mean of 66 stringent CNVs per sample from the Affymetrix data (median 67; range 41–80) and a mean of 25 per sample from the Illumina data (median 21; range 12–94). As expected from the overall distribution of probe coverage, the number of CNVs identified differed between the array platforms (significant difference of medians; P <0.0001, Mann–Whitney test). The mean size of CNVs from the Affymetrix data was 80 kb (median 20 kb; range 0.6 kb to 10 Mb) and 189 kb (median 58 kb; range 5 kb to 9.9 Mb) from the Illumina data.
Five samples with previously described, cytogenetically visible chromosomal abnormalities of 15q11-13 (Table I) were easily identified in our analyses. These had duplications ranging from 6 to 10Mb in size, while a sixth (AN00090) had a 5Mb deletion consistent with a known diagnosis of Angelman syndrome (Table II). Additionally, one sample (AN03935) was found to have an XYY genotype upon analysis of Affymetrix data; this observation was not confirmed with Illumina data, was not validated by existing descriptive data within the ATP portal and is thus likely artifactual.
Table II.
Rare CNVs in Cases Encompassing Autism Susceptibility Genes
| Sample ID | Cytogenetic band | Genomic position (bp) | Size (kb) | CNV | Validated by Illumina? | Gene(s) involved | Location/relevance |
|---|---|---|---|---|---|---|---|
| AN14762 | 2p16.3 | 51,075,080–51,087,539 | 12.5 | Loss | No | NRXN1* | Intron 3; downstream events in ACRD; CNVs in DGV |
| AN14613 | 3p14.2 | 60,464,015–60,502,990 | 39.0 | Loss | Yes | FHIT* | Includes exon 5; other events in ACRD |
| AN19511 | 4p15.31 | 22,351,359–22,429,602 | 78.2 | Loss | Yes | GBA3 | Covered by large loss in ACRD |
| AN06420 | 6q26 | 162,863,051–162,917,072 | 54.0 | Loss | Yes | PARK2* | Intron 1; multiple gains and losses in ACRD; CNVs in DGV |
| AN17138 | 7p21.1 | 16,315,368–16,370,511 | 55.1 | Loss | Yes | hCG_1745121/ISPD | Covered by large gain in ACRD |
| AN01093 | 7q34 | 142,538,076–142,561,946 | 23.9 | Loss | Yes | PIP | Large duplication in ACRD; many common CNVs in DGV |
| AN10949 | 8q22.1 | 95,265,603–95,304,988 | 39.4 | Gain | No | CDH17 | Homologues CDH9, CHD10, CDH22 are candidate genes [Wang et al., 2009] |
| AN13872 | 11p15.4 | 5,842,285–5,892,086 | 49.8 | Gain | No | OR52E4 | Events in ACRD; many common CNVs in DGV |
| AN14829 | 15q11.1-q13.2 | 18,276,341–28,289,587 | 10,013.2 | Gain | Yes | Many genes* | 15q11-q13 duplication region |
| AN09402 | 15q11.1-q13.1 | 18,276,341–26,752,537 | 8,476.2 | Gain | Yes | Many genes* | 15q11-q13 duplication region |
| AN14762 | 15q11.1-q13.1 | 18,276,341–26,742,083 | 8,465.7 | Gain | Yes | Many genes* | 15q11-q13 duplication region |
| AN03935 | 15q11.1-q13.2 | 18,278,739–28,280,653 | 10,001.9 | Gain | Yes | Many genes* | 15q11-q13 duplication region |
| AN17138 | 15q11.2 | 20,302,458–21,937,715 | 1,635.3 | Gain | Yes | WHAMML1, HERC2P2, CYFIP1, NDN, NIPA2, NIPA1, MAGEL2, MKRN3, GOLGA9P, GOLGA8E, TUBGCP5* | 15q11.2 (BP2-BP3) region |
| AN00090 | 15q11.2-15q13.1 | 21,192,955–26,500,067 | 5,307.1 | Loss | Yes | Many genes* | Angelman Syndrome region |
| AN17138 | 15q11.2 | 21,985,041–22,943,182 | 958.1 | Gain | Yes | Many genes* | 15q11-q13 duplication region |
| AN17138 | 15q11.2-q12 | 22,989,278–23,915,837 | 926.6 | Gain | Yes | Many genes* | 15q11-q13 duplication region |
| AN17138 | 15q12-q13.1 | 23,925,463–26,500,067 | 2,574.6 | Gain | Yes | GOLGA8F, GABRG3, HERC2, OCA2, GABRA5, GOLGA8G, GABRB3* | 15q11-q13 duplication region |
| AN13872 | 16p13.2 | 6,992,775–7,021,963 | 29.2 | Loss | Yes | A2BP1* | Intron 3; other losses and gains in ACRD; CNVs in DGV |
| AN00764 | 19q13.42 | 60,601,790–60,943,899 | 342.1 | Gain | Yes | NAT14, ZNF628, ISOC2, CCDC106, ZNF524, NLRP9, ZNF784, EPN1, ZNF581, ZNF580, FIZ1, ZNF579, SBK2, hCG_2039146, UBE2S, LOC284297, U2AF2 | Partially overlapped by ACRD loss |
| AN09402 | 20p12.1 | 15,760,493–15,769,465 | 9.0 | Loss | Yes | MACROD2 | Most significant GWAS association [Anney et al., 2010] |
| AN14829 | Xp22.33 | 2,281,299–2,493,943 | 212.6 | Gain | No | ZBED1, DHRSX | Encompassed by large ACRD loss; many CNVs in DGV |
CNVs observed in Affymetrix data from brain samples from cases (including those with a diagnosis of “suspected autism”), but not in 2,357 control samples, and involving known or suspected autism susceptibility genes. Coordinates are mapped to Build 36 of the human genome. CNVs validated by virtue of their detection in Illumina data from the same sample are indicated. Overlap with CNVs already reported in control samples from the Database of Genomic Variants (DGV; http://projects.tcag.ca/variation) is indicated.
Genes represented in the AutDB database. ACRD, Autism Chromosome Rearrangement Database. Sample AN17138 apparently has one large duplication that has been fragmented into three separate CNV calls by the algorithms used.
Comparison of stringent CNVs detected from Affymetrix array data with those from 2,357 control samples yielded a total of 155 CNVs across all the ATP brain samples that were not present in controls (Supplementary Table III). A similar approach using Illumina data yielded 166 CNVs after exclusion of three samples with excessive numbers of CNVs, falling outside three standard deviations from the mean number of CNV calls (Supplementary Table IV). Among the Affymetrix data were 85 events of >500 kb in size. Excluding the large duplications and deletions of the 15q region, there were 31 of these stringent CNVs in a total of 21 cases (including two with seizure disorders but not autism, and two with suspected autism) that overlapped known genes. We compared these with autism susceptibility genes contained in the AutDB Gene database (www.mindspec.org/autdb.html; accessed March 22, 2010) [Basu, Kollu, & Banerjee-Basu, 2009], revealing four small deletions overlapping some of these genes (Table II). Among these, there was a 54 kb deletion in intron 1 of PARK2, a 12.5 kb deletion in intron 3 of NRXN1, a 29 kb deletion in intron 3 of A2BP1 and a 39 kb deletion of FHIT including exon 5. Three were confirmed by virtue of also being detected in the Illumina array dataset. The NRXN1 CNV was not, likely due to the low number of probes (five) on the Illumina array within this CNV. We also compared these CNVs with the Autism Chromosome Rearrangement Database (http://projects.tcag.ca/autism; accessed April 18, 2010). Twenty-one CNVs overlapping events represented in these databases are summarized in Table II, as well as those encompassing the Angelman and 15q11-q13 duplication regions; of these, 17 (81%) were validated by virtue of their also being detected in the stringent dataset from the Illumina array (Supplementary Table II).
Discussion
Although microarray-based approaches have been increasingly used to detect genomic changes in brain tumours [reviewed in Rutka et al., 2009], the analysis of constitutional CNV in postmortem brain samples has of necessity been limited by sample availability. The establishment of the Autism Tissue Program has been an important step in increasing availability of brain tissue for research in autism and related disorders, particularly in light of its emphasis on well-documented phenotypic information [Haroutunian & Pickett, 2007]. Although sample numbers are small as compared with conventional genome-wide studies, these resources nevertheless provide opportunity for correlation of genotype and CNV data with gene expression, neurochemical [Palmieri et al., 2010] or neuroanatomical [Wegiel et al., 2010] data, as well as potential for discovery of potentially pathogenic CNV events in individuals for whom no corresponding blood sample was obtained prior to death. We are aware of a number of ongoing studies involving gene expression studies in other brain regions that could be correlated with the data presented here. At the time of submission, there were 142 projects listed on the ATP portal website (www.atpportal.org), many of which might benefit from examination of these genotype data.
Preparation of DNA from post-mortem brain can be challenging, even from frozen material [Iwamoto et al., 2007]. We did not succeed in preparing DNA of adequate quality for whole-genome microarray analysis from the formalin-fixed specimens attempted in the proof-of-principle stage. Although this limits the available samples, ATP’s standard procedure of attempting to secure both frozen and fixed tissue from donors means that going forward, there will be a rich resource of highquality DNA that can be prepared from frozen samples. Additionally, we have not genotyped all the available frozen samples.We suggest that this be made a priority of the ATP, in order to increase the resource of data available to other investigators. We have adopted an approach where we have genotyped both cases with ASD and controls, as well as those with related conditions such as epilepsy and Angelman syndrome. By surveying DNA quantity and quality from an abundant cortical region (BA19) from over 50 subjects in the ATP brain bank, we did not detect any obvious differences in tissue quality between autistic and nonautistic brain samples, and were able to discriminate CNVs from the autism and 15q11-q13 subjects as compared to unaffected controls.
In this study, we have examined only BA19, in order to conserve material from other cortical and subcortical regions that may be more relevant to autism pathology, such as frontal cortex, superior temporal cortex, parietal cortex, amygdala, hippocampus, cerebellum and others [reviewed in Amaral, Schumann, & Nordahl, 2008]. In doing so, we have made the implicit assumptions that genotype and CNV data derived from these BA19 samples will not differ greatly from those in common sources of DNA such as blood, saliva or buccal swabs (allowing for integration of these data with other genetic studies), nor from other brain regions more likely to be implicated in autism. Consistent with this idea it has been reported that CNV detection does not differ greatly between DNA from blood, saliva or buccal swabs from the same donor [Dellinger et al., 2010]. Nevertheless, it needs to be kept in mind that we have not tested the hypothesis that somatic changes in specific brain regions might contribute to autistic behaviours, especially in light of the suggestion that brain-specific genotype differences can occur in conditions such as sporadic amyotrophic lateral sclerosis [Ruff & Pamphlett, 2008], and that somatic tissue-specific CNVs could potentially affect gene expression and/or pathology [Piotrowski et al., 2008]. Methods for examining these regional differences could be implemented in a separate study. We recommend prospective collection of DNA from blood from as many autistic patients as possible, in order to maximize the chance that DNA from fresh blood and a transformed cell line is available in the unfortunate instance that a patient later dies unexpectedly, and becomes an ATP brain donor.
From the Affymetrix data, we detected 155 stringent CNVs that were not also present in the large control cohort, an average of about three per sample (Supplemental Table III). Among these were CNVs that overlap known autism susceptibility genes: A2BP1, FHIT, NRXN1 and PARK2. Only two of these four, in FHIT and NRXN1, have not been previously reported in other control populations, although smaller deletions and duplications within this intron of NRXN1 have been observed in controls (Database of Genomic Variants, http://projects.tcag.ca/variation; accessed March 22, 2010). Notably, three of these genes (A2BP1, NRXN1 and PARK2), as well as MACROD2, which we observed in another deletion event, have been observed in hotspots of large, rare deletions found in a study of 440 trio families from a Quebec (Canada) founder population recruited for a study of attention deficit hyperactivity disorder (ADHD) [Bradley et al., 2010]. Intriguingly, MACROD2 was also the most significant susceptibility locus revealed in a recent genome-wide association study of autistic kindreds [Anney et al., 2010].
Although PARK2 is primarily known for its role in autosomal recessive juvenile Parkinson’s disease, rare CNVs at this locus have been reported in cases of autism [Glessner et al., 2009] and other conditions including bipolar disorder [Zhang et al., 2009], ADHD [Elia et al., 2009] and schizophrenia [Xu et al., 2009]. We also observed a deletion of PARK2 in one of the control brain samples. FHIT encodes a triphosphate hydrolase involved in purine metabolism, and encompasses a fragile site (FRA3B) at 3p14.2 (OMIM 601153). A deletion of part of the FHIT gene in one autism patient, and a duplication in another, have been reported [Sebat et al., 2007], as has a loss of the ataxin-2 binding protein (A2BP1) in another subject [Martin et al., 2007]. Deletions of the neuronal cell adhesion molecule neurexin 1 (NRXN1) have also been reported in autistic patients [Autism Genome Project Consortium et al., 2007; Ching et al., 2010]. Possibly, some of the other CNVs observed also represent rare, pathogenic events, and could contribute to phenotypic heterogeneity among these patients.
Although these observations are interesting, the primary goal of this study was to generate a high-quality, genome-wide SNP data set and to provide these data, including derived CNV calls, to the autism research community. The present dataset demonstrates the feasibility of employing postmortem frozen brain tissue from the ATP cohort for use in high-throughput genomic studies, including CNV assessment. These data were accrued from frozen brains that had a range of postmortem interval (PMI; Table I) and subjective grading of tissue quality at dissection that had no significant effect upon microarray data quality. These observations are consistent with microarray analyses on postmortem human brains from a wide variety of neurodegenerative and neuropsychiatric disorders [Altar, Vawter, & Ginsberg, 2009; Ginsberg, 2009], and validate the use of the ATP brain repository for high-throughput genomic studies. We have attempted to control as much as possible the potential variability inherent in genome-wide microarray analysis of these precious samples, by performing this at a single centre and using well-matched reference data sets. We favor a model in which data are housed centrally, for distribution to interested investigators. The availability of existing and secure database resources via the ATP informatics portal, and control of data and tissue release through ATP’s Tissue Advisory Board provides for an appropriate mechanism to make this information available to autism researchers worldwide.
Acknowledgments
We thank the families of the donors and recognize their contributions to autism research at a time of great personal sorrow. We are grateful to Richard Pickett, ATP portal architect, Clara Lajonchere, VP Clinical Programs at Autism Speaks, Ellen Xiu, The Autism Tissue Program and the Genomics Committee of the Autism Genome Project for their assistance and enthusiasm. The work described here is Project #1299 of the Autism Tissue Program, “Autism Genome Project brain tissue genotyping initiative”, funded by Autism Speaks. Tissues were provided by the Harvard Brain Tissue Resource Center, which is supported in part by PHS grant number R24-MH 068855, and by the Human Brain and Spinal Fluid Resource Center at UCLA. We are grateful to George Tejada, Louis Fernandes, James Riehl and Wallace Tourtellotte for their assistance with these samples, and to Carol Ann Ryan for DNA preparation. SAGE control genotype data (Accession: phs000092.v1.p1) were obtained from NCBI dbGAP. The authors wish to acknowledge the Bioinformatics group and Microarray Facility of The Centre for Applied Genomics (The Hospital for Sick Children, Toronto, Canada) for excellent technical assistance and support. The Centre for Applied Genomics is supported by Genome Canada/Ontario Genomics Institute, the McLaughlin Centre, the Canadian Institute for Advanced Research, the Canada Foundation for Innovation, the Ontario Ministry of Research and Innovation and The Hospital for Sick Children (SickKids) Foundation. D.P. is supported by the Royal Netherlands Academy of Arts and Sciences (TMF/DA/5801) and the Netherland Organization for Scientific Research (Rubicon 825.06.031). S.D.G. is supported by NIH grants HD057564, MH085208, and MH086385. S.W.S. is the GlaxoSmithKline-CIHR Pathfinder Chair in Genetics and Genomics at SickKids and the University of Toronto.
Grant sponsors: Autism Speaks; Autism Tissue Program Project; Grant number: #1299; Grant sponsors: Genome Canada/Ontario Genomics Institute; Autism Genome Project; The Centre for Applied Genomics; Netherlands Organization for Scientific Research; Grant number: Rubicon 825.06.031; Grant sponsor: NIH; Grant numbers: HD057564; MH085208; MH086385; Grant sponsor: U.S. Public Health Service; Grant number: R24-MH068855; Grant sponsor: Royal Netherlands Academy of Arts and Sciences; Grant number: TMF/DA/5801.
Footnotes
Additional Supporting Information may be found in the online version of this article.
References
- Altar CA, Vawter MP, Ginsberg SD. Target identification for CNS diseases by transcriptional profiling. Neuropsychopharmacology. 2009;34:18–54. doi: 10.1038/npp.2008.172. [DOI] [PMC free article] [PubMed] [Google Scholar]
- Amaral DG, Schumann CM, Nordahl CW. Neuroanatomy of autism. Trends in Neuroscience. 2008;31:137–145. doi: 10.1016/j.tins.2007.12.005. [DOI] [PubMed] [Google Scholar]
- Anney R, Klei L, Pinto D, Pagnamenta A, Merico D, et al. A genomewide scan for common risk variants nominates phospholipase D and polysialyltransferase proteins for a role in autism. Human Molecular Genetics. 2010;19:4072–4082. doi: 10.1093/hmg/ddq307. [DOI] [PMC free article] [PubMed] [Google Scholar]
- Autism Genome Project Consortium. Szatmari P, Paterson AD, Zwaigenbaum L, Roberts W, et al. Mapping autism risk loci using genetic linkage and chromosomal rearrangements. Nature Genetics. 2007;39:319–328. doi: 10.1038/ng1985. [DOI] [PMC free article] [PubMed] [Google Scholar]
- Basu SN, Kollu R, Banerjee-Basu S. AutDB: A gene reference resource for autism research. Nucleic Acids Research. 2009;37:D832–D836. doi: 10.1093/nar/gkn835. [DOI] [PMC free article] [PubMed] [Google Scholar]
- Bierut LJ, Agrawal A, Bucholz KK, Doheny KF, Laurie C, et al. A genome-wide association study of alcohol dependence. Proceedings of the National Academy of Sciences of the United States of America. 2010;107:5082–5087. doi: 10.1073/pnas.0911109107. [DOI] [PMC free article] [PubMed] [Google Scholar]
- Bradley WE, Raelson JV, Dubois DY, Godin E, Fournier H, et al. Hotspots of large rare deletions in the human genome. PLoS One. 2010;5:e9401. doi: 10.1371/journal.pone.0009401. [DOI] [PMC free article] [PubMed] [Google Scholar]
- Brimacombe MB, Pickett R, Pickett J. Autism postmortem neuroinformatic resource: The autism tissue program (ATP) informatics portal. Journal of Autism and Developmental Disorders. 2007;37:574–579. doi: 10.1007/s10803-006-0188-9. [DOI] [PubMed] [Google Scholar]
- Ching MS, Shen Y, Tan WH, Jeste SS, Morrow EM, et al. Deletions of NRXN1 (neurexin-1) predispose to a wide spectrum of developmental disorders. American Journal of Medical Genetics Part B. 2010;153B:937–947. doi: 10.1002/ajmg.b.31063. [DOI] [PMC free article] [PubMed] [Google Scholar]
- Colella S, Yau C, Taylor JM, Mirza G, Butler H, et al. QuantiSNP: An objective Bayes Hidden-Markov model to detect and accurately map copy number variation using SNP genotyping data. Nucleic Acids Research. 2007;35:2013–2025. doi: 10.1093/nar/gkm076. [DOI] [PMC free article] [PubMed] [Google Scholar]
- Cook EH, Jr, Scherer SW. Copy-number variations associated with neuropsychiatric conditions. Nature. 2008;455:919–923. doi: 10.1038/nature07458. [DOI] [PubMed] [Google Scholar]
- Dellinger AE, Saw SM, Goh LK, Seielstad M, Young TL, Li YJ. Comparative analyses of seven algorithms for copy number variant identification from single nucleotide polymorphism arrays. Nucleic Acids Research. 2010;38:e105. doi: 10.1093/nar/gkq040. [DOI] [PMC free article] [PubMed] [Google Scholar]
- Elia J, Gai X, Xie HM, Perin JC, Geiger E, et al. Rare structural variants found in attention-deficit hyperactivity disorder are preferentially associated with neurodevelopmental genes. Molecular Psychiatry. 2009;15:637–646. doi: 10.1038/mp.2009.57. [DOI] [PMC free article] [PubMed] [Google Scholar]
- Ginsberg SD. Microarray use for the analysis of the CNS. In: Squire LR, editor. Encyclopedia of neuroscience. Vol. 5. Oxford: Academic Press; 2009. pp. 835–841. [Google Scholar]
- Glessner JT, Wang K, Cai G, Korvatska O, Kim CE, et al. Autism genome-wide copy number variation reveals ubiquitin and neuronal genes. Nature. 2009;459:569–573. doi: 10.1038/nature07953. [DOI] [PMC free article] [PubMed] [Google Scholar]
- Haroutunian V, Pickett J. Autism brain tissue banking. Brain Pathology. 2007;17:412–421. doi: 10.1111/j.1750-3639.2007.00097.x. [DOI] [PMC free article] [PubMed] [Google Scholar]
- International HapMap Consortium. The International HapMap Project. Nature. 2003;426:789–796. doi: 10.1038/nature02168. [DOI] [PubMed] [Google Scholar]
- Iwamoto K, Ueda J, Nakano Y, Bundo M, Ukai W, et al. Evaluation of whole genome amplification methods using postmortem brain samples. Journal of Neuroscience Methods. 2007;165:104–110. doi: 10.1016/j.jneumeth.2007.05.029. [DOI] [PubMed] [Google Scholar]
- Korn JM, Kuruvilla FG, McCarroll SA, Wysoker A, Nemesh J, et al. Integrated genotype calling and association analysis of SNPs, common copy number polymorphisms and rare CNVs. Nature Genetics. 2008;40:1253–1260. doi: 10.1038/ng.237. [DOI] [PMC free article] [PubMed] [Google Scholar]
- Krawczak M, Nikolaus S, von Eberstein H, Croucher PJ, El Mokhtari NE, Schreiber S. PopGen: Populationbased recruitment of patients and controls for the analysis of complex genotype-phenotype relationships. Community Genetics. 2006;9:55–61. doi: 10.1159/000090694. [DOI] [PubMed] [Google Scholar]
- Lin M, Wei LJ, Sellers WR, Lieberfarb M, Wong WH, Li C. dChipSNP: Significance curve and clustering of SNP-array-based loss-of-heterozygosity data. Bioinformatics. 2004;20:1233–1240. doi: 10.1093/bioinformatics/bth069. [DOI] [PubMed] [Google Scholar]
- Marshall CR, Noor A, Vincent JB, Lionel AC, Feuk L, et al. Structural variation of chromosomes in autism spectrum disorder. American Journal of Human Genetics. 2008;82:477–488. doi: 10.1016/j.ajhg.2007.12.009. [DOI] [PMC free article] [PubMed] [Google Scholar]
- Martin CL, Duvall JA, Ilkin Y, Simon JS, Arreaza MG, et al. Cytogenetic and molecular characterization of A2BP1/FOX1 as a candidate gene for autism. American Journal of Medical Genetics Part B. 2007;144B:869–876. doi: 10.1002/ajmg.b.30530. [DOI] [PubMed] [Google Scholar]
- Palmieri L, Papaleo V, Porcelli V, Scarcia P, Gaita L, et al. Altered calcium homeostasis in autism-spectrum disorders: Evidence from biochemical and genetic studies of the mitochondrial aspartate/glutamate carrier AGC1. Molecular Psychiatry. 2010;15:38–52. doi: 10.1038/mp.2008.63. [DOI] [PubMed] [Google Scholar]
- Pinto D, Marshall C, Feuk L, Scherer SW. Copynumber variation in control population cohorts. Human Molecular Genetics. 2007;16:R168–R173. doi: 10.1093/hmg/ddm241. [DOI] [PubMed] [Google Scholar]
- Pinto D, Pagnamenta AT, Klei L, Anney R, Merico D, et al. Functional impact of global rare copy number variation in autism. Nature. 2010;466:368–372. doi: 10.1038/nature09146. [DOI] [PMC free article] [PubMed] [Google Scholar]
- Piotrowski A, Bruder CE, Andersson R, de Ståhl TD, Menzel U, et al. Somatic mosaicism for copy number variation in differentiated human tissues. Human Mutation. 2008;29:1118–1124. doi: 10.1002/humu.20815. [DOI] [PubMed] [Google Scholar]
- Pritchard JK, Stephens M, Donnelly P. Inference of population structure using multilocus genotype data. Genetics. 2000;155:945–959. doi: 10.1093/genetics/155.2.945. [DOI] [PMC free article] [PubMed] [Google Scholar]
- Ruff ME, Pamphlett R. A simple method for comparing microarray genotype data between brain and other tissues. Journal of Neuroscience Methods. 2008;173:315–317. doi: 10.1016/j.jneumeth.2008.06.023. [DOI] [PubMed] [Google Scholar]
- Rutka JT, Kongkham P, Northcott P, Carlotti C, Guduk M, et al. The evolution and application of techniques in molecular biology to human brain tumors: A 25 year perspective. Journal of Neurooncology. 2009;92:261–273. doi: 10.1007/s11060-009-9829-0. [DOI] [PubMed] [Google Scholar]
- Scherer SW, Lee C, Birney E, Altshuler DM, Eichler EE, et al. Challenges and standards in integrating surveys of structural variation. Nature Genetics. 2007;39:S7–S15. doi: 10.1038/ng2093. [DOI] [PMC free article] [PubMed] [Google Scholar]
- Sebat J, Lakshmi B, Malhotra D, Troge J, Lese-Martin C, et al. Strong association of de novo copy number mutations with autism. Science. 2007;316:445–449. doi: 10.1126/science.1138659. [DOI] [PMC free article] [PubMed] [Google Scholar]
- Stewart AF, Dandona S, Chen L, Assogba O, Belanger M, et al. Kinesin family member 6 variant Trp719Arg does not associate with angiographically defined coronary artery disease in the Ottawa Heart Genomics Study. Journal of the American College of Cardiology. 2009;53:1471–1472. doi: 10.1016/j.jacc.2008.12.051. [DOI] [PubMed] [Google Scholar]
- Wang K, Li M, Hadley D, Liu R, Glessner J, et al. PennCNV: An integrated hidden Markov model designed for high-resolution copy number variation detection in wholegenome SNP genotyping data. Genome Research. 2007;17:1665–1674. doi: 10.1101/gr.6861907. [DOI] [PMC free article] [PubMed] [Google Scholar]
- Wang K, Zhang H, Ma D, Bucan M, Glessner JT, et al. Common genetic variants on 5p14.1 associate with autism spectrum disorders. Nature. 2009;459:528–533. doi: 10.1038/nature07999. [DOI] [PMC free article] [PubMed] [Google Scholar]
- Wegiel J, Kuchna I, Nowicki K, Imaki H, Wegiel J, et al. The neuropathology of autism: Defects of neurogenesis and neuronal migration, and dysplastic changes. Acta Neuropathologica. 2010;119:755–770. doi: 10.1007/s00401-010-0655-4. [DOI] [PMC free article] [PubMed] [Google Scholar]
- Xu J, Zwaigenbaum L, Szatmari P, Scherer SW. Molecular cytogenetics of autism. Current Genomics. 2004;5:347–364. [Google Scholar]
- Xu B, Woodroffe A, Rodriguez-Murillo L, Roos JL, van Rensburg EJ, et al. Elucidating the genetic architecture of familial schizophrenia using rare copy number variant and linkage scans. Proceedings of the National Academy of Sciences of the United States of America. 2009;106:16746–16751. doi: 10.1073/pnas.0908584106. [DOI] [PMC free article] [PubMed] [Google Scholar]
- Zhang D, Cheng L, Qian Y, Alliey-Rodriguez N, Kelsoe JR, et al. Singleton deletions throughout the genome increase risk of bipolar disorder. Molecular Psychiatry. 2009;14:376–380. doi: 10.1038/mp.2008.144. [DOI] [PMC free article] [PubMed] [Google Scholar]
Associated Data
This section collects any data citations, data availability statements, or supplementary materials included in this article.
Data Availability Statement
Genotype data and CNV calls are available from the Autism Tissue Program via the secure Informatics Portal at www.atpportal.org. Availability of these data is subject to project-by-project review by ATP’s Tissue Advisory Board. Additionally, for ease of interpretation, CNV calls are displayed in the genome browser of the Autism Chromosome Rearrangement Database [http://projects.tcag.ca/autism; Marshall et al., 2008; Xu, Zwaigenbaum, Szatmari, & Scherer, 2004].