

Supplemental Digital Content is available in the text.
Key Words: rehospitalization, predictive model, electronic medical records, severity of illness, care directive, risk adjustment
Background:
Hospital discharge planning has been hampered by the lack of predictive models.
Objective:
To develop predictive models for nonelective rehospitalization and postdischarge mortality suitable for use in commercially available electronic medical records (EMRs).
Design:
Retrospective cohort study using split validation.
Setting:
Integrated health care delivery system serving 3.9 million members.
Participants:
A total of 360,036 surviving adults who experienced 609,393 overnight hospitalizations at 21 hospitals between June 1, 2010 and December 31, 2013.
Main Outcome Measure:
A composite outcome (nonelective rehospitalization and/or death within 7 or 30 days of discharge).
Results:
Nonelective rehospitalization rates at 7 and 30 days were 5.8% and 12.4%; mortality rates were 1.3% and 3.7%; and composite outcome rates were 6.3% and 14.9%, respectively. Using data from a comprehensive EMR, we developed 4 models that can generate risk estimates for risk of the combined outcome within 7 or 30 days, either at the time of admission or at 8 am on the day of discharge. The best was the 30-day discharge day model, which had a c-statistic of 0.756 (95% confidence interval, 0.754–0.756) and a Nagelkerke pseudo-R2 of 0.174 (0.171–0.178) in the validation dataset. The most important predictors—a composite acute physiology score and end of life care directives—accounted for 54% of the predictive ability of the 30-day model. Incorporation of diagnoses (not reliably available for real-time use) did not improve model performance.
Conclusions:
It is possible to develop robust predictive models, suitable for use in real time with commercially available EMRs, for nonelective rehospitalization and postdischarge mortality.
Adults discharged from the hospital have substantially elevated risk for morbidity and mortality,1–3 which has led Krumholz to postulate the existence of “posthospital syndrome.”4 The Affordable Care Act established the Hospital Readmissions Reduction Program in which the Centers for Medicare and Medicaid Services report risk-adjusted rehospitalization rates and reduce payment for certain conditions with “excess” 30-day rehospitalization rates.5,6 Discharge planners must also address the fact that hospitalized patients’ risk for specific events (such as rehospitalization for an acute illness) may vary over time. This is likely because nonelective rehospitalizations and posthospital mortality involve complex interactions between medical, social, and health services factors.
Lack of accurate predictive models continues to limit descriptive analyses and attempts at implementing interventions to support discharge planning.7,8 Most existing models rely on administrative data and cannot be calculated before patient discharge. Incorporating clinical data improves the ability to predict for other outcomes (eg, inpatient mortality9,10), but few models that could support discharge planning have incorporated clinical and/or patient-reported data.11–17
We have described use of granular electronic medical record (EMR) data for analyzing in-hospital deterioration,18,19 risk adjustment for intensive care unit (ICU) patients,20 and risk adjustment for all hospitalized patients.21–23 The setting for our work is Kaiser Permanente Northern California (KPNC), an integrated health care delivery system that routinely uses severity of illness and longitudinal comorbidity scores for internal quality assurance. As is the case with some university hospitals,24 KPNC is starting to embed predictive models into the EMR. In November of 2013, KPNC began a 2-hospital early warning system pilot project that provides clinicians in the emergency department (ED) and general medical-surgical wards with a severity of illness score and longitudinal comorbidity score (previously described in this journal23), as well as an in-hospital deterioration risk estimate, in real time.25,26
Our objective was to develop a set of predictive models that take advantage of the existing electronic infrastructure at the 2 KPNC pilot sites. We aimed to develop models with these attributes: (1) it should be possible to instantiate them in a commercially available EMR so that risk estimates can be available in real time; (2) focusing on the immediate postdischarge period (7 and 30 d), they target 2 overlapping postdischarge events: nonelective rehospitalizations and postdischarge mortality; (3) their statistical characteristics should be well described, and they should have good calibration; and (4) timing of the models should address the differing operational requirements of an integrated health care delivery system.
METHODS
This project was approved by the KPNC Institutional Review Board.
Under a mutual exclusivity arrangement, salaried physicians of The Permanente Medical Group Inc., care for 3.9 million Kaiser Foundation Health Plan Inc. members at facilities owned by Kaiser Foundation Hospitals Inc. All KPNC facilities use the same information systems with a common medical record number.27 The Epic EMR (http://www.epicsystems.com), known internally as KP HealthConnect (KPHC), was fully deployed in 2010.
Our setting consisted of 21 hospitals described previously.18,19,21,23 We constructed our cohort by initially identifying all hospital stays for patients meeting these criteria: (1) patient survived an overnight inpatient hospitalization that began from June 1, 2010 through December 31, 2013 (excluding hospitalizations for observation or 1-day surgery not resulting in an overnight stay); (2) initial hospitalization occurred at a KPNC hospital (if transfer from an outside hospital occurred, the first hospital stay was covered by KPNC); (3) age 18 years and above at the time of admission; (4) hospitalization was not for childbirth (postdelivery pregnancy complications were included); and (5) KPHC was functioning at the hospital for ≥3 months. As previously reported, we then linked hospital stays for transferred patients21 and identified initial admission location.18,19,23 Rehospitalizations were assigned to the discharging hospital. Using this methodology, we could classify all hospitalizations as being an index hospitalization, a rehospitalization, or both.
Because the purpose of our model was to obtain point estimates of the probability of a postdischarge event (as opposed to explaining the effects of individual predictors), we included all hospitalizations experienced by the patients in our cohort, ignoring within-patient clustering (random) effects. In addition, we used admissions up to 7 days or 8–30 days before the index admission as predictors in the model. We ignored the correlation structure generated by multiple admissions for a single patient because point estimates are known to be insensitive to misspecification of the random effects distribution.28 However, to explore the effect of multiple admissions on the final predictions, we conducted sensitivity analyses where we built a model in which each patient only contributed 1 index hospitalization in the development dataset and validated the model in the same validation dataset described above.
We developed 4 predictive models (ED 7, ED 30, discharge day 7, and discharge day 30) based on: (1) timing of risk estimate provision (in the ED or at 08:00 on the discharge day), and (2) outcome time frame (7 or 30 d after discharge). The principal dependent variable was occurrence of a composite outcome (death and/or nonelective rehospitalization) within 7 or 30 days after discharge. Although a number of methods exist to define unplanned or nonelective admission,29,30 currently, no standard definition exists for defining a nonelective readmission. Consequently, we defined a nonelective rehospitalization as one having at least one of these characteristics: it was due to an ambulatory care sensitive condition (thus potentially preventable) as defined by the Agency for Healthcare Research and Quality31; admission occurred through the ED; and/or, at readmission, the patient had a Laboratory Acute Physiology Score, version 2 (LAPS223)≥60, which is associated with a mortality risk of 7.2% and approximates the average mortality risk among inpatients who triggered a real-time alert in the study of Kollef et al.24 We included this criterion to ensure that we did not miss urgent transfers from the clinic to the hospital that bypassed the ED. Linked state mortality data were unavailable for the entire study period, so we ascertained 7- and 30-day mortality based on the combination of KPNC patient demographic databases and publicly available files of deceased patients.
Half of the patients (regardless of their number of hospitalizations) were randomized into the development dataset and the rest into the validation dataset. After randomization, all hospitalizations for a given patient were included in analyses. Models were developed and tested on the development dataset and the final performance evaluation was conducted on the validation dataset. We evaluated the following independent variables, selected because they can be obtained in real time, as potential predictors: age; sex; admission venue (ED or not); admission LAPS223; illness severity at 08:00 on the day of discharge (LAPS2dc); longitudinal comorbidities (COmorbidity Point Score, version 2, or COPS223); admission and discharge care directives (classified as “full code” or “restricted resuscitation preference,” which included “partial code,” “do not resuscitate,” and “comfort care only” orders23); total index hospital length of stay (LOS); time and day of discharge; and whether a patient experienced any overnight inpatient hospitalization in the first 7 and separately in the 8–30 days preceding the index hospitalization. For descriptive purposes, we also quantified other patient characteristics, including whether or not the patient was admitted to intensive care and, for surgical patients, whether they had a second stay in the operating room (a proxy for a surgical complication). We combined Health Care Utilization Project (http://www.ahrq.gov/data/hcup) single-level diagnosis clinical classification software categories to group all possible International Classification of Diseases principal diagnosis codes into 30 groups, which we refer to as Primary Conditions.23
As elaborated in Section 3 of the Appendix (Supplemental Digital Content 1, http://links.lww.com/MLR/B40) we first considered various models for the discharge day 30 outcome, including ANCOVA, saturated ANOVA with smoothing by logistic regression,32 random forests,33 conditional inference recursive partition,34 neural networks,35–37 recursive-partition-then-logistic regression, and a type of nearest-neighbor analysis.38 All methods were compared on their performance in a random set of patients held out from the derivation data; the winning model’s performance was checked again on the validation data. The best model was selected based on a high c-statistic with a penalty for the number of covariates and the model complexity. The discharge day 30 model ultimately selected was a single logistic regression of longitudinal comorbidities (COmorbidity Point Score, version 2, or COPS223), admission illness severity (LAPS2), total index hospital LOS (truncated at 30 d), discharge care directives (classified as “full code” or not), and whether the patient experienced any hospitalizations in the 7 and 30 days preceding this index hospitalization. The discharge day 7 model mirrors the discharge day 30 model.
The ED 7 and ED 30 models use a more restricted set of covariates that would be available in the ED (age, sex, COPS2, and LAPS2). These were first processed using a recursive partitioning algorithm that yielded 6 terminal nodes. Recursive partitioning algorithms create a decision tree that classifies observations in the population by recursively splitting the population into subpopulations (tree branches, or nodes) based on a set of predictors. The process is called recursive partitioning because each tree branch splits the population recursively until a stopping criterion is met. Predicted values are calculated as a summary statistic or by a predictive model based on the subpopulation remaining in the last partitions (tree leaves, or terminal nodes). Using a separate logistic regression per terminal node and only those observations that reside in each respective node, the same restricted set of covariates were then used to fit on the composite outcome.
For the final 4 models selected we calculated the relative contribution of predictors as described by Render et al.39 All analyses were performed in SAS version 9, SAS JMP version 7, and R version 3. As a sensitivity analysis to address the possible impact of multiple patient admissions, we remodeled using a development dataset where each patient contributed only 1 randomly selected index hospitalization and validated the model in the same validation dataset described above (ie, representing the actual operational environment where the model will be used).
During the course of the ongoing pilot, we have found that accurate patient diagnoses cannot be retrieved reliably for all patients in real time, so we did not include these in our models; however, we did assess their impact on model discrimination and explanatory power as recommended by Cook,40 Pencina et al,41 and Pepe et al.42 We also assessed the performance of our models for specific primary conditions and within the following patient subsets: males, females, age below 65/age 65 years and above, surgical/nonsurgical patients, and whether or not a patient required intensive care. For comparison purposes, we also assigned every hospitalization episode 2 scores currently in operational use in some Kaiser Permanente regions: a Charlson score43 and the LACE (Length of stay, Acuity, Charlson, Emergency department use) score of van Walraven et al.13
RESULTS
We identified eligible hospital stays within or outside KPNC involving 360,036 patients during the study period; these were concatenated into 609,393 linked index hospitalizations (episodes) for our analyses. Table 1 shows hospitalization characteristics Section 4 of the (Appendix, Supplemental Digital Content 1, http://links.lww.com/MLR/B40 provides a patient level description of the cohort). The table shows that the total rehospitalization rate was 5.8% at 7 days and 14.5% at 30 days postdischarge, with the corresponding nonelective rehospitalization rate being 5.1% and 12.4%, respectively. Mortality was 1.3% at 7 days and 3.7% at 30 days, whereas the composite outcome rate was 6.3% and 14.9%, respectively. The distribution of inclusion criteria (eg, presence of an ambulatory care sensitive condition) for the rehospitalizations is provided in Section 2 of the Appendix (Supplemental Digital Content 1, http://links.lww.com/MLR/B40).
TABLE 1.
Cohort Characteristics*
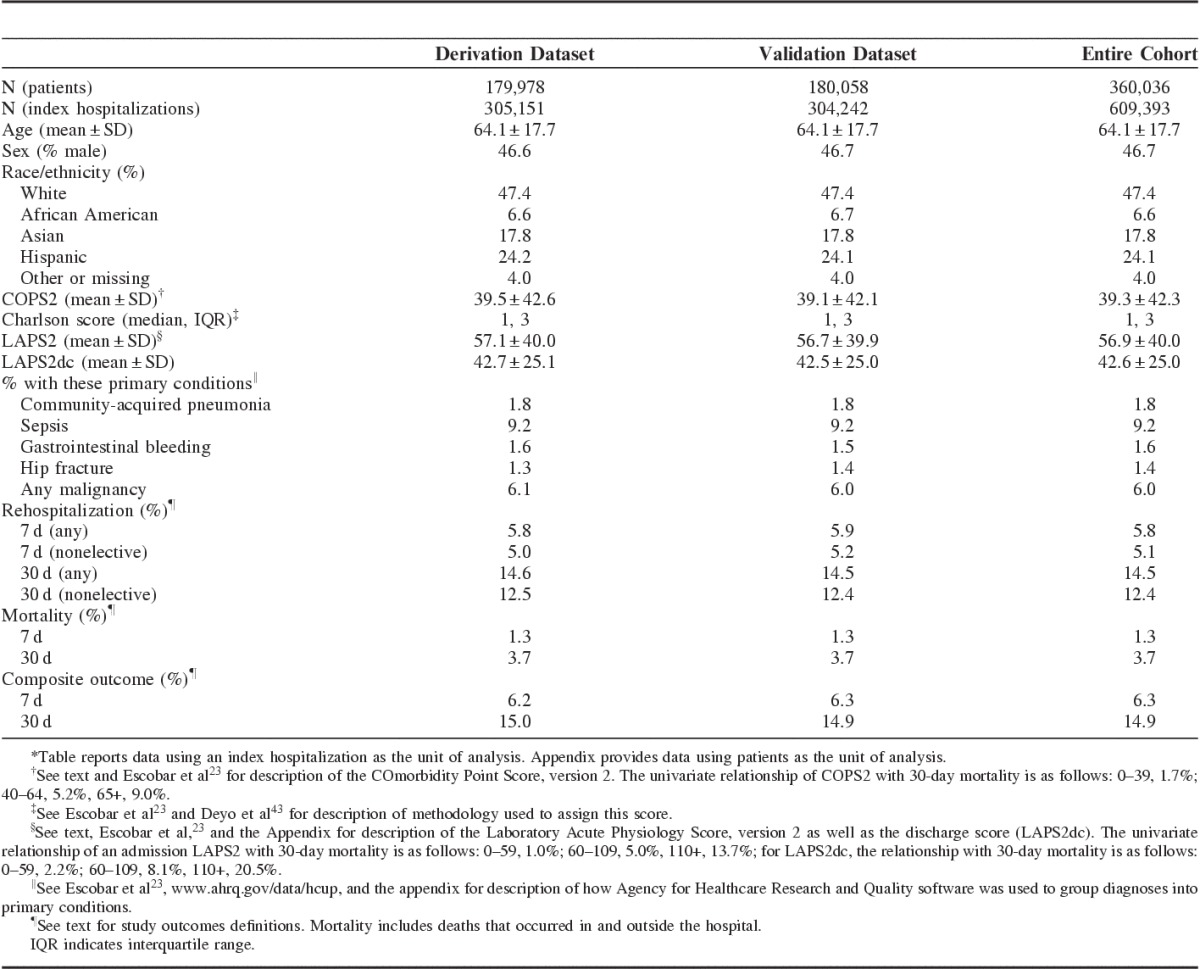
Table 2 shows cohort characteristics stratified by the composite outcome. The following predictors were strongly associated with the study outcome: male sex; age; admission or discharge illness severity; comorbidity burden; and LOS; restricted care directives; ED admission; admission to the ICU; unplanned transfer to the ICU; and a proxy for the occurrence of a surgical complication.
TABLE 2.
Selected Characteristics of Index Hospitalizations With and Without the 30-Day Composite Outcome*†
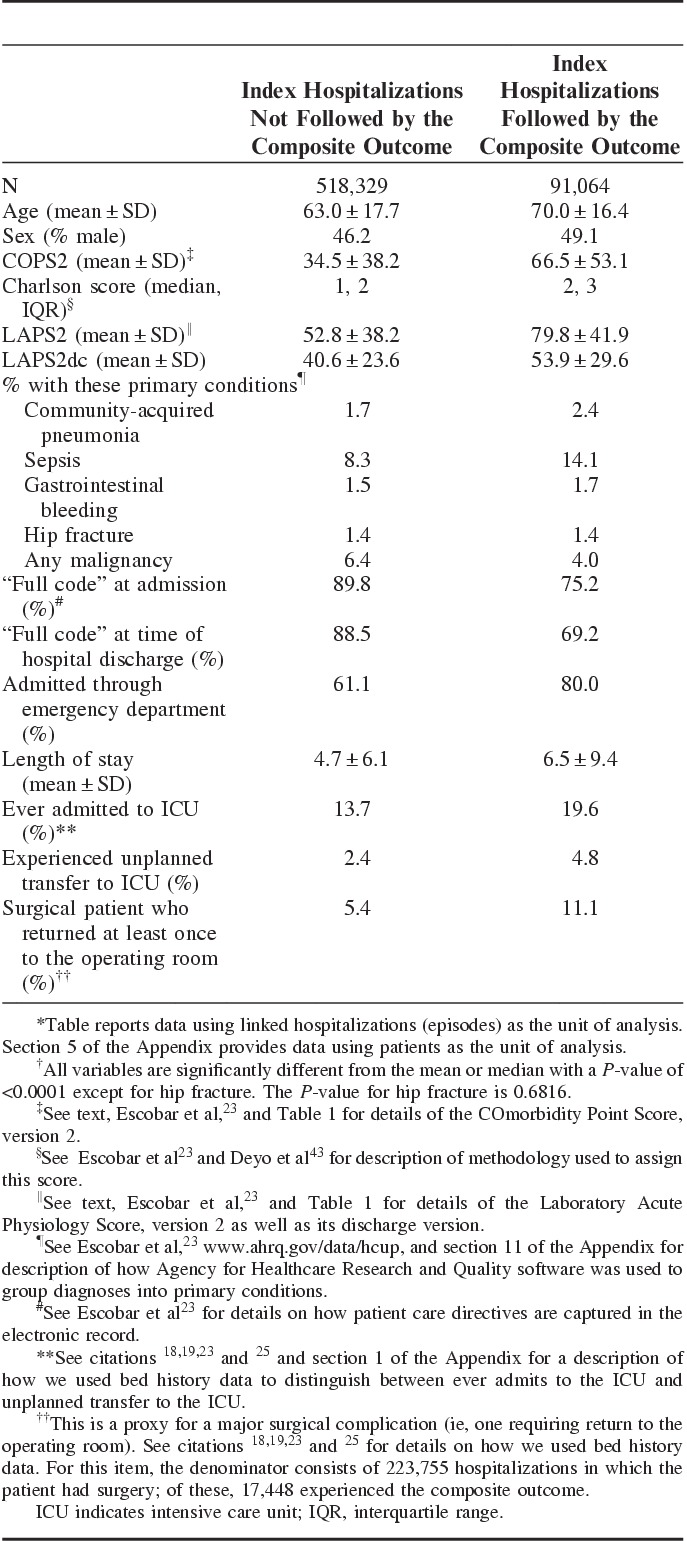
Table 3 summarizes the performance of the ED 30 and discharge day 30 models and compares them to the LACE. Similar results were obtained for the 7-day models (Section 6 Appendix, Supplemental Digital Content 1, http://links.lww.com/MLR/B40). Adding diagnosis did not result in a significant improvement in model performance (Section 10 Appendix, Supplemental Digital Content 1, http://links.lww.com/MLR/B40). For the discharge day 30 model, the c-statistic across subgroups ranged from 0.669 to 0.822. Section 7 of the Appendix (Supplemental Digital Content 1, http://links.lww.com/MLR/B40) also shows graphically that the discharge day 30 model had the best calibration (eg, the LACE as well as our ED models did not assign any patients a risk above 80%). For the discharge day 30 model, the relative contribution of predictors was as follows: COPS2, 37%; admission LAPS2, 25%; LOS, 9%; discharge care directive, 13%; and prior hospitalization category, 16%. Performance of the models was not substantially affected by multiple admissions; for example, when we restricted the 30-day discharge model to a dataset in which each patient only contributed 1 index hospitalization, the c-statistic was 0.756 but the Nagelkerke R2 dropped to ∼0.14, suggesting that using all patient admissions is beneficial.
TABLE 3.
30-Day Models’ Performance Characteristics in Validation Dataset
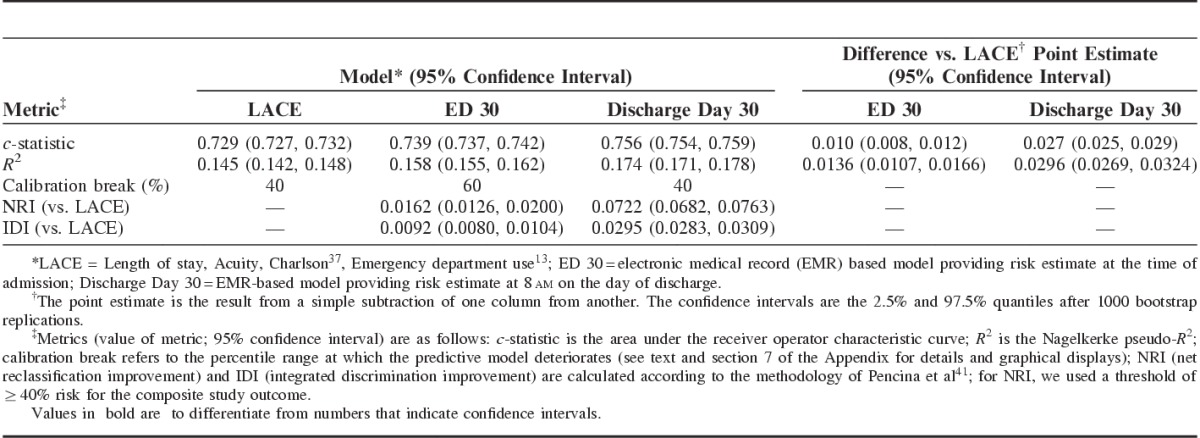
Table 4 summarizes the ED and discharge day 30 models’ characteristics. From a clinician’s perspective, the most important metric is the workup to detection ratio (number of patients one would need to evaluate to identify a patient who would have experienced the composite outcome). Table 4 and Section 9 of the Appendix (Supplemental Digital Content 1, http://links.lww.com/MLR/B40) show that the discharge day 30 model was the most efficient. Figure 1 shows a Kaplan-Meier plot for the combined outcome after division of the study cohort into risk terciles based on the discharge day 30 model in the validation dataset. A strong correlation between rehospitalization and mortality rates is present once the composite outcome risk is ≥10%. The mortality rate was 0.32% among patients with a predicted risk for the composite outcome of <10%, where most outcomes were rehospitalizations where the patient survived. In contrast, among patients with a predicted composite risk of ≥50%, the death rate was 24% (81% of which were at home or in hospice), the rehospitalization rate with survival was 27%, and the rehospitalization rate with subsequent 30-day mortality was 7% (Section 13 Appendix, Supplemental Digital Content 1, http://links.lww.com/MLR/B40).
TABLE 4.
Operational Characteristics of 30-Day Models (Validation Dataset)
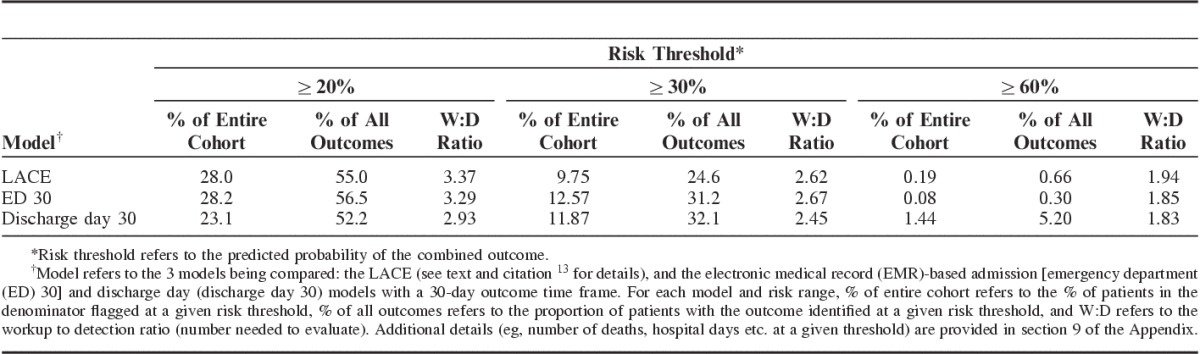
FIGURE 1.
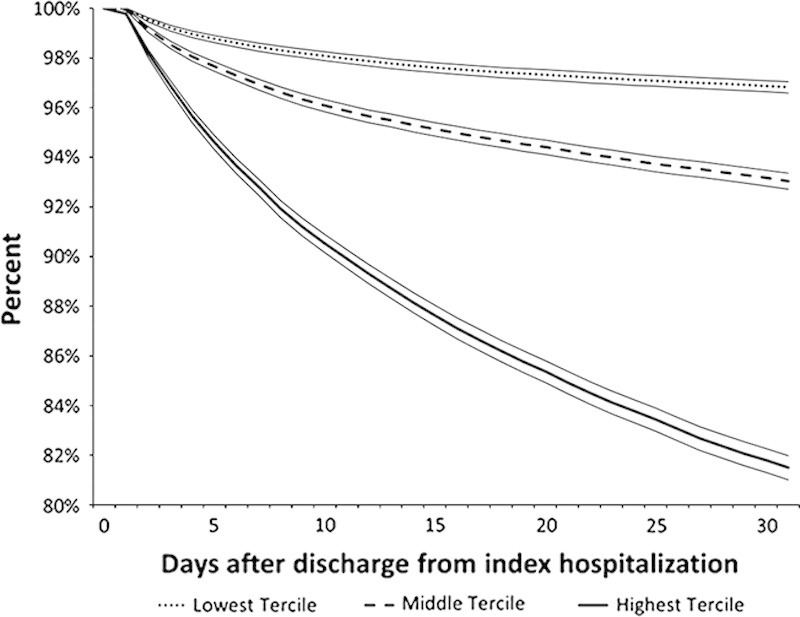
Kaplan-meier survival curves for composite outcome across high, medium, and low risk groups using the validation dataset. Vertical axis shows the percentage of patients without the composite outcome at a given point after discharge from the index hospitalization. Horizontal axis shows the number of days after discharge. Cohort was divided into terciles based on predicted risk for the combined outcome described in the text. The model used the 30-day electronic medical record-based discharge model (discharge day 30). Dotted line (•••) shows the lowest risk tercile (predicted risk up to 6.2%; 11.1% of all combined outcomes, 1.5% of all deaths); dashed line (- - -), hospitalizations with predicted risk of 6.2%–9.6% (24.3% of all combined outcomes, 7.1% of all deaths); and the solid line (—), hospitalizations with predicted risk of 9.6% or more (64.6% of all combined outcomes, 91.4% of all deaths). Boundaries around each line indicate 95% equal-precision confidence bands. Similar curves for the other 3 models are provided in section 13 of the Appendix (Supplemental Digital Content 1, http://links.lww.com/MLR/B40).
DISCUSSION
We have developed a set of predictive models explicitly designed for use with workflows involving comprehensive EMRs. In an integrated system where patient care is structured around the EMR, careful consideration of different caregivers’ workflows and needs is essential. For example, hospital physicians specifically requested a 7-day model because KPNC quality assurance processes place responsibility for prevention of early rehospitalizations on hospitalists and hospital-based discharge planners; further, some KPNC hospitals are experimenting with hospitalists making house calls during that first week. In contrast, outpatient clinicians and case managers, some operating within specific chronic condition management programs, are responsible for later rehospitalizations (7–30 d after discharge). Thus, the basic workflow envisioned for using our models is one where preliminary 7 and 30-day risk estimates are generated in the ED. These preliminary risk estimates would be available to hospital caregivers and can also be transmitted electronically to outpatient case managers, giving them provisional notification of patients likely to require services. Subsequently, an updated probability estimate can be generated on the day of discharge.
Our results highlight the role data from current EMRs can and cannot play in predicting post-discharge trajectories. On the one hand, they permit enhancing hospital-based predictive models by incorporating physiologic and care directive data (54% of our discharge day 30 model’s predictive ability was due to these predictors). They also can improve the screening efficiency across different levels of risk. For example, the administrative data-based LACE score currently in use in some Kaiser Permanente regions does not assign any observations a risk above 80%, whereas the number needed to evaluate—which determines the cost of screening—is generally lower for our models. In contrast, their overall explanatory power remains low, highlighting the need to incorporate other predictors (eg, socioeconomic status from geocoding,44 variables obtained using natural language processing or direct patient interviews, such as social support or functional status). Importantly, we found that diagnosis did not improve model performance, and our 30-day model does not include age and sex. With hindsight, this is not that surprising, given that the predictive value of many diagnoses is probably mediated through physiological derangement, which is captured by the LAPS2. In addition, our findings show that the distinction between tools used for retrospective analyses (eg, LAPS2, COPS2) and tools used for real-time risk prediction is becoming blurred. This mixed picture of both promise and limitations highlights the fact that, as a profession, we are in a very early stage of development of EMR-based predictive models.
Consideration of replication of our models in other settings also presents a mix of promise and limitations. All of the predictors we used are generic and can be found in any comprehensive EMR, and our algorithms are available in the public domain. The first version of the LAPS (that only included laboratory data) has been externally validated,22 and our team is working with research partners at several universities to validate the second version (LAPS2). Although not all entities may have longitudinal data, it would still be possible for them to calculate a COPS2 using present on admission codes without significant degradation of statistical performance,23 as the primary advantages of the COPS2 are related to its use in real time. However, the fact remains that many health care entities (including many of those that have comprehensive EMRs) cannot replicate our methods. Most likely, this is due to staffing limitations (not having trained personnel capable of extracting data from the EMR “back end”), but other reasons may also exist, including the absence of incentives.45
A number of additional limitations need to be stressed. Our work is based on a care delivery system whose level of integration is extremely high. Further, KPNC has an insured population that enjoys a broad array of disease-specific preventive programs as well as a variety of generic preventive care systems (eg, call centers with immediate access to physicians, electronic portals for communicating with primary care providers). Thus, our models have been developed in a population where the baseline adverse outcomes rates are already low. For our models to be used elsewhere, recalibration is indicated, as baseline rehospitalization and mortality rates may be different. Another important limitation is that our models do not provide guidance on what may trigger a given rehospitalization, nor do they actually provide indication of what should be done to prevent adverse postdischarge events. This limitation can be addressed by future research that incorporates data from free text notes, other laboratory tests, and admission and discharge diagnoses. Our models also have the limitation (due to an explicit design consideration) that they do not provide separate risk estimates for different types of outcomes (eg, rehospitalization where the patient survived the rehospitalization, rehospitalization where the patient died during the rehospitalization, death at home, or death in other settings). However, both of these limitations can be addressed by conducting additional research and by adjusting operational workflows. With respect to the research component, new predictive models can be developed that adjust baseline risk estimates generated by the EMR by incorporating patient-reported predictors such as social support and/or functional status. These predictors need not necessarily be available in the EMR. One can use a mixed approach currently in use in KPNC for newborns suspected of sepsis. In this approach, a first model generates a baseline risk based on maternal risk factors available in the EMR46 and then clinicians can manually incorporate new information (the newborn’s clinical examination). Likelihood ratios developed from a second model47 can then be used by an online calculator to generate a new, posterior probability.48 A similar strategy could be used for hospitalized adults—baseline risk from an EMR model is modified by additional, nonclinical patient information.
Our primary reasons for using a composite outcome were operational. They included factors such as the need to minimize alert fatigue due to proliferation of predictive models as well as KPNC organizational policy. At KPNC, discharge and advance care planning are being linked as part of a comprehensive approach (Respecting Choices)49 to ensure that patient preferences around end of life care are respected. Given the strong correlation between rehospitalization and death described above and the fact that end of life care issues are common among rehospitalized patients,50 this approach makes sense for KPNC. Other health systems with different policies and operational constraints may prefer to develop separate models.
In summary, we have developed a set of predictive models for nonelective rehospitalization and postdischarge mortality that use electronic algorithms already in use in an ongoing pilot. These models are efficient and can serve as the platform for future research (eg, as risk adjustment tools for comparative effectiveness studies). In addition to being used to support discharge planning, these models will be used for risk adjustment in internal benchmarking systems, to support randomized interventions, and to enhance existing quality assurance and case management efforts. Our team is hopeful that rehospitalization prevention pilots using these models can begin within the next 6–9 months.
Supplementary Material
ACKNOWLEDGMENTS
The authors wish to thank Dr Philip Madvig, Dr Michelle Caughey, Gregory Adams, Cesar Villalpando, and Barbara Crawford for their administrative support of this project. The authors also thank Dr Brian Hoberman and his KP HealthConnect team for assistance with mapping of EMR components, Dr Tracy Lieu for reviewing the manuscript, and Rachel Lesser for formatting the manuscript.
Footnotes
Supplemental Digital Content is available for this article. Direct URL citations appear in the printed text and are provided in the HTML and PDF versions of this article on the journal's Website, www.lww-medicalcare.com.
Portions of the results have been presented to internal Kaiser Permanente Northern California audiences as well as the following venues: the Linguamatics Text Mining conference in San Francisco, CA on August 26, 2014; the Gordon and Betty Moore Foundation in Palo Alto, CA on September 23, 2014; and at the Health Care Leadership Forum Conference in Chicago, IL on September 29, 2014. A description of one subset analysis (focusing on patients admitted to the intensive care unit) was presented at a platform presentation at American Thoracic Society meeting in Denver, CO on May 19, 2015.
Supported by a grant from the Gordon and Betty Moore Foundation (#2909, Non-Traditional Predictors of Rehospitalization and High Resource Use), Kaiser Foundation Hospitals Inc., and The Permanente Medical Group Inc. V.L. was also supported by NIGMS grant number K23GM112018.
The authors declare no conflict of interest.
REFERENCES
- 1.Jencks SF, Williams MV, Coleman EA. Rehospitalizations among patients in the Medicare fee-for-service program. N Engl J Med. 2009;360:1418–1428. [DOI] [PubMed] [Google Scholar]
- 2.van Walraven C. The hospital-patient one-year mortality risk score accurately predicted long-term death risk in hospitalized patients. J Clin Epidemiol. 2014;67:1025–1034. [DOI] [PubMed] [Google Scholar]
- 3.Prescott HC, Langa KM, Liu V, et al. Increased 1-year healthcare use in survivors of severe sepsis. Am J Respir Crit Care Med. 2014;190:62–69. [DOI] [PMC free article] [PubMed] [Google Scholar]
- 4.Krumholz HM. Post-hospital syndrome—an acquired, transient condition of generalized risk. N Engl J Med. 2013;368:100–102. [DOI] [PMC free article] [PubMed] [Google Scholar]
- 5.Centers for Medicare and Medicaid Services. Readmissions Reduction Program. 2012. Available at: http://www.cms.gov/Medicare/Medicare-Fee-for-Service-Payment/AcuteInpatientPPS/Readmissions-Reduction-Program.html. Accessed October 27, 2014.
- 6.Centers for Medicare and Medicaid Services. Medicare program: payment policies related to patient status. Fed Regist. 2013;78:50495–51040. [PubMed] [Google Scholar]
- 7.Hansen LO, Young RS, Hinami K, et al. Interventions to reduce 30-day rehospitalization: a systematic review. Ann Intern Med. 2011;155:520–528. [DOI] [PubMed] [Google Scholar]
- 8.Kansagara D, Englander H, Salanitro A, et al. Risk prediction models for hospital readmission: a systematic review. JAMA. 2011;306:1688–1698. [DOI] [PMC free article] [PubMed] [Google Scholar]
- 9.Silber JH, Rosenbaum PR, Ross RN. Comparing the contributions of groups of predictors: which outcomes vary with hospital rather than patient characteristics? J Am Stat Assoc. 1995;90:7–18. [Google Scholar]
- 10.Tabak YP, Johannes RS, Silber JH. Using automated clinical data for risk adjustment: development and validation of six disease-specific mortality predictive models for pay-for-performance. Med Care. 2007;45:789–805. [DOI] [PubMed] [Google Scholar]
- 11.Coleman EA, Min SJ, Chomiak A, et al. Posthospital care transitions: patterns, complications, and risk identification. Health Serv Res. 2004;39:1449–1465. [DOI] [PMC free article] [PubMed] [Google Scholar]
- 12.Hasan O, Meltzer DO, Shaykevich SA, et al. Hospital readmission in general medicine patients: a prediction model. J Gen Intern Med. 2010;25:211–219. [DOI] [PMC free article] [PubMed] [Google Scholar]
- 13.van Walraven C, Dhalla IA, Bell C, et al. Derivation and validation of an index to predict early death or unplanned readmission after discharge from hospital to the community. CMAJ. 2010;182:551–557. [DOI] [PMC free article] [PubMed] [Google Scholar]
- 14.Allaudeen N, Vidyarthi A, Maselli J, et al. Redefining readmission risk factors for general medicine patients. J Hosp Med. 2011;6:54–60. [DOI] [PubMed] [Google Scholar]
- 15.Rothman MJ, Rothman SI, Beals J. Development and validation of a continuous measure of patient condition using the electronic medical record. J Biomed Inform. 2013;46:837–848. [DOI] [PubMed] [Google Scholar]
- 16.Bradley EH, Yakusheva O, Horwitz LI, et al. Identifying patients at increased risk for unplanned readmission. Med Care. 2013;51:761–766. [DOI] [PMC free article] [PubMed] [Google Scholar]
- 17.Donze J, Aujesky D, Williams D, et al. Potentially avoidable 30-day hospital readmissions in medical patients: derivation and validation of a prediction model. JAMA Intern Med. 2013;173:632–638. [DOI] [PubMed] [Google Scholar]
- 18.Escobar GJ, Greene JD, Gardner MN, et al. Intra-hospital transfers to a higher level of care: contribution to total hospital and intensive care unit (ICU) mortality and length of stay (LOS). J Hosp Med. 2011;6:74–80. [DOI] [PubMed] [Google Scholar]
- 19.Liu V, Kipnis P, Rizk NW, et al. Adverse outcomes associated with delayed intensive care unit transfers in an integrated healthcare system. J Hosp Med. 2012;7:224–230. [DOI] [PubMed] [Google Scholar]
- 20.Liu V, Turk BJ, Ragins A, et al. An electronic simplified acute physiology score-based risk adjustment score for critical illness in an integrated healthcare system. Crit Care Med. 2013;41:41–48. [DOI] [PubMed] [Google Scholar]
- 21.Escobar G, Greene J, Scheirer P, et al. Risk adjusting hospital inpatient mortality using automated inpatient, outpatient, and laboratory databases. Med Care. 2008;46:232–239. [DOI] [PubMed] [Google Scholar]
- 22.van Walraven C, Escobar GJ, Greene JD, et al. The Kaiser Permanente inpatient risk adjustment methodology was valid in an external patient population. J Clin Epidemiol. 2010;63:798–803. [DOI] [PubMed] [Google Scholar]
- 23.Escobar GJ, Gardner M, Greene JG, et al. Risk-adjusting hospital mortality using a comprehensive electronic record in an integrated healthcare delivery system. Med Care. 2013;51:446–453. [DOI] [PubMed] [Google Scholar]
- 24.Kollef MH, Chen Y, Heard K, et al. A randomized trial of real-time automated clinical deterioration alerts sent to a rapid response team. J Hosp Med. 2014;9:424–429. [DOI] [PMC free article] [PubMed] [Google Scholar]
- 25.Escobar GJ, LaGuardia J, Turk BJ, et al. Early detection of impending physiologic deterioration among patients who are not in intensive care: development of predictive models using data from an automated electronic medical record. J Hosp Med. 2012;7:388–395. [DOI] [PubMed] [Google Scholar]
- 26.Escobar GJ. Critical Care Syndrome Surveillance Using the Electronic Medical Record: Gizmo Idolatry or Practical Solution? Work in Progress at Kaiser Permanente: the EDIP project. San Diego, CA: Platform presentation at the American Thoracic Society meeting; 2014. [Google Scholar]
- 27.Selby JV. Linking automated databases for research in managed care settings. Ann Intern Med. 1997;127:719–724. [DOI] [PubMed] [Google Scholar]
- 28.Butler SM, Louis TA. Random effects models with non-parametric priors. Stat Med. 1992;11:1981–2000. [DOI] [PubMed] [Google Scholar]
- 29.National Committee for Quality Assurance. HEDIS 2015, Volume 2: Technical Specifications. Washington, DC: National Committee for Quality Assurance; 2014. [Google Scholar]
- 30.QualityNet. QualityNet. 2015. Available at: http://www.qualitynet.org/dcs/ContentServer?c=Page&pagename=QnetPublic/Page/QnetTier4&cid=121906985584. Accessed April 1, 2015.
- 31.Agency for Healthcare Research and Quality. Ambulatory Care Sensitive Conditions. 2014. Available at: http://www.qualityindicators.ahrq.gov/Downloads/Software/SAS/V45/Software_Instructions_SAS_V4.5.pdf. Accessed December 5, 2014. [DOI] [PubMed]
- 32.Harrell F. Regression Modeling Strategies With Applications to Linear Models, Logistic Regression, and Survival Analysis. New York, NY: Springer Verlag; 2001. [Google Scholar]
- 33.Breiman L. Random forests. Machine Learning. 2001;45:5–32. [Google Scholar]
- 34.Hothorn T, Hornik K, Zeileis A. Unbiased recursive partitioning: a conditional inference framework. J Comput Graph Stat. 2006;15:651–674. [Google Scholar]
- 35.Bishop CM. Neural Networks for Pattern Recognition.: Oxford: Clarendon Press; 1995. [Google Scholar]
- 36.Venables WN, Ripley BD. Modern Applied Statistics with S. New York, NY: Springer Science+Business Media LLC; 2002. [Google Scholar]
- 37.Bishop CM. Pattern Recognition and Machine Learning. Berlin: Springer; 2006. [Google Scholar]
- 38.Hastie T, Tibshirani R, Friedman JH. The Elements of Statistical Learning: Data Mining, Inference, and Prediction. New York, NY: Springer Verlag; 2009. [Google Scholar]
- 39.Render ML, Kim HM, Welsh DE, et al. Automated intensive care unit risk adjustment: results from a National Veterans Affairs study. Crit Care Med. 2003;31:1638–1646. [DOI] [PubMed] [Google Scholar]
- 40.Cook NR. Use and misuse of the receiver operating characteristic curve in risk prediction. Circulation. 2007;115:928–935. [DOI] [PubMed] [Google Scholar]
- 41.Pencina MJ, D’Agostino RB, Sr., D’Agostino RB, Jr., et al. Evaluating the added predictive ability of a new marker: from area under the ROC curve to reclassification and beyond. Stat Med. 2008;27:157–172; discussion 207–212. [DOI] [PubMed] [Google Scholar]
- 42.Pepe MS, Kerr KF, Longton G, et al. Testing for improvement in prediction model performance. Stat Med. 2013;32:1467–1482. [DOI] [PMC free article] [PubMed] [Google Scholar]
- 43.Deyo RA, Cherkin DC, Ciol MA. Adapting a clinical comorbidity index for use with ICD-9-CM administrative databases. J Clin Epidemiol. 1992;45:613–619. [DOI] [PubMed] [Google Scholar]
- 44.Kind AJ, Jencks S, Brock J, et al. Neighborhood socioeconomic disadvantage and 30-day rehospitalization: a retrospective cohort study. Ann Intern Med. 2014;161:765–774. [DOI] [PMC free article] [PubMed] [Google Scholar]
- 45.Hayward RA. Access to clinically-detailed patient information: a fundamental element for improving the efficiency and quality of healthcare. Med Care. 2008;46:229–231. [DOI] [PubMed] [Google Scholar]
- 46.Puopolo KM, Draper D, Wi S, et al. Estimating the probability of neonatal early-onset infection on the basis of maternal risk factors. Pediatrics. 2011;128:e1155–e1163. [DOI] [PMC free article] [PubMed] [Google Scholar]
- 47.Escobar GJ, Puopolo KM, Wi S, et al. Stratification of risk of early-onset sepsis in newborns ≥34 weeks’ gestation. Pediatrics. 2014;133:30–36. [DOI] [PMC free article] [PubMed] [Google Scholar]
- 48.Escobar GJ, Puopolo KM, Fischer AF, et al. Probability of neonatal early-onset sepsis based on maternal risk factors and the infant’s clinical presentation. 2014. Available at: http://www.dor.kaiser.org/external/DORExternal/research/InfectionProbabilityCalculator.aspx. Accessed January 9, 2015.
- 49.Gunderson Health System. Respecting choices advance care planning. Available at: http://www.gundersenhealth.org/respecting-choices. Accessed March 28, 2015.
- 50.Donze J, Lipsitz S, Schnipper JL. Risk factors for potentially avoidable readmissions due to end-of-life care issues. J Hosp Med. 2014;9:310–314. [DOI] [PubMed] [Google Scholar]
Associated Data
This section collects any data citations, data availability statements, or supplementary materials included in this article.