


Nucl. Acids Res. 43 (3): 1380–1391. doi: 10.1093/nar/gkv050
The authors wish to draw attention to an error in their published article. Gene expression changes following miRNA transfection were obtained from multiple studies, some of which reported log10 and others log2 fold changes and the authors did not apply the appropriate transformation to ensure that all data sets had a uniform base. Applying this transformation results in a larger range of the y-axis in Figure 2a, and has a small impact on the curves showing the relative performance of different miRNA target prediction methods. The findings and conclusions of the article remain valid. A new Figure 2 is included below. The legends of Figure 3 and of the supplementary figures are also amended to specify the base of the logarithm for the reported log fold-changes. Finally, an error occurred in the upload of the supplementary table 1 which resulted in some rows being duplicated. The authors hereby provide the correct version of this table as well.
Figure 2.
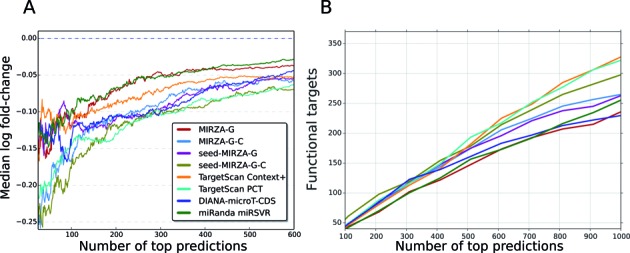
Comparative evaluation of various models. (A) Models’ performance in predicting mRNA down-regulation following miRNA transfection. The expectation is that a model performs well when its top predicted targets undergo the strongest downregulation after miRNA transfection. Y-axis shows log2 fold changes. (B) Estimated number of functional targets for different methods as the function of the number of top predictions. Variants of the MIRZA-G model are described in Table 2. The other tested models are TargetScan Context+, TargetScan PCT, DIANA-microT-CDS and miRanda-mirSVR (the most conservative predictions). See text for additional details on these methods.
New caption for Figure 3: Relationship between the prediction scores obtained with different target prediction methods and the extent of down-regulation of target mRNAs upon siRNA transfections. (A) Average over the siRNAs in the data set of Birmingham et al. (12). (B) Average over the siRNAs from Jackson et al. (13). (C) Data from an individual siRNA identified by van Dongen et al. (14) to have prominent off-target effects. (D) Data from an individual siRNA identified by van Dongen et al. (14) to have modest off-target effects. See also Table 2 and the text for details on the methods. Y-axis shows log10 fold changes.
The authors wish to apologize to the readers for this error and thank David Bartel for pointing it out.
Supplementary Material
SUPPLEMENTARY DATA
Supplementary Data are available at NAR Online.
Associated Data
This section collects any data citations, data availability statements, or supplementary materials included in this article.