Abstract
An atlas-based IMRT planning technique for prostate cancer was developed and evaluated. A multi-dose atlas was built based on the anatomy patterns of the patients, more specifically, the Percent Distance to the Prostate (PDP) and the concaveness angle formed by the seminal vesicles relative to the anterior-posterior axis. The 70-case dataset was classified using a k-medoids clustering analysis to recognize anatomy pattern variations in the dataset. The best classification, defined by the number of classes or medoids, was determined by the largest value of the average silhouette width. Reference plans from each class formed a multi-dose atlas. The atlas-guided planning (AGP) technique started with matching the new case anatomy pattern to one of the reference cases in the atlas; then a deformable registration between the atlas and new case anatomies transferred the dose from the atlas to the new case to guide inverse planning with full automation. Additional 20 clinical cases were re-planned to evaluate the AGP technique. Dosimetric properties between AGP and clinical plans were evaluated. The classification analysis determined that the 5-case atlas would best represent anatomy patterns for the patient cohort. AGP took approximately 1 min on average (corresponding to 70 iterations of optimization) for all cases. When dosimetric parameters were compared, the differences between AGP and clinical plans were less than 3.5%, albeit some statistical significances observed: Homogeneity index (p > 0.05), conformity index (p < 0.01), bladder gEUD (p < 0.01), and rectum gEUD (p = 0.02). Atlas-guided treatment planning is feasible and efficient. Atlas predicted dose can effectively guide the optimizer to achieve plan quality comparable to that of clinical plans.
Keywords: pattern recognition, atlas, prostate cancer, IMRT
1. Introduction
Atlas-based medical image segmentation techniques have been successfully implemented to address the anatomical variations between reference and query cases (Yang et al., 2014; Han et al., 2008; Stapleford et al., 2010; Strassmann et al., 2010). Classifications based on multiple anatomy patterns divided the datasets into various clusters to further enhance the similarity fidelity between reference and query cases (Albano et al., 1978; Jain et al., 2000). To match a new case to the most similar atlas in such multi-case atlas scheme, pattern recognition was used to find regularities in the image data. Existing segmentations of the atlas were then used to predict the new image’s segmentation (Langerak et al., 2013).
Akin to atlas-based image processing, several adaptive radiation therapy (ART) techniques have employed a similar approach to refine the adaptive plans, thus reducing the planning time and accelerating the clinical workflow. By treating the original plan as the reference (atlas), plan parameters were adjusted to re-conform the dose distribution to daily anatomy thus correcting for inter-fractional anatomical variations (Ahunbay et al., 2009; Ahunbay et al., 2008; Ahunbay et al., 2010; Li et al., 2011; Li et al., 2010; Wu et al., 2008; Thongphiew et al., 2009). In this process, the original dose distribution served as single atlas to predict the plan parameters or adjustments corresponding to daily anatomy variation. For example, Ahunbay et al. developed an online adaptive treatment planning technique using segment aperture morphing (SAM) and segment weight optimization (SWO) to adapt intensity-modulated radiation therapy (IMRT) plans for inter-fractional motion correction (Ahunbay et al., 2008; Ahunbay et al., 2009; Ahunbay et al., 2010). Wu et al. and Li et al. also developed a fast re-optimization technique for on-line ART (Li et al., 2011; Li et al., 2010; Wu et al., 2008; Thongphiew et al., 2009). This ART method used the original plan as the base dose distribution and applied a deformable registration technique to generate the goal dose distribution for subsequent treatment fractions that require re-optimization. The goal dose, which took the daily anatomical variations into account, can guide the optimizer to automatically generate new fluence maps in 1–2 minutes. Plans resulting from this method showed daily target coverage and organ-at-risk (OAR) sparing comparable to those planned by expert planners (Wu et al., 2008).
As an extension to the aforementioned atlas-based ART methods, which were shown to work well for correcting plans for inter-fractional variation for a single patient, prediction of dose across patients for general treatment planning is challenging because inter-patient anatomical variations are often more substantial. The present work investigates the feasibility and benefit of developing and using a multi-dose atlas for IMRT planning. To address the inter-patient anatomical variation, pattern recognition was incorporated to classify the anatomy into multiple clusters to increase the fidelity in matching anatomy and thus dose patterns. Patient anatomical variations were represented via distinguishing patterns and classified into clusters. Under this framework, a new case was first classified to an anatomy cluster. The representative dose of that cluster, i.e. the atlas dose, was then warped to the new anatomy via deformable registration. The warped dose served as guidance for subsequent treatment planning.
Previously different methods and strategies to improve IMRT plan quality and planning efficiency have been reported. For patients with the same disease and staging, class solutions have been proposed to provide dose objective guidance and/or other optimization parameter guidance (Chanyavanich et al., 2011; Wu et al., 2011; Zhu et al., 2011; Yuan et al., 2012; Lian et al., 2013; Appenzoller et al., 2012). One group of methods focused on finding the anatomical match between the existing and the new patient cases based on certain similarity metric. The new case then used part or all of the matched plan parameters (dose, fluence maps, MLC segments, etc.) as starting point of the optimizer, and additional manual refinement is required to generate the final plan. For example, Chanyavanich et al. used mutual information (MI) match of the beam’s eye view (BEV) projections of the structure contours (Chanyavanich et al., 2011) to find reference case from a library of previous clinical prostate plans; while Wu et al. matched the new patient case to the database using the overlap volume histogram (OVH) calculated over the PTV-OAR geometry (Wu et al., 2011). These methods relied on a sufficiently large library, consisting of typically over 100 cases (Chanyavanich et al., 2011), so that a very close match can be found and the existing plan dosimetric characteristics can be directly applied to guide the planning of the new case. Another group of methods took the machine-learning-based approach, where the relationships between certain anatomy features (the input) and dosimetry features (the output) were formulated (Zhu et al., 2011; Yuan et al., 2012; Lian et al., 2013; Appenzoller et al., 2012). Zhu et al (Zhu et al., 2011) and Yuan et al (Yuan et al., 2012) proposed a machine learning model to provide patient-specific OAR sparing goals. This method did not require matching specific query case with a database of expert cases. Rather, the OAR sparing goals were computed by a prediction algorithm. Lian et al. (Lian et al., 2013) further expanded the model to analyze inter-technique and inter-institutional performance of these models, demonstrating highly conformal dose distribution was achieved with Tomotherapy and static-gantry IMRT techniques at a comparable level. Appenzoller et al. also proposed patient-specific OAR sparing models based on the correlation between the expected DVH within certain distance range to the PTV surface (Appenzoller et al., 2012). The purpose of this research is to offer an alternative that does not require large plan library to begin with or a complexed modeling process. Departing from aforementioned methods, shape analysis was the basis used for creating guidance for treatment planning in this study. The pattern recognition originating from image segmentation was introduced to treatment planning. The introduction of multi-dose atlas, combined with shape analysis of patient anatomy, aimed at providing a new and simpler solution to accelerating the treatment planning process for new patient while maintaining clinically acceptable plan quality. The authors believe that this is the first attempt using shape pattern recognition to create and use atlas for guiding treatment planning.
2. Methods and Materials
90 prostate IMRT cases were retrospectively studied under an IRB protocol. 70 cases were randomly selected to build the multi-dose atlas and the remaining 20 cases were used to evaluate the performance of the AGP technique. The clinical target volume (CTV) included both the prostate and the seminal vesicles (SV). The PTV was expanded from the CTV with a 5 mm margin.
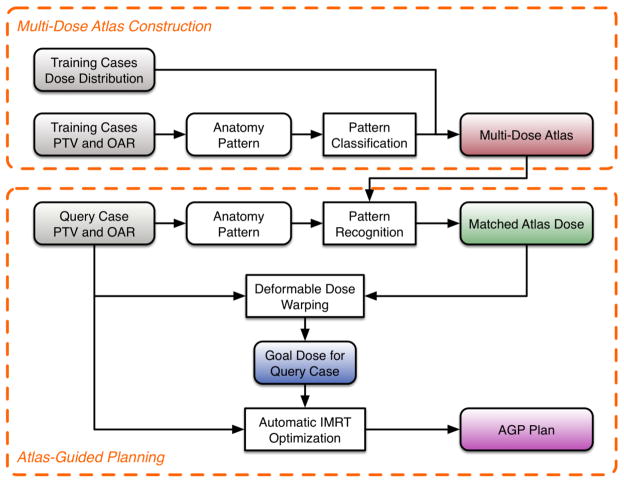
The workflow for the AGP (Figure 1) consists of two major parts: (1) construction of the multi-dose atlas and (2) atlas-guided planning. The first part was performed only once, while the second part was performed for each new patient and included query-atlas matching, deformable dose warping, and automated plan optimization. Each component is explained in detail in the following sections.
Figure 1.
Flowchart of the AGP technique.
2.1 Construction of the multi-dose atlas
Multi-dose atlas was chosen to reduce the demand of transforming reference high conformal dose distributions across the large anatomy variations in the patient population. The training cases were classified based on their anatomy shape patterns, rather than the similarity of volumes. The shape pattern analysis considered the topology of different anatomies, and condensed them to a pattern map that summarizes the overall anatomy variations. In this study, two patterns were chosen to distinguish and represent anatomical variations among prostate cancer patients. As shown in Figure 2(a), the first pattern measured the concaveness of the posterior wall of the PTV, encoding dose falloffs around the target in this region. Hunt et al. found that the concaveness of the PTV was strongly associated with normal tissue sparing (Hunt et al., 2002). We have also found that for prostate IMRT, the PTV-rectum boundary shape was a significant anatomical feature affecting dosimetry. To extract this shape parameter, the PTV was partitioned into two components: PTV_SV (SV including the 5 mm margin except inferiorly where the prostate and the SV are connected), and PTV_prostate (the remaining portion of the PTV). For PTV_SV, the axial slice with the most posterior point (xSVx_extreme, ySVx_extreme) was located. On the same slice, (xSVmin, ySVmin) and (xSVmax, ySVmax), the two points where the PTV_SV contour intersected with the anterior-posterior (AP) axis, were also located. This first pattern was defined as the PTV_SV concaveness angle θ located between the AP axis and the line connecting points (xSVx_extreme, ySVx_extreme) and (xSVmax, ySVmax) (Equation (1)).
Figure 2.
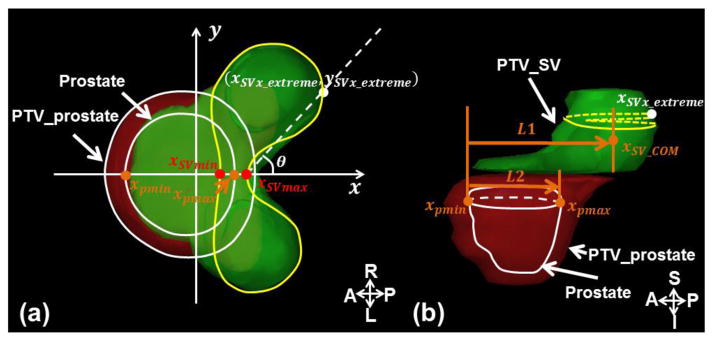
(a) Axial view showing the slice where the PTV_SV (yellow contour) has the most posterior point of the SV; the concaveness angle was defined as the angle between AP axis and the dashed line connecting the distal point (xSVx_extreme, ySVx_extreme) and the point (xSVmax, ySVmax); (b) Sagittal view through a central slice depicting the PTV_SV (green shadow), which is the SV plus the 5 mm margin (except inferiorly), and the PTV_prostate (red shadow). The Percent Distance to the Prostate (PDP) was defined as the ratio of L1 (the AP distance between the SV COM and the prostate anterior border) and L2 (the AP dimension of the prostate).
| (1) |
Hence, θ indicates the concaveness of the PTV posterior wall, and is a determining factor for the dose falloff/gradient around the anterior rectal wall.
The second pattern focused on the superior-inferior direction, summarizing the overall drop of the SVs from the prostate along the AP direction (Figure 2(b)). The center of mass (COM) of the SV (xSV_com, ySV_com) and the range of the prostate in the AP direction, xpmin and xpmax, were calculated. The relative position of the SV with respect to the prostate was defined as the distance between SV’s COM to the prostate anterior border, relative to the AP dimension of the prostate. This metric was referred as the Percent Distance to the Prostate (PDP) (Equation (2)).
| (2) |
The PDP and the concaveness angle θ formed a 2-dimensional pattern map, with each axis representing one anatomy pattern and each case’s position on the map determined by the numerical values of the pattern. The k-medoids algorithm (Kaufman and Rousseeuw, 1987) classifies the training cases by minimizing the sum of the intra-cluster Euclidean distance (Equation (3)) of the patterns,
| (3) |
where S is the selected training set of atlas, xj is the case in the cluster Sj. Generally, a medoid is defined as the object in a cluster, with the average distance to all the other objects in the same cluster being the minimal. Each medoid is the representative case for its cluster and hence the atlas case.
To determine the optimal size k of the atlas, the average silhouette width for each k-medoids scheme was calculated. The silhouette value for each data (Equation (4)) was defined by Rousseeuw (Rousseeuw, 1987):
| (4) |
where a(i) is the average dissimilarity of i with all other data in the same cluster, and b(i) is the lowest average dissimilarity of i to any other cluster. The Euclidean distance between two data points on the pattern map was used as the similarity measure. The average silhouette width, the arithmetic mean silhouette value of all data, reflects how well the data were partitioned and clustered with higher average silhouette width corresponding to better classification (Rousseeuw, 1987). Similar clustering algorithm, the k-means clustering algorithm, was used in leaf sequencing by breaking the optimal fluence into smaller groups or clusters in Pinnacle treatment planning system (Philips Healthcare, Andover, MA) (Seco et al., 2006).
With the k-medoids classification, the final classification result was dependent on the selection of k objects as the initial medoids to start the classification iteration. To avoid the iteration from being trapped in a local minimum, the classification procedure was repeated 5~6 times to find the final medoids with the lowest sum of within-cluster distances. A different set of randomly selected initial medoids was used for each repetition.
2.2 Atlas-guided plan generation
The remaining 20 cases outside the training pool were used as query cases to evaluate the AGP technique. The process of applying AGP to a new prostate case is described in the following steps:
A. Matching the query case to the atlas
First, the query case’s anatomy pattern was extracted the same way as described in 2.1 and the PDP and θ values determined the case’s position on the pattern map. The closest atlas was then matched to the query case.
To account for local and fine variations between the query and atlas cases, deformable image registration (Thongphiew et al., 2009; Li et al., 2010; Li et al., 2011; Wu et al., 2008) was performed to enhance anatomy-dose correlations between the query and atlas cases. In this study, the MIM Maestro™ system (MIM Software Inc, Cleveland, OH), which uses the free-form deformation algorithm, was used to deform the matched atlas case’s anatomy onto the query case’s anatomy using contour-based deformable image registration (Wu et al., 2008). The resulting 3D deformation vector fields from the registration process were applied to warp the atlas dose distribution towards the query case’s anatomy. Because the deformation vector fields encode the local variation between the atlas case’s anatomy and the query case, the warped dose follows the same transformation and conforms to the query case’s anatomy (Wu et al., 2008; Li et al., 2010; Li et al., 2011). This dose was referred to as the goal dose, representing a highly conformal 3D dose distribution to be achieved subsequently using inverse planning (Wu et al., 2008).
B. Atlas-guided planning
In our routine clinical planning protocol, inverse planning or optimization objectives are specified as dose-volume objectives. Following the same planning protocol, the AGP optimization objectives were sampled from the goal dose and imported into the Eclipse™ (Varian Medical Systems, Palo Alto, CA) treatment planning system (TPS). The optimization process was subsequently run without human intervention. In this study, fluence-based optimization (Dose Volume Optimizer, DVO) provided in our TPS was used. The AGP technique provides the planner with the dose-volume objectives to start the fluence optimization.
Existing clinical plans for the query cases, which were manually designed for clinical treatment, were used as benchmarks to evaluate AGP plan quality. Beam configurations for both sets of plans follow our institutional template. The only difference between the generation process of AGP plans and clinical plans is that for AGP plans the dose-volume objectives are generated automatically and fixed during optimization, whereas for clinical plans the dose-volume objectives are manually generated and adjusted during optimization. Apart from the difference in human intervention, the algorithms for fluence optimization and leaf sequence calculation are identical between AGP and clinical plans.
2.3 AGP plan quality evaluation
First, the spatial dose distribution was visually inspected by an experienced physicist to identify any hotspots in sensitive OARs to ensure that the overall dose distributions met clinical treatment quality. If any of the hotspots were located in unfavorable locations, the AGP plan was noted as a major deviation from the clinical planning quality.
Quantitatively, the paired AGP and clinical plans were compared. All dosimetric comparisons were tested for significance using the two-sided Wilcoxon Signed Rank test. A p-value below 0.05 was considered statistically significant.
Key DVHs parameters of the PTV and two main OARs (the bladder and the rectum) were also evaluated. For PTV, the homogeneity index (HI) (Wu et al., 2003) was analyzed,
| (5) |
where D2 and D98 are doses to 2% and 98% of the PTV volume, respectively, and DRxis the prescription dose. The conformity index (CI) described by Paddick (Paddick, 2000) was compared between the paired plans,
| (6) |
where PTV is the planning target volume, PIV is the prescription isodose volume and PTVPIV is the prescription isodose volume in the PTV. The CI indicates how well the prescription dose (and similarly high dose) conforms to the PTV.
The OAR sparing was compared using the generalized equivalent-uniform-dose (gEUD) defined by Niemierko (Equation (7)) (Niemierko, 1999).
| (7) |
where vi, Di correspond to the percent volume of each voxel and the absolute dose of each voxel in the OAR, respectively, and the a value was set to 6 (Oliver et al., 2011) for both the bladder and rectum. It was used as a summary metric of the entire DVH curve and as an overall sparing quality index (Censor et al., 2006).
Additional dosimetric parameters, such as volumes receiving 100% and 65% of the prescription dose, were compared. These parameters represent specific dose ranges that physicians examine when they review plans and are used in our clinical protocol for plan quality assessment. Finally, the combined monitor units (MUs) of each plan were compared to assess delivery efficiency.
3. Results
3.1 Atlas Construction
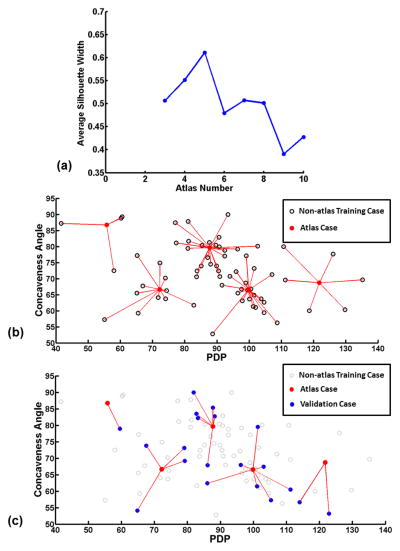
70 cases were classified using the k-medoids algorithm. The average silhouette width was calculated for various classification schemes (Figure 3(a)). An atlas consisting of 5 cases was chosen as its classification had highest average silhouette width. The result atlas is shown in Figure 3(b), where the 5 atlas cases are shown in solid-red dots. The rest of training cases (i.e. non-atlas cases) are shown in black circles, connected to their atlas cases or medoids with the red lines. Further, the validation cases are plotted on this map as solid-blue dots (Figure 3(c)), and the red lines indicate the atlas cases they were matched to.
Figure 3.
(a) The average silhouette width for classifications with different class numbers. A higher average silhouette width corresponds to a better classification. (b) The anatomical pattern map for all 70 training cases used for classification and atlas selection. 5 out of the 70 cases were selected as atlas cases (solid-red dots) based on the k-medoids classification results in (a). The rest non-atlas cases (black circles) are connected to their corresponding atlas cases. (c) 20 test cases (solid-blue dots) are plotted on top of the classification in (b) where non-atlas cases are shown as grey circles. The red lines connecting the atlas and test cases indicate the atlas-query case matching.
3.2 Goal dose distribution
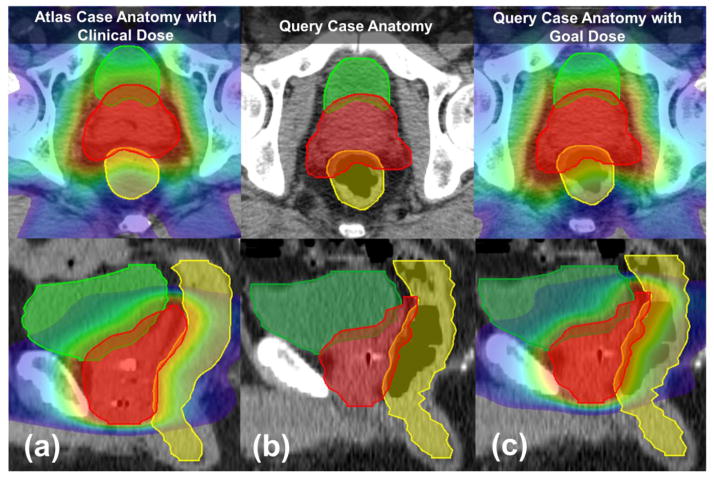
Figure 4 shows an example of a query case (b) matched to an atlas case (a) and the 3D-warped goal dose (c) from the atlas to the query case anatomy. As shown, the selected atlas and query case were similar in key features, e.g. displaying similar concavity of the PTV posterior border, but not necessarily in volume (PTV volume of atlas vs. query case: 118.4 cc vs. 193.0 cc).
Figure 4.
Example of a goal dose that has been 3D-warped from the atlas dose. The bladder, rectum, and PTV volumes are delineated in green, yellow, and red, respectively. (a) The atlas case’s anatomy with clinical dose distribution. (b) The query case’s anatomy with similar shape pattern to the matched atlas case. (c) The query case’s anatomy with the goal dose warped from the atlas dose.
3.3 PTV coverage and OAR sparing
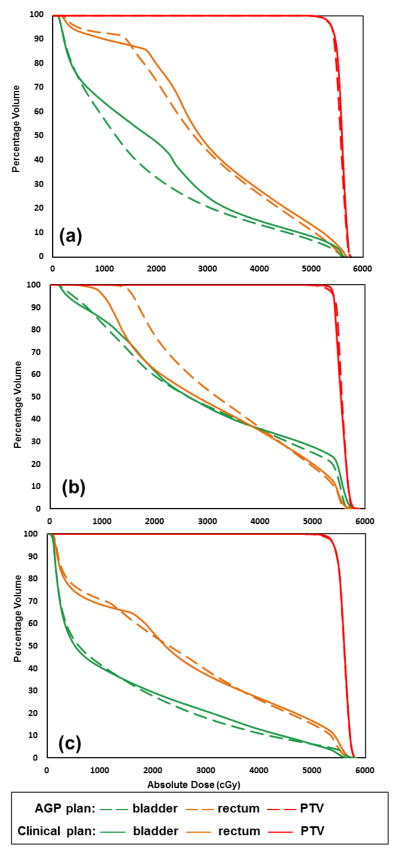
Visual inspection of the AGP plans showed no major deviations from typically observed clinical plan quality, i.e. no excessive hotspot was observed in sensitive OARs. Figure 5 shows 3 plans that describe the range of observed AGP performance in this study. Overall, the AGP plans provided similar high dose sparing for the OARs as the clinical plans, which was consistent throughout the query case cohort. For the medium to low dose regions, variations were observed in some cases. For case #07 (Figure 5(a)), the AGP plan displayed better bladder sparing in the medium dose range. The AGP plan for case #11 (Figure 5(b)) showed worse low dose sparing for the rectum. In most cases (case #16 shown as an example in Figure 5(c)) similar plan quality was observed between two plans.
Figure 5.
Example DVHs from the AGP and clinical plans.
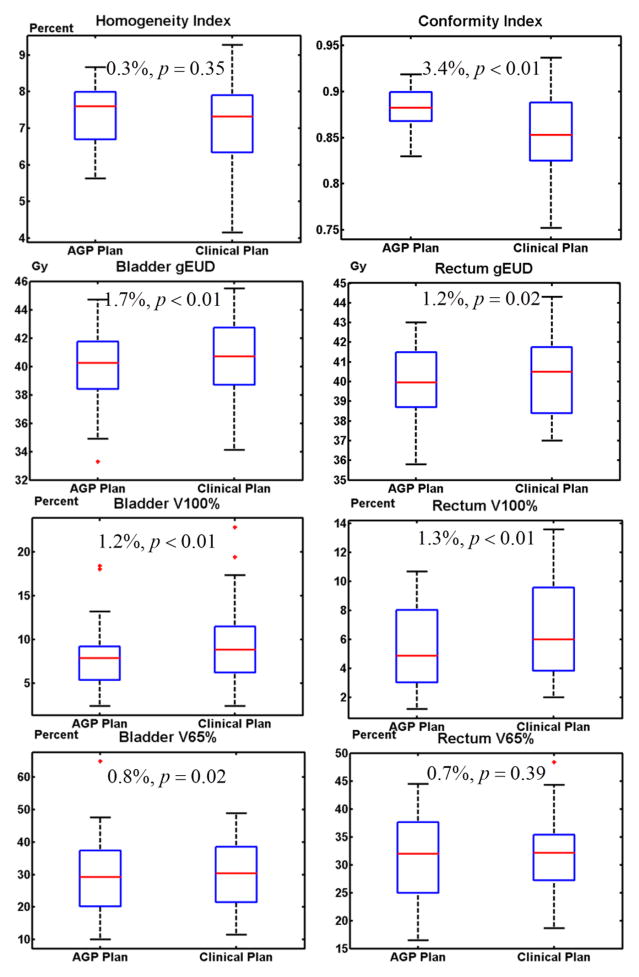
Comparison of the dosimetric data and the corresponding p-values are shown in the boxplots in Figure 6. The conformity index of the AGP plan was statistically significantly higher than that of the clinical plan (p<0.01). The overall OAR sparing in the AGP plan, in terms of bladder gEUD and rectum gEUD, was also statistically significant: p<0.01 for bladder and p=0.02 for rectum. The 100% prescription dose volume for both the bladder and rectum (V100%) of the AGP plan were significantly smaller than those of the clinical plan: p<0.01 for bladder and p<0.01 for rectum. The V65% for the bladder also showed significant improvement (p=0.02). However, it is important to note that these improvements were generally small in magnitude, with differences mostly within 2%, excluding the CI which displayed a difference of 3.4%. Thus while the comparison of the dosimetric parameters implies statistical significance, these differences may not be of clinical significance. In other words, the two techniques produced plans that are clinically similar. Other parameters (homogeneity indices: p=0.35; rectum V65%: p=0.39) were also similar between the AGP and clinical plans.
Figure 6.
Boxplots of dosimetric parameters for AGP and clinical plans. The percent difference and the statistical significance between two plans were labeled.
3.4 Planning time and monitor unit
With the optimization objectives derived from the goal dose, the final AGP plan generation was automated with 70 continuous iterations taking about 1 minute to complete (Eclipse™ 11). The MUs for the AGP and clinical plans were similar: 116±24 MU and 124±30 MU (p=0.17), which corresponds to similar delivery time and leakage radiation.
4. Discussion
In this study, an atlas-guided planning technique was developed and investigated for its feasibility and benefit in prostate IMRT planning. Based on the classification results, a 5-case atlas was constructed and then used to guide treatment planning. The quality of plans generated with atlas guidance was compared to that of clinical plans.
The multi-dose atlas was used to predict goal dose to guide the inverse planning/optimization process. The choice of multi-dose atlas reduces the demand of transforming highly conformal dose distributions across the large anatomy variations in the patient population. Similar to image segmentation, the power of deformable image registration is limited because the assumption that the dose distribution follows the deformation of anatomy does not hold when anatomical variations become too large. For example, the deformation from a large to a small PTV_SV concaveness angle (i.e. from a round-shaped PTV to a concave-shaped PTV) will likely to introduce non-realistic dose gradient around the PTV near the rectal wall. Therefore, the deformable registration with a single reference case could be less favorable when large anatomical variations exist especially across different patients.
Plan quality evaluations in this study demonstrated comparable quality when compared to clinical plans. The paired AGP and clinical plans showed high agreement in high dose regions, while in low dose regions the performance was less consistent. The reason are likely to be of two folds: (1) Due to the fact that human planners often pay less attention to bladder and rectum low dose regions when compared to high dose regions, inter-patient variation of the low dose region sparing for OARs already exist for clinical plans. (2) Low dose regions do not conform closely to the target as the high dose regions do. Therefore, these regions may not be effectively warped by deformable image registration. These two factors partially explained the inconsistent low-dose region performance of AGP plans when compared to clinical plans. Further study is warranted to better regulate low dose regions.
The goal dose is a complete 3D dose distribution and can also be directly used to generate IMRT plans without extracting them into DVH objectives. Thongphiew et al. (Wu et al., 2008) utilized a voxel-based optimization algorithm formulated as a linear goal programming (LGP) model (Chankong and Haimes, 1983), which was especially suitable for fast on-line plan re-optimization. Incorporating such algorithms in our technique may potentially further reduce overall treatment planning time, but it is currently not compatible with the clinical TPS that we are using. Further, IMRT was chosen as the treatment technique for prostate cancer in this study. However, the AGP technique is not just specific to IMRT and can also be directly applied to any treatment technique which calls for an inverse treatment planning algorithm such as volumetric modulated arc therapy (VMAT) and TomoTherapy® (Accuray, Inc., Sunnyvale, CA).
The anatomy shape-based multi-dose atlas and the deformable image registration driven dose transfer are the two essential components of this AGP technique. The shape pattern analysis considers the topology of different anatomies, and condenses them to a pattern map that summarizes the overall anatomy variations. The deformable image registration-driven dose transfer further fine tunes the local-regional anatomy-dose conformity match and eliminates the need to search for an exact match between atlas and query anatomies. The combination of these two techniques in the AGP technique is able to provide accurate dose guidance with only a 5-case atlas and to guide the optimization process with full automation. Although some OAR sparing variations in the low dose region are observed, overall the results show comparable plan quality to that of the clinical plans, making the AGP technique a promising treatment planning tool with improved efficiency while maintaining similar plan quality.
The efficiency improvement generated by AGP technique focuses on the optimization process, in that it eliminated the trial-and-error process of manually placing dose-volume objectives, which is typically seen in human planners. For relative simple geometries like prostate IMRT, optimization constraints may be estimated by experienced planner. Planners may also utilize adding rings or control structures strategy to regulate the dose gradient. The amount of time reduced by implementing the AGP automated planning process therefore varies depending on the institution and planner. For more complex sites like head-and-neck, the tweaking of constraints without knowing the optimal patient-specific constraint settings upfront can be time-consuming and often require multiple trials. This is due to the increased OAR shape concavity, more OARs involved, and more variations of PTV shapes and sizes. Also, due to anatomical differences, patient-specific clinical trade-off decision may be made, which will introduce plan variability across the plan cohort. Although the AGP technique in principle can be generalized to other treatment sites, these factors require further analysis before expanding the AGP technique to complex treatment sites such as HN. Although the AGP technique requires additional time to generate patient-specific constraints, the total planning process can still be substantially shortened because no human intervention is needed once the optimizer starts. Currently with in-house developed MATLAB-based package, the patient-specific constraints can be generated within five minutes. Together with the preparation time for importing dose-volume objectives, for optimization, and for dose calculation, the overall treatment planning can be accomplished well within 20 minutes. Meanwhile, as indicated by the total MU comparison, the delivery time of this automatically generated plans were similar to manually optimized plans. This AGP technique can be used to all dose/dose-volume objectives driven optimization process. Since the dose/dose-volume objectives are based on anatomy, the AGP technique is able to generate the objectives regardless of delivery technique. Therefore, the AGP technique can also be applied to and benefit VMAT planning.
The results in this study were based on fluence-based optimization algorithm (DVO) implemented in our clinical TPS systems (Varian Medical Systems, 2012). Because this method provides clinically acceptable optimization objectives without depending on the optimization algorithm, the benefit of automating prostate treatment planning using this method could be extended to other treatment planning systems that employ different algorithms, such as direct machine parameter optimization (DMPO) or direct aperture optimization (DAO). However the quantitative benefits for other optimizers might be different, and warrant further evaluation.
5. Conclusion
Atlas-guided treatment planning is feasible and efficient. Atlas-based patient-specific dose distribution objectives can effectively guide the optimizer to achieve similar quality when compared to clinical plans.
Acknowledgments
The authors would like to thank Adam Neff (MIM Software Inc, Cleveland, OH) for technical support. This work is partially supported by NIH/NCI R21CA161389 and a master research grant from Varian Medical Systems.
References
- Ahunbay EE, Peng C, Chen GP, Narayanan S, Yu C, Lawton C, Li XA. An on-line replanning scheme for interfractional variations. Med Phys. 2008;35:3607–15. doi: 10.1118/1.2952443. [DOI] [PubMed] [Google Scholar]
- Ahunbay EE, Peng C, Godley A, Schultz C, Li XA. An on-line replanning method for head and neck adaptive radiotherapy. Med Phys. 2009;36:4776–90. doi: 10.1118/1.3215532. [DOI] [PubMed] [Google Scholar]
- Ahunbay EE, Peng C, Holmes S, Godley A, Lawton C, Li XA. Online adaptive replanning method for prostate radiotherapy. International journal of radiation oncology, biology, physics. 2010;77:1561–72. doi: 10.1016/j.ijrobp.2009.10.013. [DOI] [PubMed] [Google Scholar]
- Albano C, Dunn W, III, Edlund U, Johansson E, Norden B, Sjostrom M, Wold S. Four Levels of Pattern Recognition. Computer Technique and Optimization. 1978;103:429–43. [Google Scholar]
- Appenzoller LM, Michalski JM, Thorstad WL, Mutic S, Moore KL. Predicting dose-volume histograms for organs-at-risk in IMRT planning. Med Phys. 2012;39:7446–61. doi: 10.1118/1.4761864. [DOI] [PubMed] [Google Scholar]
- Censor Y, Bortfeld T, Martin B, Trofimov A. A unified approach for inversion problems in intensity-modulated radiation therapy. Physics in medicine and biology. 2006;51:2353–65. doi: 10.1088/0031-9155/51/10/001. [DOI] [PubMed] [Google Scholar]
- Chankong V, Haimes Y. Multiobjective Decision Making: Theory and Methodology. Amsterdam: North Holland; 1983. [Google Scholar]
- Chanyavanich V, Das SK, Lee WR, Lo JY. Knowledge-based IMRT treatment planning for prostate cancer. Medical Physics. 2011;38:2515. doi: 10.1118/1.3574874. [DOI] [PubMed] [Google Scholar]
- Han X, Hoogeman MS, Levendag PC, Hibbard LS, Teguh DN, Voet P, Cowen AC, Wolf TK. Atlas-based auto-segmentation of head and neck CT images. Medical image computing and computer-assisted intervention : MICCAI ... International Conference on Medical Image Computing and Computer-Assisted Intervention; 2008. pp. 434–41. [DOI] [PubMed] [Google Scholar]
- Hunt M, Hsiung CY, Spriou SV, Chui CS, Amols HI, Ling CC. EVALUATION OF CONCAVE DOSE DISTRIBUTIONS CREATED USING AN INVERSE PLANNING SYSTEM. International journal of radiation oncology, biology, physics. 2002;54:953–62. doi: 10.1016/s0360-3016(02)03004-3. [DOI] [PubMed] [Google Scholar]
- Jain A, Duin R, Mao J. Statistical Pattern Recognition: A Review. IEEE TRANSACTIONS ON PATTERN ANALYSIS AND MACHINE INTELLIGENCE. 2000;22:4–37. [Google Scholar]
- Kaufman L, Rousseeuw P. Clustering by Means of Medoids. Fac., Univ; 1987. [Google Scholar]
- Langerak TR, Berendsen FF, Van der Heide UA, Kotte AN, Pluim JP. Multiatlas-based segmentation with preregistration atlas selection. Med Phys. 2013;40:091701. doi: 10.1118/1.4816654. [DOI] [PubMed] [Google Scholar]
- Li T, Thongphiew D, Zhu X, Lee WR, Vujaskovic Z, Yin FF, Wu QJ. Adaptive prostate IGRT combining online re-optimization and re-positioning: a feasibility study. Phys Med Biol. 2011;56:1243–58. doi: 10.1088/0031-9155/56/5/002. [DOI] [PubMed] [Google Scholar]
- Li T, Zhu X, Thongphiew D, Lee WR, Vujaskovic Z, Wu Q, Yin FF, Wu QJ. On-line adaptive radiation therapy: feasibility and clinical study. Journal of oncology. 2010;2010:407236. doi: 10.1155/2010/407236. [DOI] [PMC free article] [PubMed] [Google Scholar]
- Lian J, Yuan L, Ge Y, Chera BS, Yoo DP, Chang S, Yin F, Wu QJ. Modeling the dosimetry of organ-at-risk in head and neck IMRT planning: An intertechnique and interinstitutional study. Medical Physics. 2013;40:121704. doi: 10.1118/1.4828788. [DOI] [PMC free article] [PubMed] [Google Scholar]
- Niemierko A. A generalized concept of equivalent uniform dose (EUD) Medical Physics. 1999;26:1100. doi: 10.1118/1.598063. [DOI] [PubMed] [Google Scholar]
- Oliver M, Bush K, Zavgorodn S, Ansbacher W, Beckham W. Understanding the impact of RapidArc therapy delivery errors for prostate cancer. Journal of applied clinical medical physics. 2011;12:32–43. doi: 10.1120/jacmp.v12i3.3409. [DOI] [PMC free article] [PubMed] [Google Scholar]
- Paddick I. A simple scoring ratio to index the conformity of radiosurgical treatment plans. Technical note. Journal of neurosurgery. 2000;93(Suppl 3):219–22. doi: 10.3171/jns.2000.93.supplement. [DOI] [PubMed] [Google Scholar]
- Rousseeuw PJ. Silhouettes: a graphical aid to the interpretation and validation of clustere analysis. Journal of Computational and Applied Mathematics. 1987;20:53–65. [Google Scholar]
- Seco J, Clark CH, Evans PM, Webb S. A quantitative study of IMRT delivery effects in commercial planning systems for the case of oesophagus and prostate tumours. The British journal of radiology. 2006;79:401–8. doi: 10.1259/bjr/91588055. [DOI] [PubMed] [Google Scholar]
- Stapleford LJ, Lawson JD, Perkins C, Edelman S, Davis L, McDonald MW, Waller A, Schreibmann E, Fox T. Evaluation of automatic atlas-based lymph node segmentation for head-and-neck cancer. International journal of radiation oncology, biology, physics. 2010;77:959–66. doi: 10.1016/j.ijrobp.2009.09.023. [DOI] [PubMed] [Google Scholar]
- Strassmann G, Abdellaoui S, Richter D, Bekkaoui F, Haderlein M, Fokas E, Timmesfeld N, Vogel B, Henzel M, Engenhart-Cabillic R. Atlas-based semiautomatic target volume definition (CTV) for head-and-neck tumors. International journal of radiation oncology, biology, physics. 2010;78:1270–6. doi: 10.1016/j.ijrobp.2010.01.029. [DOI] [PubMed] [Google Scholar]
- Thongphiew D, Wu QJ, Lee WR, Chankong V, Yoo S, McMahon R, Yin FF. Comparison of online IGRT techniques for prostate IMRT treatment: adaptive vs repositioning correction. Med Phys. 2009;36:1651–62. doi: 10.1118/1.3095767. [DOI] [PubMed] [Google Scholar]
- Varian Medical Systems. Eclipse algorithm reference guide. Palo Alto, CA: Varian Medical Systems Inc; 2012. [Google Scholar]
- Wu B, Ricchetti F, Sanguineti G, Kazhdan M, Simari P, Jacques R, Taylor R, McNutt T. Data-driven approach to generating achievable dose-volume histogram objectives in intensity-modulated radiotherapy planning. International journal of radiation oncology, biology, physics. 2011;79:1241–7. doi: 10.1016/j.ijrobp.2010.05.026. [DOI] [PubMed] [Google Scholar]
- Wu Q, Mohan R, Morris M, Lauve A, Schmidt-Ullrich R. Simultaneous integrated boost intensity-modulated radiotherapy for locally advanced head-and-neck squamous cell carcinomas. I: dosimetric results. International journal of radiation oncology, biology, physics. 2003;56:573–85. doi: 10.1016/s0360-3016(02)04617-5. [DOI] [PubMed] [Google Scholar]
- Wu QJ, Thongphiew D, Wang Z, Mathayomchan B, Chankong V, Yoo S, Lee WR, Yin FF. On-line re-optimization of prostate IMRT plans for adaptive radiation therapy. Phys Med Biol. 2008;53:673–91. doi: 10.1088/0031-9155/53/3/011. [DOI] [PubMed] [Google Scholar]
- Yang X, Wu N, Cheng G, Zhou Z, Yu DS, Beitler JJ, Curran WJ, Liu T. Automated Segmentation of the Parotid Gland Based on Atlas Registration and Machine Learning: A Longitudinal MRI Study in Head-and-Neck Radiation Therapy. International journal of radiation oncology, biology, physics. 2014;90:1225–33. doi: 10.1016/j.ijrobp.2014.08.350. [DOI] [PMC free article] [PubMed] [Google Scholar]
- Yuan L, Ge Y, Lee WR, Yin FF, Kirkpatrick JP, Wu QJ. Quantitative analysis of the factors which affect the interpatient organ-at-risk dose sparing variation in IMRT plans. Med Phys. 2012;39:6868–78. doi: 10.1118/1.4757927. [DOI] [PubMed] [Google Scholar]
- Zhu X, Ge Y, Li T, Thongphiew D, Yin FF, Wu QJ. A planning quality evaluation tool for prostate adaptive IMRT based on machine learning. Med Phys. 2011;38:719–26. doi: 10.1118/1.3539749. [DOI] [PubMed] [Google Scholar]


