

Abstract
Measurement of blood viscoelasticity during clotting provides a direct metric of haemostatic conditions. Therefore, technologies that quantify blood viscoelasticity at the point-of-care are invaluable for diagnosing coagulopathies. We present a new approach, Optical Thromboelastography (OTEG) that measures the viscoelastic properties of coagulating blood by evaluating temporal laser speckle fluctuations, reflected from a few blood drops. During coagulation, platelet-fibrin clot formation restricts the mean square displacements (MSD) of scatterers and decelerates speckle fluctuations. Cross-correlation analysis of speckle frames provides the speckle intensity temporal autocorrelation, g2(t), from which MSD is deduced and the viscoelastic modulus of blood is estimated. Our results demonstrate a close correspondence between blood viscoelasticity evaluated by OTEG and mechanical rheometry. Spatio-temporal speckle analyses yield 2-dimensional maps of clot viscoelasticity, enabling the identification of micro-clot formation at distinct rates in normal and coagulopathic specimens. These findings confirm the unique capability of OTEG for the rapid evaluation of patients’ coagulation status and highlight the potential for point-of-care use.
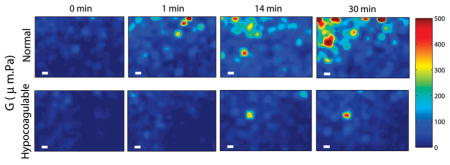
Spatial maps of blood viscoelasticity index, G, during clotting obtained from a normal patient (top row) and a hypo-coagulable patient with low levels of clotting factors (bottom row) at 0, 1, 14, and 30 minutes after kaolin activation. Micro-clots of significant G values appear at early times (~1 min) and continue to progress to form a large blood clot over 30 min in the normal patient. In contrast, in the hypo-coagulable sample, micro-clots of comparable G are only visible at 14 min and the extent and overall clot strength is considerably reduced compared to the normal patient even at 30 min. Scale bars are 100 μm long. These results demonstrate the high sensitivity and spatial resolution of OTEG for detecting incipient micro-clots during very early stages of clot formation in patients.
Keywords: Blood, coagulation, laser speckle, optical thromboelastography, rheology, thromboelastography, viscoelasticity
1. Introduction
Abnormalities in the blood coagulation process, termed coagulopathies, can result from several conditions following acute trauma, surgery, or illness and are often the underlying cause of life-threatening bleeding or thromboembolic conditions. For instance, deficient coagulation or ‘hypo-coagulable’ states can result in dangerous blood loss and organ failure [1]. In other cases, increased clotting tendency or ‘hyper-coagulable’ states can cause potentially fatal arterial or venous thromboemboli resulting in deep vein thrombosis, pulmonary embolism, myocardial infarction or stroke [2, 3]. Monitoring blood coagulation status rapidly at the bedside therefore is of crucial importance for preventing severe bleeding or detecting and treating thrombotic conditions. Unfortunately, due to their long reporting times (1–5 hours), conventional coagulation tests (CCT’s) have limited clinical utility particularly in the context of dynamically changing coagulation conditions in severely injured, surgical, or critically ill patients [4]. This dire situation calls for the development of new technologies for detecting blood coagulation abnormalities at the patient’s bedside to facilitate the early identification and management of coagulation impairments.
A direct indicator of blood coagulation status can be obtained by measuring the temporal evolution of whole blood viscoelasticity, closely associated with the time course of several biochemical processes of the coagulation cascade [5]. For instance, rheology-based coagulation technologies, such as Thromboelastography (TEG®) and Rotational Thromboelastometry (ROTEM®), report on blood coagulation status by quantifying the viscoelasticity of clotting blood in real-time by mechanically stirring a whole blood sample with a rod in a cup [4, 5]. While favourable over CCT’s in terms of reporting time and real-time operation, both TEG® and ROTEM® are contact-based methods that are likely to strain the blood sample beyond the linear viscoelastic regime, delay clot formation, and modify fibrin network structure, thereby providing unreliable results [5]. Moreover, these instruments have bulky moving parts, are complex to operate, and require routine calibration, which hinders their widespread clinical acceptance for point-of-care use at the patients’ bedside [6].
In this paper, we introduce Optical Thromboelastography (OTEG), a novel optical approach that will likely overcome the limitations of TEG® and ROTEM® to evaluate blood viscoelasticity in a rapid, non-contact manner using just a few drops of whole blood. In OTEG, the specimen consisting of a few drops of blood is illuminated by a laser source, and temporally fluctuating speckle patterns are captured by a high-speed CMOS sensor. We have previously demonstrated that temporal intensity fluctuations of laser speckle patterns provide information on the viscoelastic properties of tissues and test phantoms [7–12]. In un-clotted blood, the continuous re-arrangements of intrinsic light scattering particles undergoing Brownian motion induce rapid temporal speckle intensity fluctuations. During coagulation, blood viscoelasticity is progressively modified in concert with key aspects of haemostatic clot formation, including platelet aggregation, fibrin polymerization, and fibrin cross-linking [13]. The gradual emergence of a fibrin-platelet clot with increased stiffness restricts the Brownian motion of scattering particles, subsequently culminating in reduced optical phase shifts and slower speckle fluctuations. In this paper, we demonstrate that OTEG measurements leverage from the susceptibility of laser speckle intensities to optical phases shifts caused by sub-wavelength scale particle displacements that in turn closely follow the alterations in the viscoelastic properties of coagulating blood. Thus, the viscoelastic properties of blood during coagulation can be measured accurately using OTEG without requiring any sample manipulation unlike TEG® or ROTEM®. Here, we elaborate on OTEG methods to measure blood viscoelasticity and discuss results obtained using whole blood samples from animals and patients with normal and defective coagulation states.
2. Materials and methods
2.1 Porcine blood specimens
We first tested the accuracy of the OTEG approach to measure blood viscoelasticity using serial dilutions of porcine whole blood specimens and by comparing OTEG results with standard-reference mechanical rheometry. Fresh blood samples from swine were collected in citrated blue top tubes (2.7 mL Vacutainer® plastic tube, additive: buffered sodium citrate .109 M, BD Biosciences, NJ), and diluted with 10% and 30% Dextran 40 solution (v/v). The blood samples were warmed up to 37 °C in a water bath for 5 minutes and 1 mL of each specimen was transferred to a spectroscopic cuvette for OTEG measurements. An additional 1.7 mL of blood from the same tube was used to perform the cross reference conventional rheometry experiments.
2.2 Human blood specimens
After testing in porcine blood, the accuracy and measurement sensitivity of OTEG in detecting blood viscoelasticity changes during coagulation was tested in whole blood samples obtained from patients. Following institutional review board (IRB) approval, a total of 5 de-identified patient blood specimens were collected from the MGH special coagulation laboratory in 2.7 ml citrated blue top tubes (as above). Based on laboratory diagnoses, one sample had abnormally long prothrombin time (PT) of 34 seconds (normal range: 11–13.5 seconds) and activated partial thromboplastin time (aPTT) of 40.8 seconds (normal range 25–35 seconds), and was diagnosed as ‘hypo-coagulable’. The four remaining samples were found to have normal coagulation status (normal PT and aPTT). The human blood tubes were warmed up in a water bath to 37 °C for 5 minutes. Just prior to OTEG analysis, anticoagulation was reversed by adding 20 μL of calcium chloride solution (0.2 M) to the vial and a kaolin buffer solution (Kaolin 6300, Haemoscope Corp, MA) was used to initiate the coagulation [14]. Then, 100 μL of kaolin-activated blood was transferred to an imaging chamber (Grace Bio-Labs, Inc., OR) with a cylindrical enclosure to house the blood (radius: 4 mm, L: 2 mm) and a clear optical window for OTEG measurements. Similar to porcine blood studies, 1.7 mL of the blood from the same patient was used to conduct mechanical rheometry in parallel to OTEG as described below.
2.3 OTEG optical setup and image acquisition
A schematic diagram of the optical setup used to conduct OTEG is depicted in Figure 1 [7–12]. Briefly, light from a diode laser source (690 nm) was focused (50 μm spot) delivering a total power of 9 mW to the sample. A custom-built heat plate maintained the temperature of the samples at 37 °C during measurements. Cross-polarized laser speckle patterns were collected at the 180° back-scattering geometry, with a CMOS camera (Basler, Ace 2000–340 km), equipped with a Macro-lens (Computar, MLH-10x). For the low viscosity serially diluted porcine blood specimens, acquisition was performed at 800 frames per second (fps) over a region of interest (RoI) of 40 × 40 pixels for 2 seconds, resulting in a total of 1600 time-varying speckle frames. A frame grabber (NI-PCIe-1433) and a Camera Link interface were used to acquire and transfer the frames to a desktop computer.
Figure 1.

Schematic diagram of OTEG optical setup. Light from a diode laser (DL) was passed through a beam expander (BE), and beam splitter (BS) and focused by a lens (L) on the surface of an imaging chamber (IC), placed on a custom-manufactured heat plate (HP). The scattered light was collected by a high-speed CMOS camera (CM), equipped with a polarizer (P) and a macro-lens (ML). Speckle frames were transferred to a desktop computer via a camera-link interface for processing.
In the patient blood samples, OTEG measurements were conducted during coagulation by capturing speckle frames series in a time-lapsed manner over 30 minutes. At every 30 seconds one speckle frame sequence was captured for 500 ms, at 480 fps (RoI: 400 × 400 pixels). Thus, over 30 minutes of speckle acquisition, a total of N = 61 movies were collected. For each patient, measurements were repeated at least three times to evaluate the intra-sample variability.
To demonstrate the capability of OTEG for probing the localized micro-scale mechanical properties of blood specimens, the sample was evenly illuminated and spatio-temporal speckle fluctuations were measured over the RoI. Towards this end, in two blood samples (one normal and one hypo-coagulable), the optical setup was reconfigured and polarized light from the diode laser was collimated and expanded to illuminate a 8 mm area on imaging chamber.
2.4 Calculating the speckle intensity autocorrelation, g2(t)
Each speckle frame sequence was processed by performing cross-correlation analysis of the first speckle frame with subsequent frames in the series to measure the speckle intensity autocorrelation curve, g2(t) [7–12] as:
| (1) |
Here I(t0) and I(t + t0) stand for speckle frames at time points t0 and t + t0, 〈 〉pixels and 〈 〉t0 indicate spatial and temporal averaging over the entire frame and for the total duration of the movies (2 s for porcine blood and 0.5 s for human blood), respectively [11, 12]. In Eq. (1), normalizing the correlation between speckle frames at times t0 and t + t0 (in the numerator) with the term, (〈I(t0)2〉 〈I(t + t0)2〉)1/2 in the denominator helped minimizing the effects of occasional source power drifts or statistical variations of absolute intensity (twinkling) due to rearrangements of scattering particles. This choice of normalization caused g2(t) to start from 1 at t = 0 and reduce to a minimum of 0.5 for purely viscous ergodic specimens at long times.
For the patient blood samples, a total of 61 g2(t) curves were processed during the time-course of coagulation (30 minutes). To obtain 2-dimensional colormaps of blood viscoelastic properties during clotting using the expanded beam illumination, spatial averaging in Eq. (1) was reduced to a 5 × 5 Gaussian window of neighbouring pixels to cover an RoI of 80 × 120 corresponding to 1 × 1.5 mm2 area.
2.5 Estimating the mean square displacement (MSD) of scattering particles
To deduce the mean square displacement (MSD) of scattering particles from g2(t), the conventional diffusing wave spectroscopy (DWS) formalism, based on the diffusion approximation, was exploited. This resulted in the following expression for g2(t) in terms of MSD [15–17]:
| (2) |
where 〈Δr2(t)〉 represents the MSD, k0 is the wave number, n = 1.36 is the refractive index of blood, γ represents the ratio of long diffuse optical paths to short non-diffusive rays and is often considered to be 5/3, and μa and μs′ are the optical absorption and reduced scattering coefficients of blood [17]. From Eq. (2) it is clear that the knowledge of μa and μs′ is necessary to accurately evaluate the MSD of scattering particles [11, 12].
We used previously established methods to estimate the optical properties of the blood specimens by measuring the radial dependence of diffusely remitted intensity from time-averaged speckle patterns [8, 12, 18]. Speckle movies, obtained using the focused illumination, were temporally averaged and the result was converted to photon flux (i.e. photons per unit area) based on the camera responsivity, angle of view, and the area of illumination. Next, the remitted diffuse reflectance was evaluated as a function of distance from the illumination centre. The radial diffuse reflectance profile (DRP) was then fitted to a model derived from steady-state diffusion theory to calculate both μa and μs′ [8, 12, 18]. The estimated optical properties of the un-clotted whole blood using this method (μs′ = 1.1 mm−1, μa = 0.15 mm−1 @ 690 nm) were consistent with published literature [19, 20]. For diluted porcine blood specimens, both μa and μs′ reduced proportionally, maintaining a fixed μa/μs′ applicable to Eq. (2).
In human blood, the biochemical processes of the coagulation cascade, altered both optical and mechanical properties simultaneously. In particular, μs′ of human blood exhibited variations while clotting during the formation of a platelet-fibrin clot. Prior to the initiation of coagulation, μs′ was around 0.9 ± 0.12 mm−1. It then reduced to 0.76 ± 0.12 mm−1 during early phase of coagulation (minutes 0–4) and was raised monotonically to 1.03 ± 0.1 mm−1 until minute 11, but changed minimally afterwards following clot stabilization. On the other hand, as expected, the measured average μa (0.124 ± 0.024 mm−1 @ 690 nm) exhibited negligible variations during coagulation because haemoglobin concentration was unchanged. The value of μa corresponded well with haemoglobin spectra (μa = 0.15 mm−1) [19].
For both swine and human blood specimens, the experimentally evaluated optical properties fulfilled the following conditions: μa ≪ μs′, and μs′ was sufficiently large. In addition, the high scattering anisotropy of blood (g > 0.95), and the thicknesses of both spectroscopic cuvette and imaging chamber, L > 2 × 1/μs′, satisfied the geometrical constraints of diffusion approximation and DWS expression [21]. Taken together, given the optical properties of blood at 690 nm, the assumption of diffusive light transport was reasonably accurate for the sample dimensions as discussed below [12, 22]. Thus, μa and μs′, derived from focused beam illuminated speckle movies, were replaced in Eq. (2) to offset the influence of optical properties and extract MSD values from g2(t) curves.
2.6 Extracting the viscoelastic modulus
The MSD estimated above quantifies the Brownian displacements of scattering particles in response to random thermal forces and is thus directly linked to the viscoelastic modulus of blood denoted by the G*(ω). In particular, MSD values at short, intemediate, and log time scales correpond to high, intermediate, and low frequency response of the viscoelastic material, respectively. It has been previously established that the viscoelastic modulus and the MSD of particles undergoing Brownin motion in a viscous medium are related through the Generalized Stokes-Einstein Relation (GSER) as follows [16, 23–28]:
| (3) |
where KB is the Boltzman constant (1.3810−23), T = 312 °K (37 °C) is the absolute temperature (degrees Kelvin), a is the radius of scattering particles, ω = 1/t represents the angular frequency (rad/sec), Γ denotes the gamma function, and α(t) = δ log〈Δr2(t)〉/δ log t corresponds to the MSD slope in a log-log plot [25]. For un-clotted whole or diluted swine blood specimens, the RBCs are the main contributors of the scattered optical signal, and their sphere-equivalent hydrodynamic radius a = 2.78 μm was substituted in Eq. (3) to obtain the G*(ω) [29, 30].
During coagulation, however, due to the process of platelet aggregation, emergence of fibrin monomers and fibrin polymerization, the effective radius of the scattering particles is altered consistently. As a result, an accurate particle size estimate during coagulation is difficult to obtain. Instead, we measured the quantity G at a frequency, ω = 1 Hz, to indicate clot viscoelasticity, where G = a×|G*(ω)|, represented the product of viscoelastic modulus and the particle radius, a. The ω stood for the frequency at which viscoelastic response of the blood was evaluated. Since results of OTEG and conventional rheology exhibited good correlation at the intermediate frequency range of 1–10 Hz, here a frequency of ω = 1 Hz was selected to evaluate G.
2.7 Reference standard conventional rheometry
To test the accuracy of OTEG in measuring blood viscoelasticity, independent measurements of |G*(ω)| were performed using a standard-reference rheometer (AR-G2, TA Instruments, MA). A sample of blood (1.7 mL) was placed on the stationary bottom plate. Coagulation was activated directly on the bottom plate by adding the kaolin buffer solution to the blood. Immediately after adding the kaolin solution, the 40 mm dia. rotating top plate was lowered to come in contact with blood and shear the sample for rheometry evaluation. A strain of 0.1% was applied and |G*(ω)| was measured by performing a frequency sweep between 0.1–100 Hz [11]. For coagulating human blood specimens, successive rapid frequency sweep procedures were conducted over a limited frequency range (0.2–3 Hz) for 35 minutes. During each frequency sweep procedure, the blood specimen was sheared by an oscillatory stress at multiple frequencies, and the resulting strain was measured. The output data were rearranged to display the temporal trace lines of |G*| evaluated at frequencies of 0.2–3 Hz over 35 minutes of testing.
3. Results
3.1 Viscoelastic properties of serially diluted porcine blood
Figure 2 shows the speckle intensity autocorrelation curves, g2(t), of whole and diluted porcine blood specimens. All g2(t) curves decayed to a plateau level in less than 50 ms, warranting rapid acquisition of speckle movies at 800 fps (~1.25 ms exposure time) for sufficient sampling of Brownian motion dynamics. Due to its higher viscoelastic modulus (0.6 Pa @ 1 Hz), the whole blood sample exhibited rapid speckle intensity fluctuations eliciting a slower decay of the measured g2(t) with an elevated plateau compared to the diluted samples. From the measured g2(t), the MSD was estimated using Eq. (2) by substituting the values of μa, and μs′ obtained from the time averaged speckle patterns. The graph in the inset of Figure 2 displays the MSD curves exhibiting a diffusive particle motion at short time and length scales, followed by a slightly restricted displacement at longer times. This was different from linearly growing MSD of particles observed in a simply viscous liquid [24]. The lower slope of MSD at long times was partially caused by reduced speckle contrast. The non-negligible elastic modulus of the blood at low frequencies also likely restricted Brownian displacements at long times and caused this behaviour. As expected, due to lower viscoelastic modulus (0.33 Pa @ 1 Hz) of 30% diluted blood, MSD values in this specimen were larger compared to 10% diluted (0.39 Pa @ 1 Hz) and whole blood (0.6 @ 1 Hz), because intrinsic particles experienced larger and more rapid range of motion.
Figure 2.

Speckle intensity autocorrelation curves, g2(t), of whole porcine blood with no dilution (solid line), as well as 10% and 30% dilution with Dextran 40 (dashed and dotted lines, respectively). Inset: MSD of scattering particles.
Figure 3 displays the OTEG measurements of |G*(ω)| versus frequency, ω, for the porcine blood samples, calculated using the GSER in Eq. (3). Also displayed in this figure are the G*(ω) values measured using the ARG2 rheometer that provide a standard-reference comparison.
Figure 3.

Complex viscoelastic modulus, |G*(ω)|, of whole porcine blood, with no dilution, as well as 10%, and 30% serial dilution with Dextran 40 solution (circles, triangles and diamonds) obtained using the GSER (Eq. (3)), and mechanical rheology (solid, dashed, and dotted lines), respectively. Good agreement is observed between the results of OTEG and mechanical rheometry, especially at frequencies of 1 Hz < ω < 10 Hz.
At higher frequencies the rheometer readouts were over-estimated due to disproportionate stress needed to counteract the plate inertia, causing unreliable rheometric results at frequencies beyond 10 Hz [11, 12]. On the other hand, OTEG measurements at low frequencies (ω < 1 Hz) were susceptible to a bias induced by compromised speckle contrast, as seen in Figure 3 and further discussed below [12]. Good agreement was observed between OTEG and rheometry at overlapping frequencies (1 Hz < ω < 10 Hz), demonstrating the accuracy of OTEG for measuring distinct viscoelastic properties of serially diluted blood samples similar to rheometry.
3.2 Viscoelastic properties of human blood during coagulation
Figure 4 displays values of the viscoelastic moduli of human blood measured by OTEG and standard rheometry following kaolin activation over 20 minutes. Each data point shows the average modulus measured in 3 patients with normal coagulation status, and the error bars depict standard deviation. For both OTEG and rheometry, modulus is displayed at a frequency, ω = 1 Hz.
Figure 4.

Primary y-axis: Average viscoelastic modulus multiplied by the radius of scattering particles, G = |aG*| of three normal human blood specimens, evaluated at the frequency of 1 Hz, by OTEG. The variability among samples is illustrated by standard error bars. Secondary y-axis: Viscoelastic modulus, |G*|, evaluated at the frequency of 1 Hz, using conventional ARG2 rheometer.
Excellent correspondence between the trends of the OTEG and rheometry measurements during coagulation was observed. During the first 4 minutes following kaolin activation, both OTEG and rheometry traces of blood viscoelastic moduli showed minimal change. This was followed by a steep rise in stiffness, within the time frame of minutes 4 to 11 as a consequence of fibrin-platelet clot formation. During this interval, G* values measured by rheometer grew by ~3 orders of magnitude from 0.29 to 219 Pa. Likewise, the OTEG trace line exhibited a considerable growth of ~85%. This rapid solidification of the blood clot was followed by a clot stabilization process, within the time interval of minutes 11 to 20. The slight change in clot viscoelastic modulus during this period indicated the completion of fibrin network formation in the blood clot.
The close correspondence between OTEG and rheometry curves throughout the coagulation process corroborated the high accuracy and measurement sensitivity of OTEG in evaluating the visco-elastic properties of clotting blood in a time-dependent manner. We note, however, that while rheometer measurements increased by more than 3 orders of magnitude, OTEG values raised by only 90%, likely because of the limited sensor bit depth of the CMOS camera which constricted the dynamic range of OTEG measurements as discussed below.
3.3 Mapping of local micro-scale viscoelastic properties
As detailed above, the expanded beam illumination in conjunction with spatio-temporal analysis of speckle intensity flutuations allowed us to probe spatial variations in the viscoelastic properties of human blood during coagulation. Figure 5 displays the color-maps of G for normal and hypo-coagulable human blood specimens at minutes 0, 1, 14, and 30 after introducing kaolin to activate blood coagulation. Incipient micro-clots were detected at very early time point (minute 1) in the normal blood.
Figure 5.
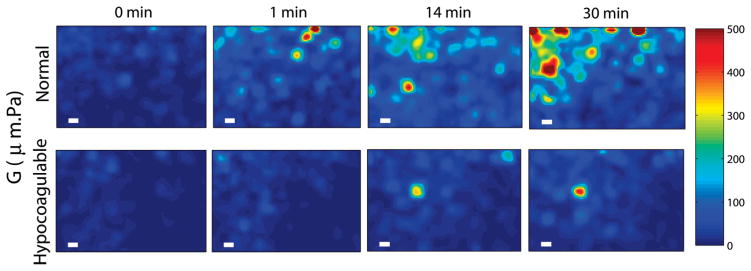
Spatial maps of blood viscoelasticity index, G, during clotting obtained from a normal patient (top row) and a hypo-coagulable patient with low levels of clotting factors (bottom row) at 0, 1, 14, and 30 minutes after kaolin activation. Micro-clots of significant G values appear at early times (~1 min) and continue to progress to form a large blood clot over 30 min in the normal patient. In contrast, in the hypo-coagulable sample, micro-clots of comparable G are only visible at 14 min and the extent and overall clot strength is considerably reduced compared to the normal patient even at 30 min. Scale bars are 100 μm long. These results demonstrate the high sensitivity and spatial resolution of OTEG for detecting incipient micro-clots during very early stages of clot formation in patients.
However, in hypo-coagulable specimen, coagulation process was significantly delayed due to abnormally low levels of clotting factors which compromised the coagulation process. In this case, micro-clots were absent until minute 14 and did not fully develop even at minute 30. Formation of these early micro-clots is imperceptible to mechanical testing devices, which provide measurements averaged over the bulk volume of the sample. Furthermore, mechanical manipulation or shearing of the sample is suspected to destroy initial fibrin mesh formation and lengthen the coagulation time [5]. In contrast, results of Figure 5 demonstrate the high detection sensitivity of OTEG to early clot formation and its capability to provide a portrait of the entire coagulation profile very rapidly within a minute.
4. Discussion
The new OTEG technology, presented here, demonstrates the capability to evaluate the haemostatic status of blood, by measuring blood viscoelastic properties during coagulation. OTEG measurements of viscoelastic modulus, |G*(ω)|, exhibit good correspondence with conventional mechanical rheometry (Figures 3, 4). In addition, the demonstrated capability of OTEG to inspect incipient micro-clots that develop during early stages of the coagulation process indicates the advantage of OTEG in measuring coagulation status within a fraction of the time taken by TEG and ROTEM.
In un-clotted blood, the rapid rearrangements of scattering particles, i.e. RBCs and platelets, elicit fully fluctuating speckle patterns with equivalent temporal and ensemble averaged statistics pertinent to ergodic media [31, 32]. This is verified by calculating time-averaged g2(t) curves from individual speckle spots (over a few minutes) that show trends equivalent to the g2(t) curve obtained by spatial and temporal averaging (over <1 s) of multiple speckle spots over the entire speckle frame (Eq. (1)). When coagulation is initiated, however, fibrinogen is transformed to fibrin and RBCs and platelets, entrapped in the fibrin mesh, undergo restricted Brownian excursions. In this case, speckle patterns may exhibit both partially fluctuating and fluctuating components and the resultant time-averaged and spatio-temporally averaged g2(t) curves are no longer equivalent [31, 32]. Despite this partially non-ergodic nature of the blood clot, the acquisition of a multitude of speckle spots using a CMOS camera (Figure 1) together with both spatial (ensemble) and temporal averaging used in processing the speckle frame series (eqn. (1)) ensures that the calculated g2(t) curve represents the bulk Brownian motion dynamics of the ensemble of light scattering particles in the illuminated sample [11, 12, 17, 31, 33, 34]. Transition to non-ergodic behaviour, reflected in the partially-fluctuating component of speckle pattern, gives rise to the higher plateau level of the ensemble averaged g2(t) at longer times (Figure 2), which is directly influenced by the growing elastic modulus of the coagulating blood (Figure 4). Thus, the transition from ergodic (un-clotted blood) towards non-ergodic (blood clot) statistics in coagulating blood is exploited in the OTEG system to achieve high detection sensitivity to clotting. The multi-speckle acquisition, permitted by CMOS based speckle acquisition in OTEG, also reduces the time required to calculate the g2(t) to within seconds versus several minutes as required in single speckle acquisition schemes [11, 12, 17, 31, 33].
To capture the full extent of speckle fluctuations, the acquisition frame rate should be adjusted carefully. Low acquisition speed may cause multiple speckle patterns to be integrated in time during the long exposure of the camera sensor resulting in speckle blurring with reduced contrast. In this study, rapid speckle fluctuations induced by fast RBCs displacements in the whole and dextran-diluted swine blood, were captured at the high frame rate of 800 fps. Nonetheless, residual speckle blurring potentially raised the g2(t) plateau especially for low viscosity un-clotted blood specimens and reduced the full-range of measurement of RBC displacements at long times (Figure 2) [11, 12]. As a result, the viscoelastic modulus evaluated by OTEG was higher than the values reported by the mechanical rheometry, particularly at lower frequencies, as shown in Figure 3. Increasing the frame rate, above 800 fps, could reduce effects of speckle blurring albeit at the expense of reduced speckle signal to (electronic) noise ratio (SNR). A significantly reduced SNR could potentially induce errors particularly in the first few points of g2(t) at shortest times [35] and in turn influence the high frequency moduli values measured by OTEG. Thus the relationship between frame rate and SNR influenced the accuracy of the low and high frequency viscoelastic modulus assessment using OTEG.
Speckle intensity fluctuations, acquired by the high-speed camera, are exquisitely sensitive to Brownian displacements, in the order of a few angstrom [17], and thus are intimately related to the viscoelastic modulus of the medium. However, speckle fluctuations are modulated not only by displacements of the scattering particles, but also by changes in optical properties of blood, i.e. μa and μs′, which determine the transport of light within the blood and the average number of photon-particle interactions within the illuminated volume. As described above, during coagulation, μa remained constant (due to the constant haemoglobin concentration) while μs′ evolved continuously as coagulation progressed due to platelet aggregation and fibrin polymerization [19, 36]. By cutting down the number of isolated scattering centres during initial stages, platelet aggregation likely reduced the scattering coefficient, μs. Aggregation also produced larger scattering particles with higher scattering anisotropy, g. This led to a net reduction of μs′ = μs (1−g). During the next stages of the coagulation cascade, emergence of fibrin monomers, fibrin polymerization and lateral associations, introduced additional scattering particles and increases μs′ from 0.76 ± 0.12 to 1.03 ± 0.1 mm−1 (minutes 4–11). This observation was consistent with the trends in light scattering studies of fibrin [37].
To evaluate μa and μs′ in the current effort, speckle frame series were averaged temporally to drive the DRP, which was then fitted to a parametric model, derived from steady state diffusion theory, to calculated both μa and μs′, independently [8, 12, 18]. This process significantly increased the OTEG computational load. Nevertheless, our analysis shows that independent measurements of μa and μs′ are not necessary and processing algorithm may be greatly simplified in the future by simply comparing the intensities reflected from the specimen with a standard reflector, measured in a one-time calibration, to derive the μa/μs′ ratio for deducing the MSD from g2(t) in Eq. (2) [38].
The choice of DWS formalism (Eq. (2)), for calculating the MSD is merited given the low absorption coefficient of the blood at 690 nm and the optical thickness of the blood samples. At 690 nm the absorption length of blood, la = 1/μa is much larger than its diffuse mean free path, l* = 1/μs′. In addition, both spectroscopic cuvette (L > 4l*) and imaging chamber, (L > 2l*), are thick enough to satisfy the geometrical constraints of DWS, for highly anisotropic scattering biological samples such as blood (g > 0.95). Since in blood at least 20 scattering events occur per l* length, and la ≫ l*, light rays scatter multiple times within the sample before being either absorbed or detected by the CMOS camera. Therefore, the assumption of diffuse light propagation in blood samples is reasonable and Eq. (2) conveniently expresses g2(t) in terms of MSD and optical properties [12, 21]. We have recently corroborated the validity of Eq. (2) for small sample dimensions in materials with a range of absorption and scattering properties, similar to blood and other biological tissue, and confirmed that when scattering dominates absorption, and absorption is non-negligible, DWS formalism performs similar to a parametric expression derived numerically from computationally-intensive Monte-Carlo Ray Tracing simulations [22].
In this study, since the effective scattering size in coagulating human blood was not fully known, OTEG evaluated a substitute quantity defined as G = aG*. As a result, OTEG measurements did not linearly scale with values reported by the mechanical rheometer, i.e. G*, and increased by 90% instead of more than three orders of magnitude observed in rheometer testing.
This small growth is partially explained by the wide distribution of scattering particle sizes, i.e. poly-dispersity, of the coagulating blood. The Brownian displacements of these assorted particles depend not only on the viscoelastic properties of the coagulating blood, but also on the hydrodynamic radii of the particles, with smaller particles exhibiting faster displacements. During the initial phase of coagulation in un-clotted blood, when G* is small, RBCs are the major contributors to the scattered speckle and therefore the evaluated MSD primarily defines RBC motion. As coagulation proceeds, fibrin monomers emerge and add to the scattering signal. Consecutive branching and lateral associations of these fibres reduce the haemostatic clot mesh size, and entrap particles of comparable dimensions, such as RBCs and platelet aggregates [39]. These large scattering particles then contribute mainly to the non-fluctuating component of the speckle pattern, which adjusts the g2(t) plateau level, and represents the elastic behaviour of the clot. The elasticity of the clot, implicated in the plateau level, provides key diagnostic information as it closely correlates with fibrinogen concentration of blood in patients [40]. Thus, due to confinement of larger particles at later stages of coagulation, diffusely moving smaller particles are expected to contribute more to the estimated MSD [17]. Since an independent estimate of particle size α is intractable in the current optical setup, G = aG*(ω) does not increase to the same extent as |G*(ω)| measured by the rheometer. Nonetheless, the influence of blood poly-dispersity is more prominent at higher frequencies and the results of Figure 4 which were evaluated at 1 Hz, still demonstrate the temporal trends and relative difference in viscoelastic properties with excellent sensitivity during coagulation. In the future, OTEG accuracy may be improved by incorporating auxiliary components, to independently assess the scattering particle size, a, during clot formation, for instance by processing the angular dependence of diffused intensity at different polarization states, or angle-resolved analysis of the coherently scattered radiation [36, 41].
As opposed to OTEG, which is capable of evaluating blood viscoelasticity in a non-contact manner, the rheometer may strain the specimen beyond the linear viscoelastic regime, deform the fibrin network, manipulate the clot stiffness, and alter the clot biomechanical properties, thus underestimate clot modulus at early stages of coagulation [39]. These effects may overestimate the extent of change in clot modulus measured by the rheometer. Moreover, |G*(ω)| values measured by the rheometer at high oscillation frequencies beyond 10 Hz are not reliable due to effects of tool inertia at these frequencies [11, 12]. Consequently, the reported |G*(ω)|, i.e. the ratio of the applied stress to the resulting strain, is overestimated at high frequencies, as seen in Figure 3. Increasing the blood sample size enables averaging over a larger sample volume and therefore improves the accuracy of rheometer measurements. The contact-based nature of these mechanical instruments enables them to only evaluate the viscoelastic modulus of bulk samples. Therefore these technologies are naturally less sensitive to small and localized changes of blood viscoelasticity and detect the clot formation only after viscoelastic properties significantly change over the entire blood volume.
In contrast, OTEG permits mapping of spatial variations in viscoelastic properties using a few drops of blood (Figure 5) and evaluates the rate and the relative strength of micro-clots in normal and coagulopathic blood specimens. This highlights the invaluable potential of OTEG to investigate the blood coagulation process with high sensitivity at very early stages of coagulation. The isolated micro-clots, spotted in Figure 5 at the early phases of coagulation in normal blood, grow and propagate to form a large blood clot at later times. This observation is consistent with the well-recognized mechanism of the coagulation cascade [42, 43] in which fibrinogen is converted to fibrin strands and early micro-clots are formed in a localized environment at the vicinity of activated platelets. This is followed by the linear polymerization of fibrin, and fibrin crosslinking to form a stabilized platelet-fibrin plug that consistently grows to alter the local viscoelastic properties of the clot during coagulation [42, 43]. The capability of OTEG-based assays for non-contact detection of micro-clots may be valuable in the future for managing critical conditions, such as thrombotic microangiopathies (TMA), and disseminated intravascular coagulation (DIC), in which the pathogenesis of micro-clots critically determines the degree of multiple organ failure [44–46].
In the past, other light scattering studies have demonstrated the potential for measuring RBC aggregate size, ex vivo, and index of viscosity of blood pooled in extremities, in vivo [47–49]. These investigations have reported a potential link between the measured optical indices and age-related haemostatic disorders and vascular function and likely provided alternative approaches to evaluate coagulation conditions in patients [48, 49]. However, since the coagulation cascade could not be initiated in these prior works, such approaches were not able to evaluate the viscoelastic development of coagulating blood in real-time and the underlying coagulation status.
In our current work, we have demonstrated the capability of OTEG as a non-contact optical device for monitoring the viscoelastic transformation of the coagulating blood to provide a direct measure of coagulation status, using just a drop or two of blood. Results of our recent studies have demonstrated a close correlation between coagulation metrics measured using laser speckle approaches and clinically-relevant CCT results such as aPTT, PT, and fibrinogen level [40]. In the future, we envision that OTEG may be performed using a test strip with a single drop of blood obtained using a finger-stick method.
Unlike existing devices, such as TEG® and RO-TEM® that have bulky hardware with moving mechanical parts, OTEG, also benefits from an elegant and simple setup that can be operated at the touch of a button. This setup may be easily miniaturized and embodied as a palm-sized coagulation testing device operated at the bedside. This may shift the current paradigm of care for surgical, trauma, and critically ill patients in need for prompt detection and management of bleeding and thrombotic conditions.
Acknowledgments
This work is supported by research funding obtained from the NIH U54 EB015408 02 grant (S.N), Air Force office of scientific research FA9550–11–1–0331 (S.N), and Partners healthcare systems Inc. (S.N). We thank Dr. Elizabeth M. van Cott and Blake S. Maddux at the MGH special coagulation laboratory for their help in providing the discarded blood specimens. We wish to acknowledge Haemonetics Corporation for genereously providing reagents and supplies.
Footnotes
Author biographies Please see Supporting Information online.
References
- 1.Shaz BH, Winkler AM, James AB, Hillyer CD, MacLeod JB. J Trauma. 2011;70:1401–1407. doi: 10.1097/TA.0b013e31821266e0. [DOI] [PMC free article] [PubMed] [Google Scholar]
- 2.Bern M, McCarthy N. Blood Coagul Fibrinolysis. 2012;24:59–63. doi: 10.1097/MBC.0b013e32835a72aa. [DOI] [PubMed] [Google Scholar]
- 3.Edelman JJ, Reddel CJ, Kritharides L, Bannon PG, Fraser JF, Curnow JL, Vallely MP. J Thorac Cardiovasc Surg. doi: 10.1016/j.jtcvs.2013.10.028. in press. [DOI] [PubMed] [Google Scholar]
- 4.Whiting D, Dinardo JA. Am J Hematol. 2014;89:228–232. doi: 10.1002/ajh.23599. [DOI] [PubMed] [Google Scholar]
- 5.Evans PA, Hawkins K, Lawrence M, Williams RL, Barrow MS, Thirumalai N, Williams PR. Med Eng Phys. 2008;30:671–679. doi: 10.1016/j.medengphy.2007.08.005. [DOI] [PubMed] [Google Scholar]
- 6.Ganter MT, Hofer CK. Anesth Analg. 2008;106:1366–1375. doi: 10.1213/ane.0b013e318168b367. [DOI] [PubMed] [Google Scholar]
- 7.Nadkarni SK, Bouma BE, Helg T, Chan R, Halpern E, Chau A, Minsky MS, Motz JT, Houser SL, Tearney GJ. Circulation. 2005;112:885–892. doi: 10.1161/CIRCULATIONAHA.104.520098. [DOI] [PMC free article] [PubMed] [Google Scholar]
- 8.Nadkarni SK, Bilenca A, Bouma BE, Tearney GJ. J Biomed Opt. 2006;11:21006. doi: 10.1117/1.2186046. [DOI] [PMC free article] [PubMed] [Google Scholar]
- 9.Nadkarni SK, Bouma BE, Yelin D, Tearney GJ. J Biomed Opt. 2008;13:054016. doi: 10.1117/1.2982529. [DOI] [PMC free article] [PubMed] [Google Scholar]
- 10.Hajjarian Z, Xi J, Jaffer FA, Tearney GJ, Nadkarni SK. J Biomed Opt. 2011;16:026005. doi: 10.1117/1.3533322. [DOI] [PMC free article] [PubMed] [Google Scholar]
- 11.Hajjarian Z, Nadkarni SK. Sci Rep. 2012;2:316. doi: 10.1038/srep00316. [DOI] [PMC free article] [PubMed] [Google Scholar]
- 12.Hajjarian Z, Nadkarni SK. PLoS ONE. 2013;8:e65014. doi: 10.1371/journal.pone.0065014. [DOI] [PMC free article] [PubMed] [Google Scholar]
- 13.Kaibara M. Biorheology. 1996;33:101–117. doi: 10.1016/0006-355X(96)00010-8. [DOI] [PubMed] [Google Scholar]
- 14.Viuff D, Andersen S, Sørensen BB, Lethagen S. Thromb Res. 2010;126:144–149. doi: 10.1016/j.thromres.2010.05.008. [DOI] [PubMed] [Google Scholar]
- 15.Cardinaux F, Cipelletti L, Scheffold F, Schurtenberger P. Europhys Lett. 2002;57:738–744. [Google Scholar]
- 16.Boas DA, Yodh AG. J Opt Soc Am A. 1997;14:192–215. doi: 10.1364/josaa.14.003358. [DOI] [PubMed] [Google Scholar]
- 17.Weitz DA, Pine DJ. In: Dynamic Light Scattering. Brown W, editor. Oxford University; New York: 1993. [Google Scholar]
- 18.Farrell TJ, Patterson MS, Wilson B. Med Phys. 1992;19:879–888. doi: 10.1118/1.596777. [DOI] [PubMed] [Google Scholar]
- 19.Prahl S Oregon Medical Laser Center. http://omlc.ogi.edu/spectra/hemoglobin/index.html.
- 20.Tuchin VV. Handbook of optical biomedical diagnostics. SPIE Press; Bellingham, WA: 2002. [Google Scholar]
- 21.Kaplan PD, Kao MH, Yodh AG, Pine DJ. Appl Opt. 1993;32:3828–3836. doi: 10.1364/AO.32.003828. [DOI] [PubMed] [Google Scholar]
- 22.Hajjarian Z, Nadkarni SK. Opt Express. 2014;22:6349–6361. doi: 10.1364/OE.22.006349. [DOI] [PMC free article] [PubMed] [Google Scholar]
- 23.Mason TG, Weitz DA. Phys Rev Lett. 1995;74:1250–1253. doi: 10.1103/PhysRevLett.74.1250. [DOI] [PubMed] [Google Scholar]
- 24.Mason TG, Gang H, Weitz DA. J Opt Soc Am A. 1997;14:139–149. [Google Scholar]
- 25.Mason TG. Rheol Acta. 2000;39:371–378. [Google Scholar]
- 26.Dasgupta BR, Tee SY, Crocker JC, Frisken BJ, Weitz DA. Phys Rev E Stat Nonlin Soft Matter Phys. 2002;65:051505. doi: 10.1103/PhysRevE.65.051505. [DOI] [PubMed] [Google Scholar]
- 27.Dasgupta BR, Weitz DA. Phys Rev E Stat Nonlin Soft Matter Phys. 2005;71:021504. doi: 10.1103/PhysRevE.71.021504. [DOI] [PubMed] [Google Scholar]
- 28.Jonas M, Huang H, Kamm RD, So PT. Bio Phys J. 2008;94:1459–1469. doi: 10.1529/biophysj.106.098111. [DOI] [PMC free article] [PubMed] [Google Scholar]
- 29.Steinke JM, Shepherd AP. Appl Opt. 1988;27:4027–4033. doi: 10.1364/AO.27.004027. [DOI] [PubMed] [Google Scholar]
- 30.Meinke M, Helfmann J, Friebel M, Müller G. J Biomed Opt. 2007;12:014024. doi: 10.1117/1.2435177. [DOI] [PubMed] [Google Scholar]
- 31.Pusey PN, Van Megen W. Physica A. 1989;157:705–741. [Google Scholar]
- 32.Boas DA. PhD Thesis. University of Pennsylvania; 1996. [Google Scholar]
- 33.Scheffold F, Skipetrov SE, Romer S, Schurtenberger P. Phys Rev E Stat Nonlin Soft Matter Phys. 2001;63:061404. doi: 10.1103/PhysRevE.63.061404. [DOI] [PubMed] [Google Scholar]
- 34.Viasnoff V, Lequeux F, Pine DJ. Rev Sci Instrum. 2002;73:2336–2344. [Google Scholar]
- 35.Skipetrov SE, Peuser J, Cerbino R, Zakharov P, Weber B, Scheffold F. Opt Express. 2010;18:14519–14534. doi: 10.1364/OE.18.014519. [DOI] [PubMed] [Google Scholar]
- 36.Hielscher AH, Mourant JR, Bigio IJ. Appl Opt. 1997;36:125–135. doi: 10.1364/ao.36.000125. [DOI] [PubMed] [Google Scholar]
- 37.Kita R, Takahashi A, Kaibara M, Kubota K. Biomacromolecules. 2002;3:1013–1020. doi: 10.1021/bm025545v. [DOI] [PubMed] [Google Scholar]
- 38.Flock ST, Wilson BC, Patterson MS. IEEE Trans Biomed Eng. 1989;36:1169–1173. doi: 10.1109/10.42107. [DOI] [PubMed] [Google Scholar]
- 39.Riha P, Wang X, Liao R, Stoltz JF. Clin Hemorheol Microcirc. 1999;21:45–49. [PubMed] [Google Scholar]
- 40.Tripathi MM, Hajjarian Z, Cott EMV, Nadkarni SK. J Biomed Opt Express. 2014;5:817–831. doi: 10.1364/BOE.5.000817. [DOI] [PMC free article] [PubMed] [Google Scholar]
- 41.Giacomelli M, Zhu Y, Lee J, Wax A. Opt Express. 2010;18:14616–14626. doi: 10.1364/OE.18.014616. [DOI] [PMC free article] [PubMed] [Google Scholar]
- 42.Green D. Hemodial Int. 2006;10(Suppl 2):S2–4. doi: 10.1111/j.1542-4758.2006.00119.x. [DOI] [PubMed] [Google Scholar]
- 43.Davie EW, Fujikawa K, Kisiel W. Biochemistry. 1991;30:10363–10370. doi: 10.1021/bi00107a001. [DOI] [PubMed] [Google Scholar]
- 44.Gando S. Crit Care Med. 2010;38:S35–42. doi: 10.1097/CCM.0b013e3181c9e31d. [DOI] [PubMed] [Google Scholar]
- 45.Kamada H, Hattori K, Hayashi T, Suzuki K. Thromb Res. 2004;114:195–203. doi: 10.1016/j.thromres.2004.06.008. [DOI] [PubMed] [Google Scholar]
- 46.Westein E, de Witt S, Lamers M, Cosemans JM, Heemskerk JW. Platelets. 2012;23:501–509. doi: 10.3109/09537104.2012.709653. [DOI] [PubMed] [Google Scholar]
- 47.Korolevich AN, Meglinsky IV. Bioelectrochemistry. 2000;52:223–227. doi: 10.1016/s0302-4598(00)00109-4. [DOI] [PubMed] [Google Scholar]
- 48.Fine I, Kuznik BI, Kaminsky AV, Shenkman L, Kustovsjya EM, Maximova OG. J Biomed Opt. 2012;17:087002. doi: 10.1117/1.JBO.17.8.087002. [DOI] [PubMed] [Google Scholar]
- 49.Kuznik BI, Fine IW, Kaminsky AV. Bull Exp Biol Med. 2011;151:655–657. doi: 10.1007/s10517-011-1407-8. [DOI] [PubMed] [Google Scholar]