

Abstract
Background
Despite its obvious pathophysiological relevance, the clinical utility of measures of esophagogastric junction (EGJ) contractility is unsubstantiated. High-resolution manometry (HRM) may improve upon this with its inherent ability to integrate the magnitude of contractility over time and length of the EGJ. This study aimed to develop a novel HRM metric summarizing EGJ contractility and test its ability distinguish among subgroups of proton pump inhibitor non-responders (PPI-NRs).
Methods
75 normal controls and 88 PPI-NRs were studied. All underwent HRM. PPI-NRs underwent pH-impedance monitoring on PPI therapy scored in terms of acid exposure, number of reflux events, and reflux-symptom correlation and grouped as meeting All Criteria, Some Criteria, or No Criteria of abnormality. Control HRM studies were used to establish normal values for candidate EGJ contractility metrics, which were then compared in their ability to differentiate among PPI-NR subgroups.
Results
The EGJ contractile integral (EGJ-CI), a metric integrating contractility across the EGJ for three respiratory cycles, best distinguished the All Criteria PPI-NR subgroup from controls and other PPI-NR subgroups. Normal values (median, [IQR]) for this measure were 39 mmHg-cm [25–55 mmHg-cm]. The correlation between the EGJ-CI and a previously proposed metric, the lower esophageal sphincter-pressure integral, that used a fixed 10s time frame and an atmospheric as opposed to gastric pressure reference was weak.
Conclusion
Among HRM metrics tested, the EGJ-CI was best in distinguishing PPI-NRs meeting All Criteria of abnormality on pH-impedance testing. Future prospective studies are required to explore its utility in management of broader groups of GERD patients.
INTRODUCTION
Esophagogastric junction (EGJ) contraction at rest is a fundamental defense mechanism against reflux. However, quantifying EGJ contractility is complicated by temporal variability and the complexity of EGJ anatomy as highlighted by its asymmetry in manometric and ultrasound studies. Hence, somewhat paradoxically, there are limited data substantiating that manometric measures are useful in diagnosing gastroesophageal reflux disease (GERD) or in stratifying disease severity [1,2]. Rather, the current role of manometry in GERD management is to exclude motor disorders as a cause of the suspected GERD symptoms.
The widespread adoption of high resolution manometry (HRM) during the past decade has helped objectify and standardize the diagnosis of esophageal motility disorders, summarized in a recent publication outlining the Chicago Classification [3]. However, that document assesses the EGJ only in terms of the adequacy of deglutitive relaxation, not from the perspective of reflux. Nonetheless, several mechanistic studies have demonstrated the utility of HRM in investigating the pathophysiology of reflux and there is a clear need for the development of some pressure topography metric(s) to quantify the contractility of the EGJ. Toward that end, Hoshino et al [4] recently described the lower esophageal sphincter pressure integral (LES-PI), a novel HRM parameter to differentiate patients by the severity of distal esophageal acid exposure. The LES-PI utilized the distal contractile integral (DCI) tool [5] available in current HRM software packages, to quantify inter-deglutitive EGJ pressure as an antireflux barrier.
Although conceptually appealing, there are limitations to the LES-PI metric described by Hoshino et al. The demarcation of the LES margins utilized a set 20 mmHg isobaric contour referenced to atmospheric pressure and a fixed 10s period of the recording that may over or under-represent the contribution of the diaphragmatic contraction on EGJ contractility. Hence, we hypothesized that a modified version of the LES-PI that normalizes for respiratory rate and referenced to intragastric pressure would better characterize the barrier function of the EGJ. Thus, this study aimed 1) to establish normative ranges of a novel HRM metric, the EGJ contractile index (EGJ-CI), relevant to EGJ function as an antireflux barrier, and 2) to apply this metric in well characterized proton pump inhibitor non-responder (PPI-NR) populations to test its performance compared to other measures of EGJ integrity.
METHODS
Study subjects
Manometric studies were done on 75 healthy volunteers, recruited by advertisement or word of mouth. This was the same group of studies utilized in our previous reports establishing normative data ranges for several other HRM metrics [1,2,5–7]. The control subjects had no history of gastrointestinal symptoms or upper gastrointestinal tract surgery and all were without other significant medical conditions.
The PPI-NR group was comprised of 88 patients with typical GERD symptoms of heartburn, regurgitation or chest pain. Prior to being labeled PPI-NR they were treated with a single dose PPI for 4 weeks, then a double dose PPI for another 4 weeks without resolution of their symptoms. These patients were then subclassified using pH-impedance data. All patients had upper endoscopy to exclude GERD complications and alternative diagnoses. The study protocol was approved by the Northwestern University Institutional Review Board, and informed consent was obtained from each participant of the study.
pH-impedance studies
Esophageal pH-impedance monitoring was performed using a Sleuth Multi-channel Intraluminal Impedance ambulatory system (Sandhill Scientific, Inc.; Highland Ranch, CO). The system includes a portable data logger with impedance-pH amplifiers and a catheter containing one antimony pH electrode and eight impedance electrodes at 2, 4, 6, 8, 10, 14, 16, and 18 cm from the tip of the catheter. Each pair of adjacent electrodes constitutes an impedance-measuring segment (2 cm length), corresponding to one recording channel. The impedance amplifier delivers AC voltage in a frequency range of 1–2 kHz with resulting current flow variations indicative of intraluminal impedance changes. The six impedance and pH signals were recorded at 50 Hz.
Studies were performed on-PPIs during 24 hours on an outpatient basis after an overnight fast. Before the start of the recordings, the pH electrode was calibrated using pH 4.0 and 7.0 buffer solutions. After LES location by esophageal manometry, the impedance-pH catheter was passed transnasally under topical anesthesia and positioned in the esophageal body to record pH at 5 cm and impedance at 3, 5, 7, 9, 15, and 17 cm proximal to the LES. Subjects were encouraged to maintain normal activities, sleep schedule, and eat their usual meals at their normal times. They were asked to remain upright during the day, and lie down only at their usual bedtime. Event markers on the data-logger recorded symptoms, meal times, and posture changes.
Data Analysis and classification of PPI-NR
The pH-impedance data were analyzed using dedicated analysis software (Bioview Analysis, Sandhill Scientific, Inc.) after transfer of the data to a PC/Windows based computer. Analysis included identification, enumeration, and characterization of individual reflux events, measure of clearance times (bolus and pH clearance), and measures of esophageal exposure to volume and acid. PPI-NRs were subclassified into three subgroups based on parameters indicative of abnormal reflux in pH-impedance studies [8]:
No Criteria: acid exposure <2%, <48 reflux events (RE)/24h, and symptom index <20%;
All Criteria: acid exposure >4%, >73 RE/24h; and symptom index >50%;
Partial criteria: patients meeting some, but not all criteria.
High-resolution manometry
Manometric studies were performed in the supine position after at least a 6-h fast. The HRM catheters were 4.2 mm outer diameter solid-state assemblies with 36 circumferential sensors at 1-cm intervals (Given Imaging, Duluth, GA, USA). Transducers were calibrated at 0 and 300 mmHg using externally applied pressure. Manometric assemblies were placed transnasally and positioned to record from the hypopharynx to the stomach with at least three intragastric sensors. The manometric protocol included a 5-min baseline recording and ten 5-mL swallows in the supine position.
Manometric studies were analyzed with Manoview analysis software (Given Imaging, Duluth, GA, USA). The EPT metrics utilized for the Chicago Classification [3,4] were the integrative relaxation pressure (IRP), distal contractile integrity (DCI), contractile front velocity (CFV) and distal latency (DL) [5]. Metrics utilized to quantify resting EGJ pressure (HRM EGJ metrics) were the following:
Lower esophageal sphincter pressure integral (LES-PI) as described by Hoshino [4] determined by enclosing the domain of the LES area during a 10s-period time with the DCI tool, setting the threshold isobaric contour (IBC) at 20 mmHg
A novel metric, EGJ contractile index (EGJ-CI) developed as an alternative to the LES-PI (Figure 1). As with the LES-PI, the upper and lower margins of the EGJ were enclosed in a DCI tool box. However, the duration of the box was exactly three consecutive respiratory cycles and the threshold IBC was set at 2 mmHg above the gastric pressure. The value computed with the DCI tool in mmHg-s-cm was then divided by the duration of the three respiratory cycles (in seconds) yielding EGJ-CI units of mmHg-cm. Hence, although time is not a factor in EGJ-CI units, the measure does reflect the contractility of the EGJ for a period of three respiratory cycles.
Inspiratory EGJ pressure (EGJP-insp). Average maximal inspiratory EGJ pressure for 3 respiratory cycles, ideally in a quiescent portion of recording, free of swallows
Expiratory EGJ pressure (EGJP-exp). Average EGJ pressure midway between inspirations for the same 3 respiratory cycles
Separation between the LES and crural diaphragm (LES-CD). The EGJ pressure profile on a spatial pressure variation plot at peak inspiration can be a single or double peak. If a single peak, the LES-CD separation is 0; if a double peak, LES-CD separation is the axial distance between peaks.
Figure 1.
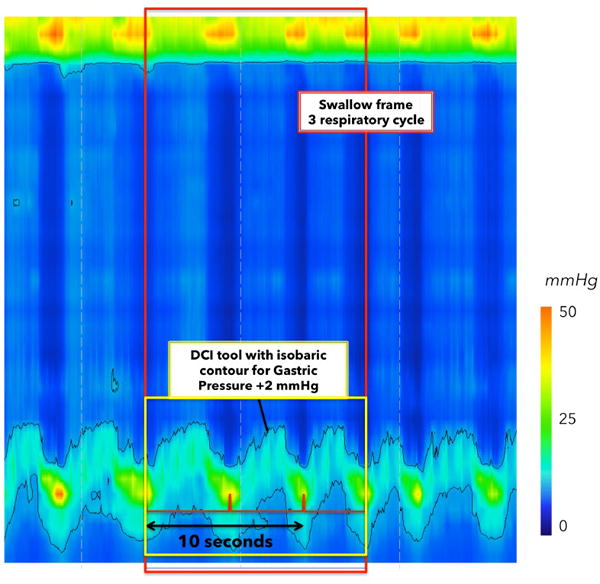
Determination of resting parameters using the DCI tool. A swallow frame (red box) is added during baseline, beginning at a crural contraction. The end of the box is selected after 3 complete respiratory cycles for the calculation of EGJ-CI (for the calculation of LES-PI, a 10-seconds box would is selected). EGJ margins are determined as a 2-mmHg pressure increase above the intra-gastric pressure, using the isobaric contour. Then, the DCI tool gives a value of the ‘3 respiratory cycle’ integral pressure that is divided by the time duration of the EGJ-CI window.
Statistical analysis
Data were expressed as median and interquartile range (IQR), and normative data were reported at the 5th and 95th percentile. The Wilcoxon Rank Sum test and the Kruskal–Wallis test were used to compare differences in metrics between groups. Pearson correlation between each paired value for LES-PI and EGJ-CI was compared to EGJP-exp and EGJP-insp. All p-values were two-tailed with the level of significance defined at 0.05.
RESULTS
The group of 75 volunteers was composed of 40 men and 35 women, aged 19 to 48 years. The 88 patients were 41 men and 47 women, aged from 18 to 82 years. There was no difference between volunteers and PPI-NR, in the EPT metrics utilized for the Chicago classification (IRP, DL, CFV) except for the DCI, which was significantly lower in PPI-NRs (Kruskal-Wallis: p<0.05) without a discrete cutoff value to differentiate normal volunteers and PPI-NRs. Table 1 summarizes demographic, pH-impedance and HRM data of the PPI-NR group subdivided into the no criteria, partial criteria, and all criteria subgroups.
Table 1.
Demographic, manometry and pH-impedance findings among PPI-NR subgroups
| PPI Non Responder subgroups | |||
|---|---|---|---|
| No criteria | Partial Criteria | All criteria | |
| Number; male | 36; 13M | 45; 23M | 7; 5M |
| Age, Median [range] | 62 [26–81] | 55 [18–82] | 56 [28–69] |
| Esophageal acid exposure (total %) | 0 [0–1] | 3 [0–7] | 15 [7.25–27] |
| Number of acid reflux events | 2 [0.25–4] | 7 [2–16.5] | 62 [37–80] |
| DCI (mmHg.s.cm) | 950 [625–1765]* | 790 [430–1475]* | 750 [170–1390]* |
| IRP (mmHg) | 8 [4–9] | 7 [5–9] | 5.5 [3–10] |
| DL (s) | 7 [6.8–8] | 7 [6–8.3] | 7 [6.9–7.3] |
| CFV (cm/s) | 4 [3–5] | 5 [3.8–6] | 3 [2.7–3.4] |
p<0.05 compared to DCI for Normal volunteers: 1600 mmHg.s.cm [1000–2200]
HRM EGJ metrics in control subjects
The normal ranges [5th–95th percentiles] of the HRM EGJ metrics for the control subjects were 78 mmHg.s.cm [0.0–512] for LES-PI and 39 [13–116] for EGJ-CI. Other parameters are presented in Table 2. The fact that the normal range for LES-PI included zero means that there were occurrences in which LES-PI detected no EGJ pressure in control subjects. The correlation between LES-PI and EGJ-CI, was weak (r=0.40; r2=0.16), suggesting that these metrics quantified distinct attributes of the EGJ. Of the two, the EGJ-CI correlated more strongly with the more conventional pressure metrics of EGJP-insp and EGJP-exp; the correlations for EGJ-CI were 0.57 (r2=0.32) and 0.68 (r2=0.46) respectively compared to 0.46 (r2=0.21) and 0.49 (r2=0.24) for LES-PI.
Table 2.
HRM EGJ characteristics of normal volunteers and patients groups (Median [IQR])
| EGJ Metric | Control Subjects | PPI Non Responders | |||
|---|---|---|---|---|---|
| Whole group (n=88) | No Criteria (n=36) | Partial Criteria (n=45) | All Criteria (n=7) | ||
| LES-PI (mmHg-s-cm) | 78 [19–208] | 70 [12–211] | 78 [22–220] | 70 [9–245] | 5 [0–55]* |
| LES-CD (cm) | 0 [0–0] | 1 [0–2]* | 0.5 [0–2]* | 1 [0–2]* | 1 [1–3]* |
| EGJP-exp (mmHg) | 14 [9–20] | 7 [4–13]* | 9 [4–15]* | 7 [4–13]* | 7 [4–12]* |
| EGJP-insp (mmHg) | 34 [29–43] | 33 [23–47] | 32 [24–53] | 31 [25–47] | 21 [14–33]*† |
| EGJ-CI (mmHg-cm) | 39 [25–55] | 33 [18–65] | 45 [23–67] | 27 [17–69] | 18 [8–30]*† |
Different from Normal (Mann-Whitney)
Different between subgroups of patients with All Criteria and other subgroups of patients
The correlation between EGJ-CI and IRP was also weak (r=0.32; r2=0.10), highlighting that although both metrics quantify the EGJ pressure, they do so during distinct conditions; restful respiration in one case and deglutitive relaxation in the other. Figure 2 illustrates scatter plots of the correlation between EGJ-CI and LES-PI, EGJP-insp, EGJP-exp, and IRP. Note that there was no correlation between the esophageal acid exposure time and EGJ-CI (r=−0.139; p=0.267) in these On-PPI studies. However, the EGJ-CI was higher in the group of patients experiencing less than 48 reflux events, even if the difference was not significant (41.6 mmHg.cm [19.6–67.0] for less than 48 reflux events vs. 22.0 mmHg.cm [14.4–42.5]; p=0.1).
Figure 2.
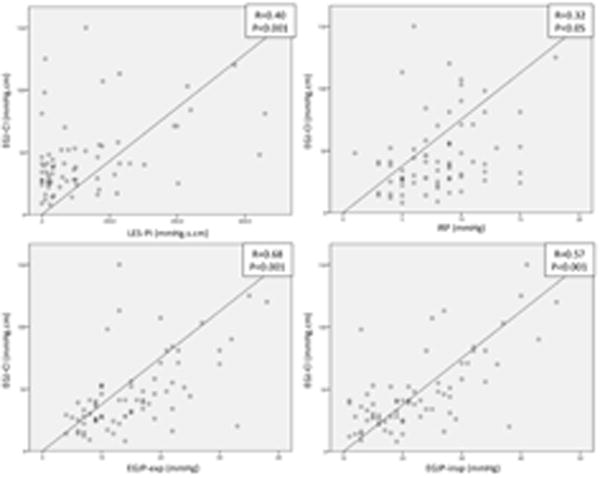
Scatter plots of the correlation between EGJ-CI and IRP, LES-PI, EGJP-insp, and EGJP-exp in control subjects.
Comparison of HRM EGJ metrics in the PPI-NR subgroups
Table 2 summarizes the HRM EGJ data among patient groups. Even though they were numerically the fewest, patients in the All Criteria subgroup were significantly different than controls in all 5 tested EGJ metrics, whereas there was overlap between controls and patients in the No Criteria and Partial Criteria subgroups. The All Criteria subgroup also had significantly lower EGJ-insp and EGJ-CI than the No Criteria and Partial Criteria subgroups. On the other hand, the No Criteria and Partial Criteria subgroups (and the PPI-NR group as a whole) differed from controls only in terms of a lower EGJP-exp and a higher LES-CD separation. Figure 3 illustrates typical examples of No Criteria, Partial Criteria, and All Criteria patients along with the stepwise computation of the EGJ-CI for each. Although relatively few of these patients had substantially positive values of LES-CD separation, the EGJ-CI did not differ significantly in those with (36 mmHg.cm [18–64]) vs. without (38 mmHg.cm [22–60]) an LES-CD measurement greater than 0, (p=0.79). Of note, 12 patients among the PPI-NRs had an LES-PI equal to zero: 4 in the No Criteria, 5 in Some Criteria, and 3 in All Criteria group.
Figure 3.
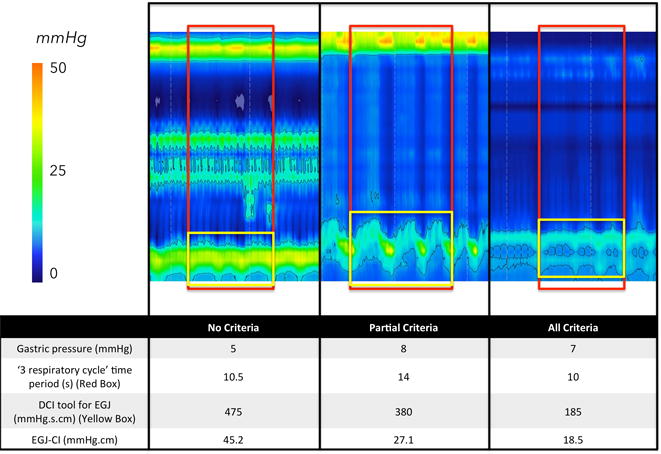
Example of resting parameters among PPI-NR sub-groups. The red box represents the ‘3 respiratory cycle’ time period. The red box delimitates the EGJ and the isobaric contour permits to calculate the EGJ-DCI for any pressure above the gastric pressure + 2 mmHg.
DISCUSSION
The primary aim of this study was to develop an HRM pressure topography metric to quantify the contractility of the EGJ during normal respiration. The secondary aim was to test its ability to discriminate patients with graded degrees of EGJ dysfunction as quantified with pH-impedance reflux monitoring studies. The major finding was that among the metrics tested, the EGJ-CI, a complex metric integrating the EGJ contractility during three respiratory cycles and referenced to gastric pressure best accomplished this.
HRM has instigated an unquestionable quantum leap in our understanding of esophageal physiology and gone a long way to clarifying the classification of esophageal motility disorders [3]. However, with respect to the EGJ as an antireflux barrier, relatively less progress has been made. This is in part because the EGJ is a complex entity and its pathology is tridimensional: dysfunction in terms of deglutitive relaxation, anatomical disruption typified by hiatus hernia, and competence in preventing gastroesophageal reflux. The first two of these dimensions have been well characterized in HRM pressure topography metrics; the IRP has proven to be a robust metric of the adequacy of deglutitive relaxation [9] and LES-CD separation a robust measure of the integrity of EGJ anatomy [10], recognizing that hiatus hernia can be an intermittent event from a manometric perspective [11]. The third dimension of EGJ pathology, it’s function as an antireflux barrier, was the focus of this investigation. A major confounder in this assessment is the dual contribution of the diaphragm and the LES to EGJ pressure. Both are important, albeit under different circumstances. LES tone, approximated by the EGJP-exp metric, provides a measure of the minimal barrier pressure during expiration. As such, this must be referenced to intra-gastric pressure. However, EGJP-exp is not completely devoid of diaphragmatic hiatus influence during expiration in patients without hiatus hernia as evidenced by instances of surgical removal of the LES [12] and recent 3D HRM studies [13]. The diaphragmatic contraction, quantified by the EGJP-insp metric represents an indirect value of the diaphragmatic contraction during inspiration. In a previous analysis, we found that this parameter was the best conventional manometric metric for predicting reflux severity categorized by endoscopic and pH-metry criteria [10]. Hence, it was not surprising that both the EGJ-CI and the EGJ-insp best discriminated among PPI-NR subgroups. The hypothesis behind the development of the EGJ-CI was to capture both attributes of EGJ barrier function in a single topographic metric and, at least in the analysis of these patient groups, it appears that was successful.
Ours is not the first attempt at developing an HRM metric to summarize EGJ barrier function. Hoshino, et al. [4] recently described the EGJ-PI that is conceptually similar to the EGJ-CI and served as a comparator in the current study. However, in terms of the computation itself, there are two important differences: the use of intragastric pressure as a reference and negating the effect of the respiratory rate by varying the duration of the period measured. Using intragastric pressure as a reference is important because the intragastric pressure increases with abdominal obesity [14] and the alternative of using an atmospheric reference overstates the adequacy of barrier function in that instance. The importance of this modification is evident with the observation that the 5th percentile, and hence the CI of the LES-PI was zero. As for the duration of the period used in the computation, using three complete respiratory cycles and then dividing by the exact duration of those cycles made the calculation reflective of barrier function over a 5–25 s period of time, but independent of respiratory rate. LES-PI, on the other hand, can be strongly influence by respiratory rate, potentially capturing anywhere from one to six inspiratory contractions within a 10-s window. As for nomenclature, we chose ‘EGJ’ rather than ‘LES’ as the label for the metric because intraluminal pressure measurements are necessarily the summation of LES and diaphragmatic effects. Finally, like any manometric measurement, the normative range of the EGJ-CI will be device-specific, dependent on the manometric technology utilized. Our data are specific for the Given standard HRM manometric assemblies. Emphasizing the importance of this point, our normal values for the LES-PI were clearly discrepant from those reported by Hoshino et al using a Unisensor recording device. Using their numbers, all of the 75 volunteers in our study may have been at risk for reflux. This difference is more than likely explained by the difference in the HRM systems and application of the EGJ-CI metric to a different HRM system will require normative data for that system.
One of the limitations of this study was the use of non-validated impedance pH criteria for the separation of patients among PPI-NRs. However, this classification was formulated to create patient groups that were either very normal or very abnormal to test the validity of the HRM measurements. Patients who presented with all validated criteria for GERD using pH-impedance are more likely to have EGJ dysfunction, which was, indeed, the case. On the other hand, the PPI-NR patients in the No Criteria subgroup were very similar to normal controls. However, the resultant small number of patients in the All Criteria subgroup represents an important limitation of this study that somewhat reduced its statistical power. Another important limitation of the EGJ-CI is that although it characterizes the barrier function of the EGJ at rest in the setting of a fasted manometry study, it does not account for the temporal variability of the measure and it in no way accounts for the potential of transient LES relaxations, both recognized to be important pathophysiological determinants of GERD. Nonetheless, our focus was in quantifying barrier function of the EGJ at rest, which we expect might be a complementary measure of EGJ integrity, potentially useful in identifying patients likely to benefit from antireflux surgery.
In summary, the findings of this study suggest that a novel HRM topographic metric, the EGJ-CI may be useful in distinguishing PPI-NR patients with functional heartburn from those with refractory GERD. Additionally, the role of the diaphragmatic hiatus in GERD pathogenesis is supported by these results as the two indices that best distinguished patients with abnormal reflux testing were those that most precisely incorporated the diaphragmatic contraction into the metric. Moving forward, further studies of temporal variability in the EGJ-CI, the effect of varying degrees of hiatus hernia, and the relationship between EGJ-CI and abnormal esophageal pH-metry are necessary to more fully understand its utility in the management of GERD patients.
Acknowledgments
This work was supported by grants R01 DC00646 (PJK) and R01 DK092217 (JEP) from the United States Public Health Service.
Abbreviations
- LES
lower esophageal sphincter
- EGJ
esophagogastric junction
- GERD
gastroesophageal reflux disease
- HRM
high-resolution manometry
- EPT
esophageal pressure topography
- LES-PI
lower esophageal sphincter pressure integral
- EGJ-CI
esophagogastric junction contractile index
- PPI-NR
proton pump inhibitor non-responder
References
- 1.Pandolfino JE, Kahrilas PJ, American Gastroenterological A AGA technical review on the clinical use of esophageal manometry. Gastroenterology. 2005;128(1):209–224. doi: 10.1053/j.gastro.2004.11.008. [DOI] [PubMed] [Google Scholar]
- 2.Kahrilas PJ, Shaheen NJ, Vaezi MF. American Gastroenterological Association Institute Technical Review on the Management of Gastroesophageal Reflux Disease. Gastroenterology. 2008;135(4):1392–1413.e5. doi: 10.1053/j.gastro.2008.08.044. [DOI] [PubMed] [Google Scholar]
- 3.Bredenoord AJ, Fox M, Kahrilas PJ, et al. Chicago classification criteria of esophageal motility disorders defined in high resolution esophageal pressure topography. Neurogastroenterol Motil. 2012;24(Suppl 1):57–65. doi: 10.1111/j.1365-2982.2011.01834.x. [DOI] [PMC free article] [PubMed] [Google Scholar]
- 4.Hoshino M, Sundaram A, Mittal SK. Role of the Lower Esophageal Sphincter on Acid Exposure Revisited with High-Resolution Manometry. Journal of the American College of Surgeons. 2011;213(6):743–750. doi: 10.1016/j.jamcollsurg.2011.09.002. [DOI] [PubMed] [Google Scholar]
- 5.Pandolfino JE, Ghosh SK, Rice J, Clarke JO, Kwiatek MA, Kahrilas PJ. Classifying esophageal motility by pressure topography characteristics: a study of 400 patients and 75 controls. Am J Gastroenterol. 2008;103(1):27–37. doi: 10.1111/j.1572-0241.2007.01532.x. [DOI] [PubMed] [Google Scholar]
- 6.Ghosh SK, Pandolfino JE, Zhang Q, Jarosz A, Shah N, Kahrilas PJ. Quantifying esophageal peristalsis with high-resolution manometry: a study of 75 asymptomatic volunteers. Am J Physiol Gastrointest Liver Physiol. 2006;290(5):G988–97. doi: 10.1152/ajpgi.00510.2005. [DOI] [PubMed] [Google Scholar]
- 7.Pandolfino JE, Ghosh SK, Zhang Q, Jarosz A, Shah N, Kahrilas PJ. Quantifying EGJ morphology and relaxation with high-resolution manometry: a study of 75 asymptomatic volunteers. Am J Physiol Gastrointest Liver Physiol. 2006;290(5):G1033–40. doi: 10.1152/ajpgi.00444.2005. [DOI] [PubMed] [Google Scholar]
- 8.Sifrim D, Holloway RH, Silny J, et al. Acid, nonacid, and gas reflux in patients with gastroesophageal reflux disease during ambulatory 24-hour pH-impedance recordings. Gastroenterology. 2001;120(7):1588–1598. doi: 10.1053/gast.2001.24841. [DOI] [PubMed] [Google Scholar]
- 9.Ghosh SK, Pandolfino JE, Rice J, Clarke JO, Kwiatek M, Kahrilas PJ. Impaired deglutitive EGJ relaxation in clinical esophageal manometry: a quantitative analysis of 400 patients and 75 controls. Am J Physiol Gastrointest Liver Physiol. 2007;293(4):G878–85. doi: 10.1152/ajpgi.00252.2007. [DOI] [PubMed] [Google Scholar]
- 10.Pandolfino JE, Kim H, Ghosh SK, Clarke JO, Zhang Q, Kahrilas PJ. High-Resolution Manometry of the EGJ: An Analysis of Crural Diaphragm Function in GERD. Am J Gastroenterol. 2007;102(5):1056–1063. doi: 10.1111/j.1572-0241.2007.01138.x. [DOI] [PubMed] [Google Scholar]
- 11.Bredenoord AJ, Weusten BLAM, Timmer R, Smout AJPM. Intermittent spatial separation of diaphragm and lower esophageal sphincter favors acidic and weakly acidic reflux. Gastroenterology. 2006;130(2):334–340. doi: 10.1053/j.gastro.2005.10.053. [DOI] [PubMed] [Google Scholar]
- 12.Klein WA, Parkman HP, Dempsey DT, Fisher RS. Sphincterlike thoracoabdominal high pressure zone after esophagogastrectomy. Gastroenterology. 1993;105(5):1362–1369. doi: 10.1016/0016-5085(93)90140-8. [DOI] [PubMed] [Google Scholar]
- 13.Nicodème F, Lin Z, Pandolfino JE, Kahrilas PJ. Esophagogastric Junction pressure morphology: comparison between a station pull-through and real-time 3D-HRM representation. Neurogastroenterol Motil. 2013;25(9):e591–8. doi: 10.1111/nmo.12168. [DOI] [PMC free article] [PubMed] [Google Scholar]
- 14.de Vries DR, van Herwaarden MA, Smout AJPM, Samsom M. Gastroesophageal Pressure Gradients in Gastroesophageal Reflux Disease: Relations With Hiatal Hernia, Body Mass Index, and Esophageal Acid Exposure. Am J Gastroenterol. 2008;103(6):1349–1354. doi: 10.1111/j.1572-0241.2008.01909.x. [DOI] [PubMed] [Google Scholar]