

Abstract
The entorhinal cortex (EC) plays a central role in episodic memory and is among the earliest sites of neurodegeneration and neurofibrillary tangle formation in Alzheimer's disease. Given its importance in memory and dementia, the ability to selectively modulate gene expression or neuronal function in the EC is of widespread interest. To this end, several recent studies have taken advantage of a transgenic line in which the tetracycline transactivator (tTA) was placed under control of the neuropsin (Nop) promoter to limit transgene expression within the medial EC and pre-/parasubiculum. Although the utility of this driver is contingent on its spatial specificity, no detailed neuroanatomical analysis of its expression has yet been conducted. We therefore undertook a systematic analysis of Nop-tTA expression using a lacZ reporter and have made the complete set of histological sections available through the Rodent Brain Workbench tTA atlas, www.rbwb.org. Our findings confirm that the highest density of tTA expression is found in the EC and pre-/parasubiculum, but also reveal considerable expression in several other cortical areas. Promiscuous transgene expression may account for the appearance of pathological protein aggregates outside of the EC in mouse models of Alzheimer's disease using this driver, as we find considerable overlap between sites of delayed amyloid deposition and regions with sparse (β-galactosidase reporter labeling. While different tet-responsive lines can display individual expression characteristics, our results suggest caution when designing experiments that depend on precise localization of gene products controlled by the Nop-tTA or other spatially restrictive transgenic drivers.
Keywords: Tetracycline transactivator, Ectopic expression, Tet-lacZ reporter, Rodent brain atlas, Tet-off transgenic
Introduction
The entorhinal cortex (EC) forms a central hub within the medial temporal lobe that serves as an interface between polymodal association cortices and the hippocampal formation (Canto et al. 2008). As the central gatekeeper responsible for receiving and redistributing the sensory information we perceive, neuronal dysfunction in the EC has a profound effect on episodic learning and memory (Schwarcz and Witter 2002). Not surprisingly, this region is among the earliest sites of neuron loss and neurofibrillary tangle formation in Alzheimer's disease (AD) (Braak and Braak 1991). Consistent with damage to this circuit, the onset of disease is characterized by deficits of autobiographical memory (Querfurth and LaFerla 2010).
Given its importance in the balance between memory and dementia, the EC has been an attractive target for experimental manipulation of gene expression or neuronal function in models of neurological disease. One of the most widely used transgenic lines for manipulating expression in this region uses the neuropsin (Nop) promoter to limit spatial distribution of the tetracycline transactivator (tTA). When crossed with a second tet-responsive transgenic line, the resulting bigenic mice will express the transgene of interest in neurons where tTA is active. This Nop-tTA mouse was reported to restrict tet-responsive transgenes to the superficial layers of medial EC plus parts of the pre-and parasubiculum (Yasuda and Mayford 2006). While the line was originally used to examine how entorhinal elevation of calcium–calmodulin kinase IIα activity would affect learning and memory, it has since been used to study activity-dependent competition in the entorhinal–hippocampal circuitry (Yasuda et al. 2011) and to identify a novel monosynaptic connection between EC and hippocampal area CA2 (Rowland et al. 2013). The line has also become popular in studies examining the propagation of abnormal protein aggregates in AD, where it has formed the basis for several landmark papers demonstrating the potential for trans-synaptic spread of both amyloid (Harris et al. 2010) and tau aggregates (de Calignon et al. 2012; Liu et al. 2012).
Of course, the utility of any transgenic driver line designed to provide spatially restricted expression is contingent on its specificity. The gold standard for confirming transgene localization is to include a reporter of some sort in the expression construct, however, this is often either not possible or not done. In those cases, the best way to examine spatial specificity is to cross the driver line with a reporter line that expresses an easily detectable marker such as a fluorescent protein or β-galactosidase. To this end, the expression of more than 250 Cre lines has been characterized by the GENSAT team using a GFP reporter and presented as a resource to the community through a freely available online atlas. The histological images they provide offer potential users a starting point from which to gauge the utility of each driver for their studies (Gong et al. 2007). Given our particular interest in the tTA system for neuronal transgene expression, we have initiated an independent online atlas to provide high-resolution images of lacZ reporter expression from the most widely used tTA driver lines (Boy et al. 2006; Odeh et al. 2011). Recognizing the importance of entorhinal-restricted expression in the Nop-tTA line for past studies in both AD and memory, we now add this driver to our atlas within the Rodent Brain Workbench (www.rbwb.org). Here, we describe our characterization of this line, and the unexpected distribution of tTA activity that may have important implications for past studies with this model.
Materials and methods
Animals
Our primary studies examined adult bigenic Nop-tTA/tetO-lacZ-nls-GFP mice (n = 6; 1–4 per age at 2.5, 6–7, and 9 months; 4 males, 2 females) and sibling age-matched tetO-lacZ-nls-GFP single transgenic controls (n = 1–2 per age at 2.5 and 6–7 months; 2 males, 1 female). Additional experiments used adult bigenic Nop-tTA/tetO-H2B-GFP mice (n = 2 at 2.5 months, and n = 1 tetO-GFP single transgenic control, all female), and bigenic Nop-tTA/tetO-APP animals (n = 2–3 per age at 6, 9, 12, and 15 months, n = 1 at 21 months; 7 males, 3 females). All animal procedures were in accordance with the National Institutes of Health Guide for the care and use of laboratory animals, and approved by the Baylor College of Medicine Institutional Animal Care and Use Committee.
Neuropsin (Nop)-tTA mice
Mice expressing a humanized tTA under control of the mouse neuropsin (Nop)/Protease Serine 19 (Prss19)/Kallikrein-related peptidase 8 (Klk8) promoter were generously provided by Dr. Mark Mayford [Line tTA-EC; (Yasuda and Mayford 2006)]. The transactivator expressed in this line had been optimized into human codon usage, and is a variant of the published tTA2S sequence (Urlinger et al. 2000) (M. Yasuda, personal communication). The animals carry a BAC transgene that was engineered to place the tTA coding sequence within the first exon of the neuropsin gene, upstream of the translation initiation site. Yasuda and Mayford selected for further study the transgenic founder displaying greatest specificity within EC (originally known as Line S). The line was backcrossed to C57BL/6 for at least 3 generations prior to the time we received them in 2010. We then backcrossed the line to C57BL/6 J for an additional 1–3 generations before outcrossing to the responder lines described in the current studies.
tetO-nls-lac-CMK (tetO-lacZ) mice
tTA reporter mice encoding an in-frame fusion of the E. coli lacZ gene with green fluorescent protein (GFP) under control of the tetO promoter were initially generated by Mayford and colleagues on a hybrid background (B6CBA F2 or B6SJL F2) and later backcrossed to C57BL/6 (Mayford et al. 1996). Signal from this line is limited to the nucleus through the inclusion of a nuclear localization signal (nls) from the SV40 large T antigen. We obtained this line from Dr. Mark Mayford in 2010, and backcrossed them to C57BL/6 J for another 2 generations before outcrossing to the Nop-tTA driver line described above. For simplicity, bigenic offspring are referred to as Nop-lacZ.
tetO-H2B-GFP (tetO-GFP) mice
Tet-responsive mice expressing a fusion of histone 2B with green fluorescent protein (H2B-GFP) were initially generated on an outbred CD1 background (Tumbar et al. 2004), but were backcrossed to C57BL/6 for several generations before being sent to us by Dr. Mark Mayford. Animals were backcrossed to C57BL/6 J for an additional 3 generations before being outcrossed to the Nop-tTA driver line for these experiments. For simplicity, bigenic offspring are referred to as Nop-GFP.
tetO-APPswe/ind (tetO-APP) mice
Tetracycline-responsive mice carrying a chimeric mouse/ human amyloid precursor protein (APP) encoding the Swedish and Indiana mutations were used to assess the correspondence between Nop-tTA reporter expression and amyloid deposition (Jankowsky et al. 2005). Line 885 was chosen for this cross because it displayed the highest level of transgene expression of the tetO-APP lines we had analyzed. TetO-APP mice were generated on a hybrid B6C3 background, and backcrossed to C57BL/6 J for>20 generations before being outcrossed to Nop-tTA. Bigenic Nop-tTA/tetO-APP males were then mated to wild-type ICR females, and offspring from this cross or from a subsequent F2 intercross were used for analysis here. For simplicity, bigenic offspring are referred to as Nop-APP.
Tissue preparation and gelatin embedding for β-galactosidase histology
Nop-lacZ bigenic animals and their lacZ single transgenic littermates received a lethal dose of sodium pentobarbital (150 mg/kg) and were transcardially perfused with cold phosphate-buffered saline (PBS) containing 10 U/ml of heparin followed by 4 % paraformaldehyde (PFA) in PBS. The brain was extracted and post-fixed by immersion for 3 h at 4 °C in 4 % PFA/PBS before being cryoprotected by immersion in 30 % sucrose/PBS for 48 h at 4 °C. Tissue to be used for coronal sections was aligned in flat skull position (Bjaalie and Leergaard 2006) and bisected coronally at approximately −2.15 mm relative to bregma (Franklin and Paxinos 2008). Tissue was then rinsed in PBS before being incubated for 2 h in PBS containing 5 % gelatin at 37 °C (Sigma, G2500) followed by 2 h in 9 % gelatin/PBS at 37 °C. Following the 4 h gelatin incubation, the tissue was placed flat-face down onto a 3–4 mm thick layer of solidified 9 % gelatin inside a plastic mold and the flooded with liquid 9 % gelatin solution until the tissue was completely submerged. Blocks were allowed to harden at room temperature for 30–60 min. Gelatin blocks were then released from their molds and immersed in 4 % PFA/PBS for 4 h at 4 °C. The blocks were then placed in PBS containing 10 % sucrose for 24 h at 4 °C, followed by 30 % sucrose/ PBS for at least 48 h (and up to 7 days) at 4 °C before it was sectioned.
Nop-APP animals were perfused with PBS, but dissected without fixative perfusion. Tissue was instead immersion fixed overnight at 4 °C. Nop-GFP mice were killed by CO2 inhalation and brains directly placed into immersion fixative overnight at 4 °C. Tissue was cryoprotected in 30 % sucrose/PBS for 48 h at 4 °C without gelatin embedding.
Tissue sectioning
Cryoprotected gelatin blocks were marked with a razor blade to indicate orientation and placed in a peel-away plastic mold (Polysciences, Inc., 18646A-1) filled with prewarmed 37 °C PBS containing 3 % gelatin. The block was then flash frozen by slowly lowering the mold into isopentane (Sigma, M32631) that had been chilled to −60 °C. After 30 min in isopentane, the block was recovered and the plastic mold removed so that the tissue could be mounted with PBS onto the stage of a freezing-sliding microtome and sectioned at 40 μm. Nop-APP and Nop-GFP brains were sectioned at 35 μm. All sections were stored in cryoprotectant at −20 °C until use (0.1 M phosphate buffer pH 7.4, 30 % ethylene glycol, 25 % glycerol).
β-Galactosidase stain
A 1 in 3 series of gelatin sections from Nop-lacZ animals was rinsed several times in TBS, mounted onto Superfrost Plus slides (Fisher, 12-550-15) and air-dried for 24 h before use. The following day, slides were rehydrated in running tap water for 5 min and rinsed for 15 min at room temperature in PBS containing 2 mM MgCl2. The slides were then incubated in pre-warmed 0.1 M phosphate buffer containing 2 mM MgCl2, 0.2 % NP-40, and 0.1% sodium deoxycholate for 10 min at 37 °C before being transferred to a solution of the same composition plus 5 mM ferrocyanide (Sigma, P3289), 5 mM ferricyanide (Sigma, 455946), and 1.5 mM of 5-bromo-4-chloro-3-indolyl-β-d-galactoside (0.06 % final concentration; X-gal, 5Prime, 2500040) for 45 min at 37 °C. The reaction was stopped by washing 3 times at room temperature with 1 × HEPES-buffered saline containing 0.1 % Triton X-100 and 1 mM EDTA. Sections were then fixed for 1 h at 4 °C in 4 % PFA/PBS and washed several times in PBS before being counterstained as described below.
To determine whether differences in staining protocol contributed to the apparent expansion of tTA expression in our mice, we also tested the β-galactosidase protocol used in the original characterization of this line by Yasuda and Mayford (Yasuda et al. 2011). Tissue was briefly fixed onto the slide with 2 % PFA/PBS for 2 min on ice, then rinsed twice in PBS before incubating in pre-warmed 0.1 M phosphate buffer containing 2 mM MgCl2, 5 mM ferrocyanide (Sigma, P3289), 5 mM ferricyanide (Sigma, 455946), and 0.1 % of 5-bromo-4-chloro-3-indolyl-β-D-galactoside (X-gal, 5Prime, 2500040) for 3 h at 37 °C. The reaction was stopped, refixed in PFA, and counterstained as above.
Nuclear fast red counterstain
After stopping the β-galactosidase stain, the slides were defatted by dehydration into xylene and then rehydrated into water. Slides were counterstained for 1 min at room temperature with a 1-to-3 dilution of nuclear fast red stock solution [final concentration of 0.033 % nuclear fast red Kernechtrot (Fluka, 60700) and 1.66 % aluminum sulfate hydrate (Mallinckrodt, 3208)] until the sections attained a light pink color. The slides were then rinsed in running tap water and dehydrated into xylene before being and coverslipped with Permount (Fischer Scientific, S70104).
Green fluorescent protein (GFP) staining
A 1 in 3 series of sections adjacent to those used for β-galactosidase staining were processed to detect the co-expressed GFP reporter present in the tetO-lacZ-nls-GFP line. Sections were rinsed in TBS before non-specific binding was blocked with 5 % normal goat serum in TBS with 0.1 % Triton X-100 for 90 min. Sections were then incubated in chicken anti-GFP (1:500, Abcam, ab13970) for 48 h at 4 °C. Tissue was washed in TBS before being incubated for 90 min with an Alexa-488 conjugated goat anti-chicken IgG secondary antibody (1:500, Invitrogen, A-11039). Sections were washed in TBS, mounted onto Superfrost Plus slides, and coverslipped with Vectashield containing 1.5 μg/ml 4′,6-diamidino-2-phenylindole (DAPI).
Amyloid-β staining
Tissue from two 6-month-old male Nop-APP mice and a single transgenic Nop-tTA control were processed to detect transgenic APP using the human-specific monoclonal antibody 6E10. Sections were rinsed in TBS before endogenous peroxidase activity was quenched by a 20 min pretreatment with 1 % H2O2 plus 0.1 % Triton X-100 in TBS. After rinsing in TBS, non-specific binding was blocked with 5 % normal goat serum plus 0.1 % Triton X in TBS for 90 min. Sections were then incubated in mouse anti-Aβ antibody (1:500, Signet, SIG-39300, clone 6E10) for 24 h at 4 °C. Tissue was washed in TBS before being incubated for 2 h with a biotin-conjugated goat anti-mouse IgG secondary antibody (1:500, Vector, BA-9200). Sections were washed in TBS and incubated for 1 h in HRP-avidin conjugate (Vector Laboratories) diluted 1:50 in TBS. Staining was detected with DAB (D4418, Sigma), before sections were mounted onto slides and left to dry overnight at RT. The following day, slides were rehydrated in running tap water and dehydrated into xylene before being coverslipped with Permount.
Campbell-Switzer silver stain
Sections from Nop-APP bigenic animals were mounted and dried at room temperature for 48 h before staining. A detailed protocol for this stain can be found at the NeuroScience Associates website: http://www.neuroscienceassociates.com/Documents/Publications/campbell-switzer_protocol.htm.
Image acquisition, virtual microscopy and creation of online repository
High-resolution images of β-galactosidase sections were acquired using an automated slide scanner system (Axio Scan, Carl Zeiss MicroImaging, Jena, Germany), yielding TIFF images with a spatial resolution of 0.22 μm/pixel. A comprehensive series of TIFF images from Nop-LacZ animals were uploaded into a database system built on a technological platform described previously (Bjaalie et al. 2005; Moene et al. 2007). The resource uses a web interface (http://www.rbwb.org, choose tTA-atlas) to access a virtual microscopy tool based on Open Zoom technology (www.openzoom.org) for viewing the scanned images.
Anatomical analyses
The density of β-galactosidase-labeled cells in the Nop-lacZ tissue was assessed using a semi-quantitative grading system from 0 to 4 (illustrated in Fig. 2), where grade 0 represents absence of labeled cells (less than 1 per 0.01 mm2), grade 1 represents low density (few cells, possible to count), grade 2 (medium density, several cells that can be individually discerned, but not readily counted), grade 3 (high density, many labeled cells with large degree of overlap), and grade 4 (very high density, where individual cells cannot be discerned). The observed labeling was assigned to an anatomical location based on cytoarchitectonic features within the section. Our primary anatomical reference was the Allen Brain Atlas of the P56 mouse brain (http://atlas.brain-map.org), but delineations of the hippocampal formation and parahippocampal region were based on more recent detailed cytoarchitectonic analyses of this region (Kjonigsen et al. 2011; Witter 2011) and the Rat Hippocampus Atlas, www.rbwb.org). For each section, the distance from bregma was estimated using a combination of the section number, section thickness, and anatomical features with reference to a stereotaxic atlas of the mouse brain (Franklin and Paxinos 2008).
Fig 2.
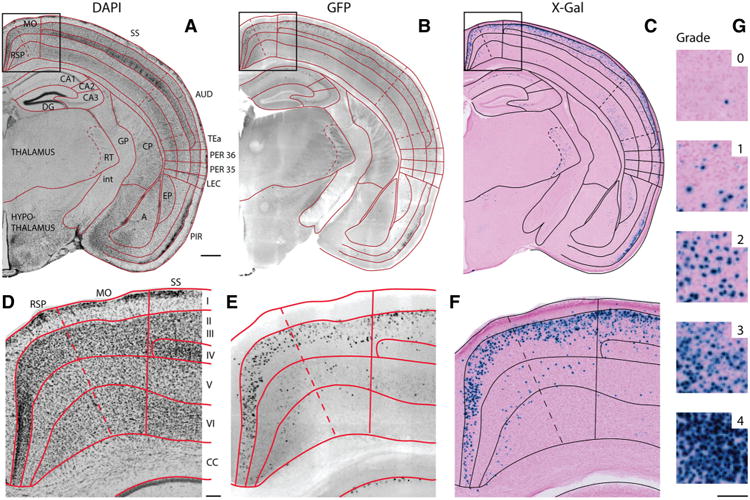
Anatomical delineations and semi-quantitative grading system. a–f Adjacent coronal sections from the Nop-lacZ mice used in the online atlas show fluorescent GFP expression and DAPI counterstain (a, b) alongside colorimetric X-gal staining and nuclear fast red counterstain (c). Both markers can be used for visualization because the tetO-lacZ reporter line included the coding sequence for GFP following that for β-galactosidase. d–f Show enlarged details of the sections in (a–c). g Sample regions illustrate the 5-point semi-quantitative grading system used to describe the density of X-gal-positive cells in each subregion (see “Materials and methods” for additional detail). I–VI layers of the cerebral cortex, A amygdalar nuclei, AUD auditory area, CA1 cornu ammonis 1, CA2 cornu ammonis 2, CA3 cornu ammonis 3, CC corpus callosum, CP caudoputamen, DG dentate gyrus, EP endopiriform nucleus, GP globus pallidus, int internal capsule, LEC lateral entorhinal area, MO motor areas, PER 35 perirhinal area 35, PER36 perirhinal area 36, PIR piriform area, RSP retrosplenial area, RT reticular nucleus of the thalamus, SS somatosensory areas, TEa temporal association areas. Scale bar 500 μm (a–c), 100 μm (d–g)
Results
In 2006, Yasuda and Mayford reported a novel transgenic driver line in which the tetracycline transactivator (tTA) was expressed within a highly restricted population of neurons in the entorhinal cortex and neighboring pre- and parasubiculum (Yasuda and Mayford 2006). The limited distribution of transgenic protein was dependent on both the neuropsin (Nop) promoter used in the construct and a fortuitous genomic insertion site that further restricted tTA activity in one of their founder lines. Because transgene expression levels and even spatial distribution can vary across generations and between genetic backgrounds in mice and other transgenic organisms (Akitake et al. 2011; Opsahl et al. 2002; Robertson et al. 2002), and because the experimental studies we had in mind were dependent on precise localization of tTA expression within the entorhinal cortex, we tested the Nop-tTA mice we received in 2010 with a tet-responsive reporter strain to assess the extent of transgene expression under the conditions we would use for future studies.
Our first cross was to a tet-dependent β-galactosidase reporter, which was detected by X-gal staining in sections spanning the dorsoventral extent of the brain. Because of the inherent signal amplification provided by β-galactosidase histochemistry, this reporter detects a wide range of tTA expression, including cells with low levels of transgenic protein. The first animals we examined displayed strong X-gal staining in the entorhinal cortex as expected based on Yasuda and Mayford's original description of the Nop-tTA line, however, these mice also showed substantial expression in cortical areas well beyond the entorhinal region (Fig. 1a). We wondered whether the excess signal had arisen from tTA-independent β-galactosidase expression in the tetO-lacZ reporter line, but found that tissue taken from single transgenic animals stained alongside the bigenic samples was completely devoid of X-gal signal. We then tested whether methodological differences in the staining protocol accounted for the distinct pattern we observed. We stained additional sections using methods described in the original characterization of the line [detailed in (Yasuda et al. 2011)], but found the higher concentration of X-gal in this developing solution instead made the cortical expression more pronounced rather than less (data not shown). The tetO-lacZ reporter line also carries a nuclear localized GFP (Mayford et al. 1996), and so we next compared the expression pattern detected with each marker in adjacent sections that were developed with X-gal or immunostained for GFP. As shown in Fig. 2, the distribution of GFP and β-galactosidase were consistently well aligned (Fig. 2e, f). This is not unexpected given that the two markers are driven from the same tetO promoter, but does rule out any concern that our X-gal stain could have over-reported expression through enzymatic amplifying of signal (Table 1).
Fig 1.
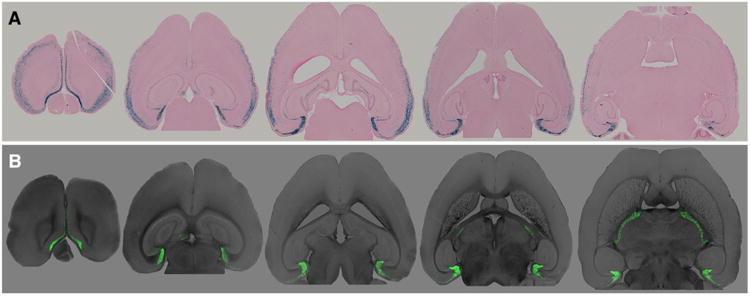
Two distinct responder lines reveal Nop-tTA expression beyond the entorhinal cortex. a Using a nuclear localized lacZ reporter, we detected substantial expression outside the areas where the Nop-tTA driver was known to be active. b Using an H2B-GFP reporter, expression was detected in many of the same areas as in the lacZ animals. Sections were taken from a male Nop-lacZ and a female Nop-H2B-GFP harvested at 2.5 months of age. A high resolution version of this figure is provided in the online Supplementary Information
Table 1. Brainwide distribution and density of Nop-tTA promoter activity.
| Brain region | Score | Comments |
|---|---|---|
| Isocortex | ||
| Orbit area | 0 | A few scattered cells across all layers |
| Somatomotor areas | 2 | Grade 2 in layer 2/3; grade 1 in layer 5; posterior > anterior |
| Anterior cingulate area | 3 | Grade 3 in layer 2/3; grade 1 in layer 6; posterior > anterior |
| Prelimbic area | 1 | Cells in layer 2/3 |
| Infralimbic area | 1 | Cells primarily in layer 2/3 of posterior parts |
| Somatosensory areas | 3 | Grade 3 in layer 2/3; grade 2 in layer 4; grade 1 in layer 6; posterior > anterior |
| Retrosplenial area | 4 | Grade 4 in layer 2/3, grade 2 in layer 6; posterior > anterior |
| Temporal association areas | 4 | Grade 3 in layer 2/3; grade 4 in layer 4; grade 1 in layer 5; grade 2 in layer 6 |
| Posterior parietal association areas | 4 | Grade 3 in layer 2/3; grade 4 in layer 4; grade 1 in layer 5; grade 2 in layer 6 |
| Agranular insular area | 1 | Grade 1 in layer 2/3; grade 1 in layer 6 |
| Gustatory/visceral areas | 2 | Grade 2 in layers 2-6; grade 1 in layer 6 |
| Visual areas | 4 | Grade 3 in layer 2/3; grade 4 in layer 4; grade 1 in layer 5; grade 2 in layer 6, posterior > anterior |
| Auditory areas | 4 | Grade 3 in layer 2/3; grade 4 in layer 4; grade 1 in layer 5; grade 2 in layer 6, posterior > anterior |
| Hippocampal formation | ||
| Dentate gyrus | 0 | |
| Cornu ammonis | 1 | Mainly in pyramidal cell layer |
| Subiculum | 2 | Mainly in pyramidal cell layer |
| Fasciola cinereum | 0 | |
| Parahippocampal region | ||
| Presubiculum | 4 | Mainly in layer 2 |
| Parasubiculum | 4 | Mainly in layer 2 |
| Entorhinal cortex | 4 | Mainly in layer 2/3 and 5. Posterior > anterior |
| Perirhinal cortex, area 35 | 2 | Grade 2 in layer 2/3, and 6 |
| Perirhinal cortex, area 36 | 3 | Grade 3 in layer 2/3; grade 2 in layer 4; grade 1 in layer 6; posterior > anterior |
| Olfactory and limbic structures | ||
| Main olfactory bulb | 0 | |
| Accessory olfactory bulb | 0 | |
| Anterior olfactory nucleus | 1 | |
| Taenia tecta | 0 | |
| Dorsal peduncular area | 0 | |
| Nucleus of the lateral olfactory tract | 0 | |
| Piriform area | 3 | Most dense (grade 4) in posterior parts, layer 2/3 |
| Cortical amygdalar area | 2 | |
| Piriform -amygdalar area | 2 | |
| Amygdalar nuclei | 1 | A few scattered cells across most subnuclei although central nucleus devoid of staining |
| Postpiriform transition area | 1 | |
| Endopiriform nucleus | 2 | |
| Basal ganglia | ||
| Claustrum | 1 | |
| Striatum | 1 | Scattered cells. No apparent pattern |
| Pallidum | 1 | Scattered cells. No apparent pattern |
| Thalamus | ||
| Reticular nucleus of the thalamus | 1 | |
| Hypothalamus | 0 | A few scattered cells. No apparent pattern |
| Pons | ||
| Pontine gray | 3 | Distributed in lamellar, external subspace |
| Tegmental reticular nucleus | 2 | |
| Cerebellum | 2 | Asymmetrically distributed clusters mainly in the granular cell layer |
| Medulla oblongata | 1 | Scattered cells. No apparent pattern |
The semi-quantitative scale used to grade density of labeling (from 0 to 4) is illustrated in Fig. 2
We next questioned whether the ectopic expression was unique to the lacZ reporter, and so crossed the Nop-tTA mice with another tet-responsive reporter line expressing GFP as a fusion with the nuclear H2B protein. This reporter displayed more limited expression outside of the entorhinal and subicular regions, however, scattered GFP-positive cells could still be found in relative abundance within certain subregions of the hippocampus and thalamus (Fig. 1b). In both reporters, signal was most intense in the entorhinal cortex, parahippocampal regions, and dorsal isocortex, but also found in visual, somatosensory, and somatomotor cortex. One notable difference between these reporter lines—and which highlights the possibility for two responders to behave differently when crossed to the same driver—is the presence of significant transgene expression in the reticular thalamic nucleus of the Nop-GFP mice that is much less densely stained in the lacZ animals (Fig. 2a, far right vs. Fig. 2b, far right). Because we used native fluorescence to detect GFP in the Nop-GFP mice, we likely observed only the highest expressing cells in this tissue. While the sensitivity of each responder line may affect the extent of ectopic expression observed, we suspect that enzymatic amplification provided by β-galactosidase detection played a significant role in allowing visualization of cells with even low levels of tTA activity.
Recognizing that the extent of transgene expression can impact the interpretation of results from models using the Nop-tTA line, and having Nop-lacZ bigenic animals now available in our colony, we decided to conduct a careful anatomical analysis of reporter expression in this system so that we could offer the histological images for others to use through our open access online portal. The online atlas contains a brainwide series of X-gal-stained coronal and horizontal sections from bigenic reporter mice. Because our initial studies had examined 2.5-month-old male animals (Fig. 1), we elected to do these detailed analyses with older mice and include both sexes so that we could ascertain whether expression was influenced by either age or gender. The coronal samples described below and shown in the atlas include one male (#1952) and one female animal (#2849), each 7–7.5 months of age; the horizontal sample was from a male bigenic harvested at 9 months of age (#2877). Anatomical boundaries of brain regions and subregions were delineated using cytoarchitectonic features visible in the DAPI counterstain included in the mounting medium of sections immunostained for GFP (Fig. 2d), located adjacent to the X-gal tissue shown in the atlas (Fig. 2f). Anatomical boundaries identified from the DAPI section were transferred to the neighboring X-gal-stained section and adjusted to match cytoarchitectonic features visible in the fast red stain. We then used the X-gal stained tissue to conduct a semi-quantitative analysis of the density of β-galactosidase-expressing cells across the brain as described below.
Spatial distribution of X-gal labeling in Nop-lacZ tissue
The pattern of X-gal staining was highly consistent across animals, with one exception that displayed somewhat greater labeling in the entorhinal cortex, visual cortex, and cerebellum. Full documentation of the animals used for analysis is provided in the online tTA atlas (www.rbwb.org).
Isocortex
Frontal parts of the cerebral cortex, including the orbital, somatomotor, and the anterior portion of the anterior cingulate areas (Fig. 3a), as well as the agranular insular, gustatory and visceral areas, displayed low to medium density of X-gal-positive cells. The density of labeled cells increased within the posterior portion of the anterior cingulate and in most somatosensory areas (Fig. 3a, b). Staining was primarily found in layer 2 with scattered positive cells in layers 4 and 6, while layer 5 was largely devoid of labeling (Fig. 3d). The density of labeled cells increased in a steep gradient within the temporal and posterior parts of the cerebral cortex (Fig. 3a, b vs. Figs. 3c, 4b–d). Labeled cells in layer 2/3 formed an almost continuous sheet across the entire parietal, temporal, and occipital regions, including the parietal and temporal association areas (Fig. 4b). Staining was equally dense within neighboring retrosplenial, auditory, and visual areas (Fig. 4c, d).
Fig 3.
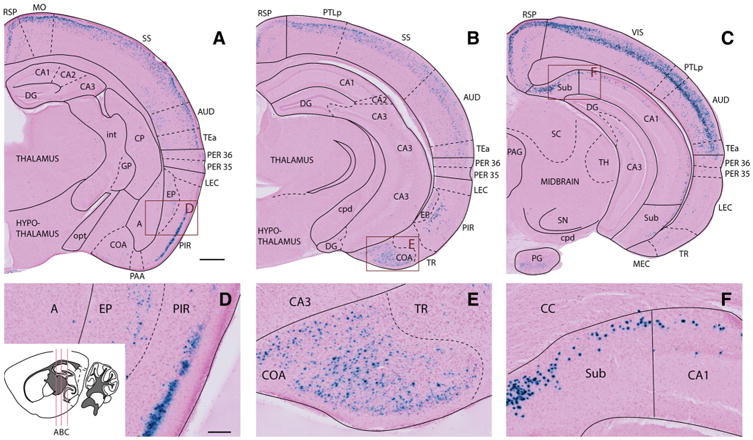
X-gal labeling in the cerebral cortex and anterior hippocampal region. a–c Images from three coronal sections show the distribution of X-gal staining at different levels of the brain from a 7-month-old female Nop-lacZ animal. All images are taken from the right hemisphere at the anterio-posterior levels indicated by the inset illustration (redrawn and modified from the Allen Brain Institute mouse brain atlas). d–f High-magnification images of the boxed areas in (a–c). Images show labeling in layer 2/3 of the piriform cortex (d), the cortical amygdalar nuclei (e), and parts of the subiculum and cornu ammonis subfields of the hippocampus (f). Note the absence of labeling in the lateral entorhinal cortex (LEC) at this level (c). A amygdalar nuclei, AUD auditory area, CA1 cornu ammonis 1, CA2 cornu ammonis 2, CA3 cornu ammonis 3, CC corpus callosum, COA cortical amygdalar area, CP caudoputamen, cpd cerebral peduncle, DG dentate gyrus, EP endopiriform nucleus, GP globus pallidus, int internal capsule, LEC lateral entorhinal cortex, MEC medial entorhi-nal cortex, MO motor areas, opt optic tract, PAA piriform-amygdalar area, PAG periaqueductal gray, PER 35 perirhinal area 35, PER 36 perirhinal area 36, PG pontine gray, PIR piriform area, PTLp posterior parietal association areas, RSP retrosplenial area, SC superior colliculus, SN substantia nigra, SS somatosensory areas, Sub subiculum, TEa temporal association areas, TH thalamus, TR postpiriform transition areas, VIS visual areas. Scale bar 500 μm (a– c), 100 μm (d–f)
Fig 4.
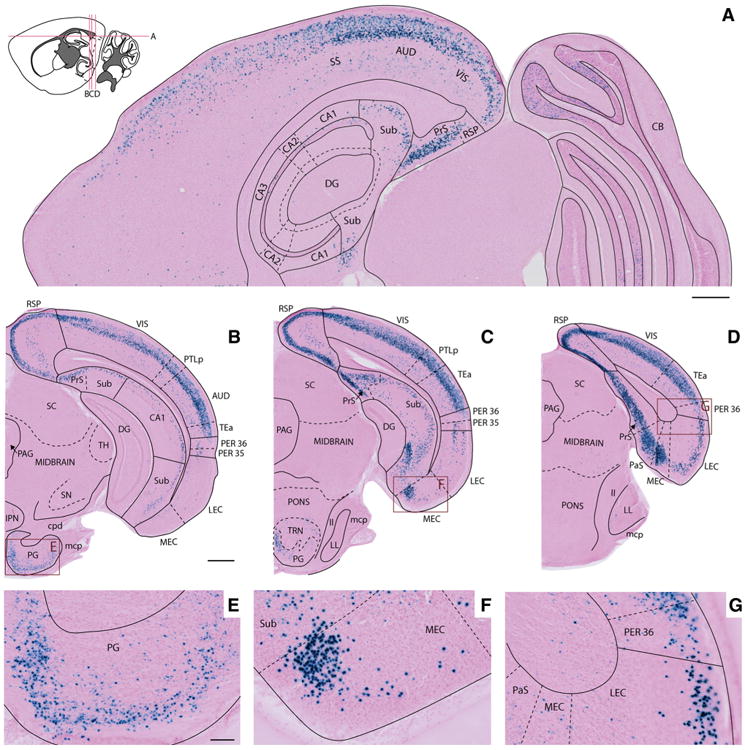
X-gal labeling in cerebral cortex and posterior hippocampal region. a–d Horizontal (a) and coronal sections (b–d) illustrate X-gal staining in a 7-month-old female Nop-lacZ animal at dorsal and posterior levels of the brain. The density of X-gal labeled cells increases from anterior to posterior across the parietal and occipital cerebral cortex (a), the hippocampal region (a–d), and the entorhinal cortex (b–d). e–g High-magnification images of the boxed areas in b– d illustrate labeling in the pontine gray (e), the medial entorhinal cortex close to the subicular boundary (f), and the perirhinal area (g). AUD auditory area, CAi1 cornu ammonis 1, CA2 cornu ammonis 2, CA3 cornu ammonis 3, CB cerebellum, cpd cerebral peduncle, DG dentate gyrus, IPN interpeduncular nucleus, LEC lateral entorhinal cortex, ll lateral lemniscus, LL nucleus of the lateral lemniscus, mcp middle cerebellar peduncle, MEC medial entorhinal cortex, PAG periaqueductal gray, PaS parasubiculum, PER 35 perirhinal area 35, PER 36 perirhinal area 36, PG pontine gray, PrS presubiculum, PTLp posterior parietal association areas, RSP retrosplenial area, SC superior colliculus, SN substantia nigra, SS somatosensory areas, Sub subiculum, TEa temporal association areas, TH thalamus, TRN tegmental reticular nucleus, VIS visual areas. Scale bars a, b– d 500 μm, e–g 100 μm
Hippocampal formation and parahippocampal region
Within the hippocampal formation, labeled cells were primarily observed in the subiculum and to a lesser extent in the pyramidal layer of the CA fields (Figs. 3f, 4a). In the parahippocampal region, localized areas with high densities of labeled cells were seen in layer 2 of the pre- and parasubiculum, and in layers 2/3 and 5 of the dorsomedial entorhinal area (Figs. 4c, d, 5i). Labeling was also found in the perirhinal areas, with greater density in perirhinal area 36 compared to area 35 (Figs. 4d, g, 5f, i). The density of labeling varied considerably within the entorhinal area. We consistently found more labeling in the medial EC relative to the lateral EC, in which labeling was primarily confined to layers 2–3 (Figs. 4d, 5f). The overall pattern of labeling within the parahippocampal region was largely consistent across the three animals investigated, however, one animal (#2849) displayed a higher density of X-gal-positive cells than the other two (Fig. 5h, i). Although the difference was mild, this observation suggests that there may a gender bias in Nop-tTA expression, as signal density was greater in the female animal and lower in the males. Images shown in Figs. 2, 3, 4 are taken from this animal to highlight what we found to be the maximal extent of transgene expression induced with the Nop-tTA driver. Figure 5 contains images from all three animals used in the atlas to illustrate the extent of variation in parahippocampal labeling.
Fig 5.
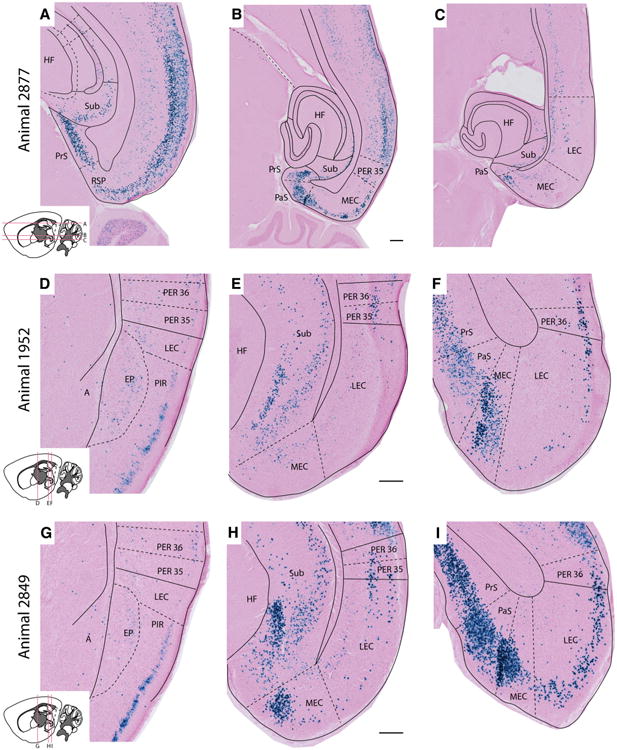
X-gal labeling in the parahippocampal region. Images show the distribution of X-gal staining in the parahippocampal region of three Nop-lacZ mice (two male, one female, 7–9 months of age), prepared as horizontal (a–c), and coronal sections (d–f and g–i). The location of each section is indicated in the inset drawings. The sections illustrate a distinct gradient in the density of X-gal stained cells, increasing from anterior to posterior (a–c, d–f, g–i), and from medial to lateral entorhinal cortex (f, i). A high resolution version of this figure is provided in the online Supplementary Information. A Amygdala, EP endopiriform nucleus, HF hippocampal formation, LEC lateral entorhinal cortex, MEC medial entorhinal cortex, PaS parasubiculum, PER 35 perirhinal area 35, PER 36 perirhinal area 36, PIR piriform cortex, PrS presubiculum, RSP retrosplenial cortex, Sub subiculum. Scale bar 200 μm
Olfactory and limbic structures
In the olfactory bulb, including the main olfactory bulb, accessory olfactory bulb, and anterior olfactory nucleus, widespread but sporadic labeling was observed with no apparent pattern or clustering. In more posterior limbic regions, substantial labeling was found in the piriform area and endopiriform nucleus (Fig. 3d), as well as in the cortical amygdalar area (Fig. 3e). Scattered labeling was also seen in the postpiriform transition area, and in all amygdalar nuclei, excluding the central nucleus (Figs. 3a, 5d, g). Within lateral and basolateral amygdala, approximately 8–15 X-gal-labeled puncta were observed per section, with no anatomical bias apparent in their distribution.
Basal ganglia, thalamus, and hypothalamus
The claustrum, along with the dorsal and ventral striatum, contained low numbers of scattered X-gal-positive cells, while very little or no labeling was found in the internal and external segment of the globus pallidus, subthalamic nucleus, and substantia nigra. A few labeled cells were observed in the ventral tegmental area. The thalamus contained a moderate density of labeled cells specifically within the reticular nucleus (Fig. 3a), while very little labeling was observed in other parts of this region. The hypothalamus contained similarly sparse signal, with only a few labeled cells in the dorsomedial area adjacent to the thalamus (Fig. 3b).
Brain stem, cerebellum and medulla oblongata
In general, the midbrain and brain stem contained very little labeling, with only a few sporadic cells in the periaqueductal gray, trigeminal nuclei, and smaller nuclei of the dorsal and caudal brain stem. Only the pontine nuclei displayed a high density of labeled cells (Fig. 4e). The cerebellum contained several asymmetrically distributed clusters of X-gal-stained cells within the granule layer across the vermis and hemispheres, with sparse signal seen within the molecular layer of the vermis (Fig. 4a).
Spatial distribution of APP and amyloid pathology in Nop-APP animals
We were next curious to examine how this extended distribution of β-galactosidase expression in the Nop-lacZ mice might contribute to the pattern of neuropathology observed in disease models using the Nop-tTA driver. We therefore crossed the Nop-tTA line with a tet-responsive transgenic line expressing the amyloid precursor protein (APP) in which the presence of two familial mutations dramatically increases the production of amyloid β peptide (Aβ). We first examined the expression pattern of transgenic APP obtained in the bigenic offspring using a human-specific anti-APP antibody, and compared the distribution of immunopositive cells with the pattern of X-gal labeling observed in our Nop-lacZ reporter mice (Fig. 6). Consistent with our reporter experiments, regions where transgenic APP was most densely expressed were the same areas where X-gal labeling was strongest, including the MEC, presubiculum, and dorsal anterior cingulate cortex (Fig. 6a, b, and c, respectively). The APP signal was specific for transgenic protein: no APP staining was detected in Nop-tTA single transgenic controls animals (Fig. 6a–f). Regions with less intense APP expression were also consistent with the pattern reported by our Nop-LacZ animals, including the hippocampal CA1 field (Fig. 6d) and retrosplenial cortex (Fig. 6e) where scattered immunopositive cells were found. Conversely, areas devoid of X-gal staining in the Nop-LacZ reporter mice also lacked APP immunostain in the Nop-APP offspring, as illustrated with the lateral septum in Fig. 6f. The Nop-LacZ reporter atlas thus proved to be remarkably accurate in predicting the distribution and density of transgenic APP expression controlled by the Nop-tTA driver line.
Fig 6.
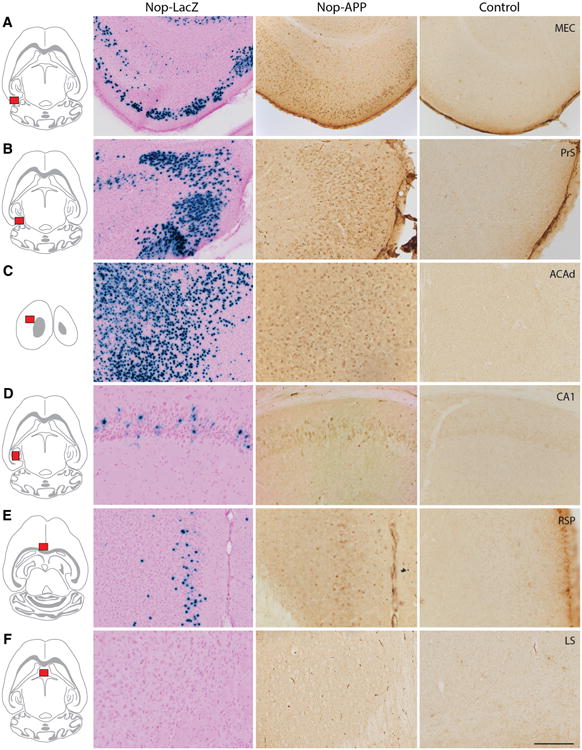
Expression of transgenic APP under control of Nop-tTA matches the pattern of β-galactosidase staining in lacZ reporter mice. Immunostaining for transgenic APP in Nop-APP mice harvested at 6 months of age (middle column) matches the density and pattern of X-gal labeling in Nop-lacZ tissue (left column). Tissue from Nop-tTA single transgenic animals demonstrates that the antibody does not cross react with endogenous mouse APP (right column). a Medial entorhinal cortex. b Presubiculum. c Dorsal anterior cingulate cortex. d Cornu ammonis 1. e Retrosplenial cortex. f Lateral septum. Scale bar 200 μm (a), 100 μm (b–f)
Overexpression of APP leads to the accumulation of Aβ peptide in a time- and concentration-dependent manner, and so we assessed amyloid load in bigenic Nop-APP mice at multiple ages between 9 and 21 months. Because amyloid essentially serves to integrate signal over time, animals of adequate age will develop plaques wherever transgenic APP is present. However, the spatial pattern of amyloid appearance is complicated by the fact that Aβ is released extracellularly—with evidence for both presynaptic (Cirrito et al. 2005; Frykman et al. 2010; Kamal et al. 2001; Lazarov et al. 2002; Sheng et al. 2002) and postsynaptic release (Wei et al. 2009; Westmark et al. 2011; Wu et al. 2011)—resulting in plaque formation both in the vicinity of the APP-expressing cells themselves and in the areas to which their neurites extend.
At 9 months of age, amyloid plaques in the Nop-APP mice were still sparse and found primarily in regions with densest lacZ staining of the reporter crosses, including entorhinal cortex and pre-/parasubiculum (Fig. 7a, sections 3–4). By 15 months of age, amyloid staining in the entorhinal region and pre-/parasubiculum became substantially stronger, consistent with the high density of lacZ signal and APP immunostaining in these regions (Fig. 7b, sections 3–4). However, plaques were also beginning to appear in areas such as the molecular layer of the dentate gyrus and stratum lacunosum moleculare of CA1 where few lacZ cells were located, but where the axonal terminals of entorhinal neurons project via the perforant and temporoammonic pathways (Fig. 7b, sections 3–4). The appearance of amyloid deposits in these regions is entirely consistent with the presynaptic release of Aβ from entorhinal neurons with high levels of transgenic APP (Cirrito et al. 2005; Lazarov et al. 2002; Sheng et al. 2002). By 15 months of age, sparse plaques have also appeared in other layers of hippocampal CA1, including stratum oriens and stratum radiatum, where the apical and basal dendrites of ectopic lacZ-stained and APP-immunopositive CA1 pyramidal neurons are located (Fig. 7b, sections 2–3). Also at this age, amyloid deposits have formed in visual, auditory, and retrosplenial cortex (Fig. 7b, sections 1–2). Each of these areas is synaptically connected to the entorhinal and pre-/parasubiculum, but they are also all locations where moderate lacZ staining was detected in our reporter animals—and where APP immunostaining was detected in younger Nop-APP mice, raising the possibility that delayed pathology here results from low levels of ectopic APP expression rather than (or in addition to) synaptic release from distant APP-expressing cells. By 21 months of age, amyloid has accumulated throughout the neocortex and hippocampal formation, but is markedly less dense in three regions where X-gal staining (and APP immunostain, data not shown) was also largely absent: hippocampal area CA3, striatum, and insular cortex (Fig. 7c, sections 3–4). The converse situation also appears, however, regions such as the orbital cortex and lateral septal nucleus that are densely marked with amyloid (Fig. 7c, sections 3–4), but where little or no lacZ labeling was seen in the reporter animals. The appearance of Aβ deposits in these regions may be readily explained by well-defined axonal connections from regions such as the anterior cingulate, entorhinal, retrosplenial and visual cortices where we detected intense APP immunostaining in these mice and similarly strong X-gal signal in Nop-lacZ reporter animals (Allen Mouse Brain Connectivity Atlas http://connectivity.brain-map.org/, i.e., experiments #112 595376, 298758133, 301263519, and to septum, 11322 6232, 114472145, 125833030, 126862385, 126117554, 127139568, 263974698, 287248684, 307295727, and 307557934 to orbital). We conclude from the comparison of lacZ and APP stains with amyloid histology that much of the pathology in our Nop-APP mice can be explained simply by the release of Aβ from cells expressing the transgene, either in regions adjacent to their soma, or in areas to which their neurites project. In this case, the extent of tTA expression available to drive expression of transgenic APP is sufficient to predict the observed pathology without involving trans-synaptic propagation.
Fig 7.
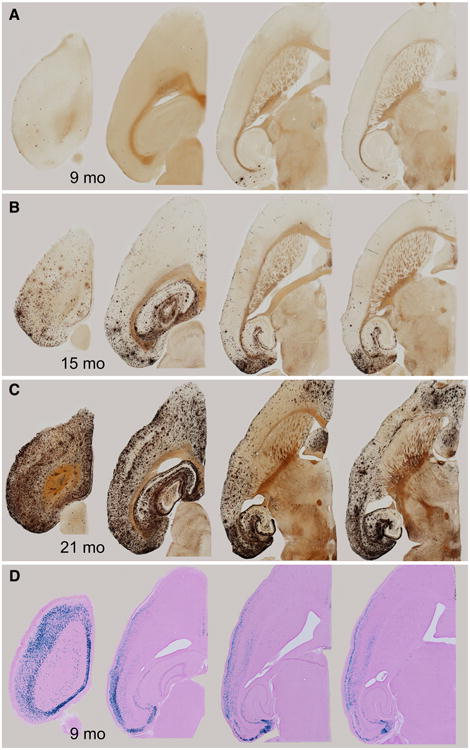
The progression of amyloid pathology in aged Nop-APP mice largely matches the density and pattern of β-galactosidase staining in the Nop-lacZ reporter. a–c Silver staining reveals the expansion of amyloid pathology over time in Nop-APP mice. d Sections from the online atlas showing X-gal staining in Nop-lacZ mice at levels of the brain corresponding to the amyloidstained sections above. A high resolution version of this figure is provided in the online Supplementary Information
Discussion
The Nop-tTA transgenic line has become a widely used tool for experiments seeking to restrict the expression of tTA-responsive genes to the medial temporal lobe (Yasuda and Mayford 2006). In many cases, the specificity of tTA expression is critical to interpretation of the study, making it important to know exactly where the responsive transgene has been induced. Before undertaking extensive studies with this model, we embarked on a standard reporter experiment to confirm the expression pattern produced by this driver line (Mayford et al. 1996). Our findings corroborate the strong signal expected in superficial layers of the medial entorhinal cortex, the pre- and parasubiculum, and the retrosplenial cortex (Yasuda and Mayford 2006). However, our reporter crosses also show that tTA expression in the Nop line can be active well beyond the entorhinal cortex. In our hands, we find that expression was also strongly induced in occipital, temporal and parietal cortical areas, with weaker expression in several other brain regions. Although there were subtle differences between responder lines, the core expression pattern we observed was largely consistent over time, between genders, and across distinct reporter crosses. Because this data may be valuable to other groups now working with this model, we have made our histological images publically available through an online atlas aimed at documenting reporter expression in several commonly used tTA driver lines (www.rbwb.org) (Odeh et al. 2011).
The discrepancy between our results and those of other groups might be accounted for by several factors that are important to consider when developing new models where regional localization is important. Although tet-responsive reporters are readily available (i.e., Jackson Laboratories #8344, tetO-lacZ, tTA (Reijmers et al. 2007), #5104, tetO-HIST1H2BJ/GFP (Tumbar et al. 2004); and #12345, tetO-tdTomato,-Syp/GFP (Li et al. 2010)), few past studies checked the specificity of Nop-tTA expression under their experimental conditions using colorimetric or fluorescent responder lines. Instead, most groups have relied on in situ hybridization, RT-PCR, or immunohistology to detect expression of their tet-responsive mRNA or protein of interest (de Calignon et al. 2012; Harris et al. 2010; Liu et al. 2012; Rowland et al. 2013). These methods depend on the sensitivity of the detection reagent, whether they are epitopespecific antibodies, DNA primers, or RNA probes, to reveal transgene expression and may underreport in weakly positive cells.
Although age has been noted to influence expression pattern of some transgenic promoters, it is unlikely to account for the cortical expansion observed here. We detected the same degree of X-gal signal outside the entorhinal cortex in mice harvested at 2.5 months of age as at 9 months. The opposite phenomenon—age-dependent restriction of expression activity—has been described for two well-characterized Cre transgenic reporter lines, and was found to result from DNA methylation of the transgene promoter (Long and Rossi 2009). Trans-generational epigenetic modifications can also alter somatic transgene expression patterns, both in zebrafish (Akitake et al. 2011) and in mice (Swain et al. 1987). As Swain and colleagues discovered in their early work to introduce a plasmacytoma construct into the mouse genome, their transgene was expressed only when transmitted through the paternal line. Maternal transmission led to epigenetic silencing of the inserted locus in all of the resulting progeny. Thus, the heritage of a foreign genomic element can influence its expression pattern in the offspring.
However, we believe the most likely explanation for the observed differences in expression of the Nop-tTA line is a change in the strain background on which the transgene is expressed. Strain background is well known to affect the phenotype of transgenic lines (Han et al. 2012; Hsiao et al. 1995; Lehman et al. 2003; Metz et al. 2006; Morimoto and Kopan 2009; Rose-Hellekant et al. 2002; Strong et al. 2012), and has also been shown to alter transgene expression pattern and intensity (Opsahl et al. 2002; Raineri et al. 2001; Robertson et al. 2002). Particularly relevant to our current study, Robertson and colleagues found that the density of labeled oligodendrocytes in Pmp22-tTA × tetO-lacZ offspring roughly doubled when the hybrid B6CBA driver line was backcrossed for just 2 generations to parental CBA/Ca strain. In the original characterization of Nop-tTA, Yasuda and Mayford screened expression in F1 offspring of the hybrid B6DBA founders and again after backcrossing for one generation to C57BL/6 (M. Yasuda, personal communication). At this stage of the backcross, tTA expression was still limited to the MEC and pre-/parasubiculum. However, by the time we tested this line, it had been backcrossed to C57BL/6 for at least 3 generations in San Diego and an additional 3 generations in Houston. After more than 6 generations, the remaining genomic contribution from DBA had been reduced to less than 2 %. Thus, the genetic background we tested was considerably different from when the line was last characterized at N2. Given the known influence of strain background on transgenic phenotypes and expression patterns, this factor seems the best explanation for the expanded tTA activity we observe.
Regardless of the reason, our findings suggest that whenever spatial localization is important, transgene expression should be tested with well-characterized reporters prior to use. Ideally, this should be done on the same strain background and at the same age that will be studied experimentally. If the potential for transient expression during development would confound interpretation of the intended experiment, this too should be examined. But clearly where spatial restriction or precise temporal onset is required by the experimental design, there should be some means of demonstrating this condition is met. As shown here, we find reasonable agreement in the overall pattern of staining observed in our reporter crosses, and remarkable concordance between the pattern of reporter signal and the expression of our experimental APP transgene. Although there is some animal-to-animal variability in the density of labeled cells within selected brain regions, these differences were limited by the use of driver and reporter lines that had been made congenic on a single strain background. In this case, fewer animals need be studied to get a sense of the expression boundaries (on order of n ≥ 3). Expression on hybrid strains can be considerably more variable, requiring a larger sample size to assess the potential range (perhaps on order of n ≥ 10) (Furuta and Behringer 2005; Furuta et al. 2000; Robertson et al. 2002). While the use of such reporters does not substitute for the inclusion of an identifiable label in the experimental transgene itself (i.e., tags such as myc, His6, or HA, or linked reporter genes using a viral 2A fusion or internal ribosome entry site, [but see (Previtali et al. 2000; Vecchio et al. 2014)], they do provide a useful estimate of the spatial distribution—and variability—that might be expected under similar conditions.
The ectopic expression that we observe in the Nop-tTA mice could have significant ramifications for several past studies that relied on this mouse to restrict expression within the entorhinal cortex. The most notable are several papers in which the Nop-tTA line was used to test the potential for trans-synaptic spread of pathological protein aggregates in mouse models of Alzheimer's disease (de Calignon et al. 2012; Harris et al. 2010; Liu et al. 2012). These studies used the Nop-tTA line to drive expression of mutant amyloid precursor protein (APP) or microtubule-associated protein tau (MAPT) within the MEC, and then tested for the presence of hallmark aggregates from these proteins in synaptically connected target regions. All three studies described pathological forms of the transgenic protein in the MEC, followed several months later by their appearance in DG (the immediate synaptic target of layer II MEC), and in CA1 (the immediate synaptic target of layer III MEC). At still later ages, pathological aggregates were noted in cortical areas connected farther downstream in the circuit. The sequential timing of aggregate formation first in MEC followed by DG/hippocampus and then cortex suggested that the pathological proteins were being trans-synaptically propagated from the site of production in MEC to anatomical targets one or more synapses forward in the circuit. Definitive proof of trans-synaptic spread requires strict limitation of transgenic APP or MAPT to the EC. Our findings suggest that the Nop-tTA line may not meet this requirement.
The spatiotemporal pattern of amyloid staining we present here recapitulates and extends Harris et al.'s (2010) analysis of Nop-tTA-controlled APP expression, using the same driver and responder lines as their original study. We have also employed the same human-specific antibody to examine the distribution of transgenic APP in our Nop-APP mice as they had used. Remarkably, the pattern of transgenic APP immunostaining we observe is nearly identical to what they had reported—including the location and density of tTA-dependent APP expression outside the EC. Moreover, the distribution of transgene-positive cells in both sets of Nop-APP mice mirrors that of our Nop-LacZ reporter animals. Consistent with our findings, Harris et al. described sparse transgene-positive cells in CA1 and throughout the neocortex well beyond entorhinal. Recognizing this, Harris et al. were careful to refer to the transgene expression in their Nop-APP mice as being “predominantly in the EC.” Transgenic APP was notably absent from the dentate gyrus, suggesting that the Aβ deposits Harris et al. found there at 13 months of age had been released from presynaptic terminals of APP-expressing entorhinal neurons. Our findings in 15-month-old mice are essentially identical—we saw no APP immunostaining in the dentate gyrus, and concur that Aβ deposits found in the molecular layer likely arose from the perforant path. Harris et al. do not suggest—nor does our data support—the idea that Aβ is taken up by the postsynaptic cell to be propagated through the hippocampal circuit. They instead posit that neural dysfunction is propagated trans-synaptically, initially through the direct effect of Aβ released onto postsynaptic cells, and subsequently through the indirect effect that the resulting impairment would have on neurons farther along the circuit. By contrast, Aβ accumulation may be limited to the site where it is produced and the terminal field where it is synaptically released. Indeed, our data suggest that the spatial pattern of amyloid formation in Nop-APP mice can be explained by the regional density of APP-expressing cells and the areas to which those neurons directly project, and the temporal pattern governed by the local concentration of Aβ within those regions.
The more interesting case is that of MAPT models, where true trans-synaptic propagation of pathological tau aggregates has been proposed based on experiments using the Nop-tTA mouse line (de Calignon et al. 2012; Liu et al. 2012). In both these studies, hyperphosphorylated tau consistent with immature neurofibrillary tangles—followed by silver- and thioflavine-positive mature tangles—were detected in the EC, as expected from the expression of transgenic tau in this region. However, as the Nop-MAPT mice aged, markers for immature and then mature tangles subsequently appeared in synaptically connected neurons of the dentate gyrus. Both de Calignon et al. and Liu et al. reported transgenic protein and mRNA expression limited to the EC and pre-/parasubiculum, consistent with the conclusion that some form of transgenic tau was transmitted through the perforant path into downstream granule neurons. Indeed, our own reporter crosses show just a few granule neurons stained with lacZ, far fewer than the number of granule cells affected by tau aggregation. However, transgene expression in the tet-off system is dependent on both the driver and the responder line. Using laser-capture microscopy to measure human tau mRNA in dentate granule neurons from Nop-MAPT mice, Liu et al. report that they consistently detected a low level of transgene expression suggesting the possibility of ‘leak’ in the system. In this case, the leak may not have been solely due to the Nop-tTA driver: subsequent work from Harris et al. (2012) revealed tTA-independent expression of human tau protein in granule neurons of single transgenic tetO-MAPT mice. To be sure, the level of tau staining observed in single transgenic controls never reached the intensity or number of tau-positive cells seen in aged bigenic animals, but the existence of poorly restricted expression in both the driver and responder lines raises the possibility that leak rather than (or in addition to) trans-synaptic spread could have contributed to the result. In their defense, however, subsequent studies provide mounting evidence for neuronal release of tau into the extracellular space (Yamada et al. 2014), and for neuronal uptake of exogenous tau aggregates (Sanders et al. 2014), consistent with the concept of trans-synaptic propagation in vivo.
Although our findings provide an alternative perspective on previous work with the Nop-tTA line, our main goal was to inform future studies. No transgenic driver is perfectly restricted in space or time, and researchers must recognize these limitations and within those boundaries choose their tools and their experimental questions with care. We believe that online atlases like the one expanded here can help to guide these decisions (Boy et al. 2006; Odeh et al. 2011), especially when used with complementary tools such as the Allen Brain Atlas, GENSAT, and Cre-line databases (Gong et al. 2007; Taniguchi et al. 2011). These public access resources will increasingly play a role in neuroscientific research, as groups begin to probe anatomical and functional relationships between regions of the central nervous system at even greater levels of refinement. The expression patterns reported in this atlas are not immutable—they can and likely will differ slightly depending on the exact experimental conditions. However, for cases where strict localization is critical to interpretation, reporter atlases such as ours can indicate whether there is a reasonable possibility for expression outside the desired region, so that necessary precautions are taken in designing the experiments—or finding an alternate driver. To this end, we hope to expand the tTA database with additional driver lines in hopes that other groups may benefit from what we have learned working with these models.
Supplementary Material
Acknowledgments
We thank Bryan Song and Yuanyuan Zhang for outstanding animal care, Nirao Shah for methodological advice on X-gal staining, Mark Mayford for sharing the Nop-tTA, tetO-lacZ, and tetO-H2B-GFP lines, Masahiro Yasuda for sharing methodological details of the original Nop-tTA characterization, Dimitri Darine and Gergely Csucs for expert technical assistance with the online atlas application, and Thorsten Schmidt for valuable discussion on phenotypic variation due to genetic drift. Histological section images were acquired at the Norbrain Slidescanning Facility at the Institute of Basic Medical Sciences, University of Oslo. Funding for this work was provided by NIH (DP2 OD001734, and T32 AG000183), The Research Council of Norway (214842; and NORBRAIN, The Norwegian Large Scale Infrastructure for Brain Research), The European Commission (The Human Brain Project, 604102), and Uninett Sigma.
Abbreviations
- AD
Alzheimer's disease
- APP
Amyloid precursor protein
- CA
Cornu ammonis
- EC
Entorhinal cortex
- GFP
Green fluorescent protein
- Nop
Neuropsin
- tetO
Tet operator
- tTA
Tetracycline transactivator
Footnotes
Conflict of interest The authors declare no conflict of interest.
References
- Akitake CM, Macurak M, Halpern ME, Goll MG. Transgenerational analysis of transcriptional silencing in zebrafish. Dev Biol. 2011;352:191–201. doi: 10.1016/j.ydbio.2011.01.002. [DOI] [PMC free article] [PubMed] [Google Scholar]
- Bjaalie JG, Leergaard TB. Three-dimensional computerized reconstruction from serial sections: cell populations, regions, and whole brain. In: Zaborszky L, Wouterlood FG, Lanciego JL, editors. Neuroanatomical tract tracing: molecules, neurons and systems. 3rd. Springer/Kluwer/Plenum; 2006. pp. 530–565. [Google Scholar]
- Bjaalie JG, Leergaard TB, Lillehaug S, Odeh F, Moene IA, Kjode JO, Darin D. Database and tools for analysis of topographic organization and map transformations in major projection systems of the brain. Neuroscience. 2005;136:681–695. doi: 10.1016/j.neuroscience.2005.06.036. [DOI] [PubMed] [Google Scholar]
- Boy J, et al. Expression mapping of tetracycline-responsive prion protein promoter: digital atlasing for generating cell-specific disease models. NeuroImage. 2006;33:449–462. doi: 10.1016/j.neuroimage.2006.05.055. [DOI] [PubMed] [Google Scholar]
- Braak H, Braak E. Neuropathological stageing of Alzheimer-related changes. Acta Neuropathol (Berl) 1991;82:239–259. doi: 10.1007/BF00308809. [DOI] [PubMed] [Google Scholar]
- Canto CB, Wouterlood FG, Witter MP. What does the anatomical organization of the entorhinal cortex tell us? Neural Plast. 2008;2008:381243. doi: 10.1155/2008/381243. [DOI] [PMC free article] [PubMed] [Google Scholar]
- Cirrito JR, et al. Synaptic activity regulates interstitial fluid amyloid-beta levels in vivo. Neuron. 2005;48:913–922. doi: 10.1016/j.neuron.2005.10.028. [DOI] [PubMed] [Google Scholar]
- de Calignon A, et al. Propagation of tau pathology in a model of early Alzheimer's disease. Neuron. 2012;73:685–697. doi: 10.1016/j.neuron.2011.11.033. [DOI] [PMC free article] [PubMed] [Google Scholar]
- Franklin KBJ, Paxinos G. The mouse brain in stereotaxic coordinates. 3rd. Academic Press; San Diego: 2008. [Google Scholar]
- Frykman S, et al. Synaptic and endosomal localization of active gamma-secretase in rat brain. PloS One. 2010;5:e8948. doi: 10.1371/journal.pone.0008948. [DOI] [PMC free article] [PubMed] [Google Scholar]
- Furuta Y, Behringer RR. Recent innovations in tissue-specific gene modifications in the mouse. Birth Defects Res C Embryo Today. 2005;75:43–57. doi: 10.1002/bdrc.20036. [DOI] [PubMed] [Google Scholar]
- Furuta Y, Lagutin O, Hogan BL, Oliver GC. Retina- and ventral forebrain-specific Cre recombinase activity in transgenic mice. Genesis. 2000;26:130–132. [PubMed] [Google Scholar]
- Gong S, Doughty M, Harbaugh CR, Cummins A, Hatten ME, Heintz N, Gerfen CR. Targeting Cre recombinase to specific neuron populations with bacterial artificial chromosome constructs. J Neurosci. 2007;27:9817–9823. doi: 10.1523/JNEUROSCI.2707-07.2007. [DOI] [PMC free article] [PubMed] [Google Scholar]
- Han HJ, et al. Strain background influences neurotoxicity and behavioral abnormalities in mice expressing the tetracycline transactivator. J Neurosci. 2012;32:10574–10586. doi: 10.1523/JNEUROSCI.0893-12.2012. [DOI] [PMC free article] [PubMed] [Google Scholar]
- Harris JA, et al. Transsynaptic progression of amyloid-β-induced neuronal dysfunction within the entorhinal-hippocampal network. Neuron. 2010;68:428–441. doi: 10.1016/j.neuron.2010.10.020. [DOI] [PMC free article] [PubMed] [Google Scholar]
- Harris JA, et al. Human P301L-mutant tau expression in mouse entorhinal-hippocampal network causes tau aggregation and presynaptic pathology but no cognitive deficits. PLoS One. 2012;7:e45881. doi: 10.1371/journal.pone.0045881. [DOI] [PMC free article] [PubMed] [Google Scholar]
- Hsiao KK, et al. Age-related CNS disorder and early death in transgenic FVB/N mice overexpressing Alzheimer amyloid precursor proteins. Neuron. 1995;15:1203–1218. doi: 10.1016/0896-6273(95)90107-8. [DOI] [PubMed] [Google Scholar]
- Jankowsky JL, et al. Persistent amyloidosis following suppression of Aβ production in a transgenic model of Alzheimer's disease. PLoS Med. 2005;2:e355. doi: 10.1371/journal.pmed.0020355. [DOI] [PMC free article] [PubMed] [Google Scholar]
- Kamal A, Almenar-Queralt A, LeBlanc JF, Roberts EA, Goldstein LS. Kinesin-mediated axonal transport of a membrane compartment containing beta-secretase and presenilin-1 requires APP. Nature. 2001;414:643–648. doi: 10.1038/414643a. [DOI] [PubMed] [Google Scholar]
- Kjonigsen LJ, Leergaard TB, Witter MP, Bjaalie JG. Digital atlas of anatomical subdivisions and boundaries of the rat hippocampal region. Frontiers in neuroinformatics. 2011;5:2. doi: 10.3389/fninf.2011.00002. [DOI] [PMC free article] [PubMed] [Google Scholar]
- Lazarov O, Lee M, Peterson DA, Sisodia SS. Evidence that synaptically released beta-amyloid accumulates as extracellular deposits in the hippocampus of transgenic mice. J Neurosci. 2002;22:9785–9793. doi: 10.1523/JNEUROSCI.22-22-09785.2002. [DOI] [PMC free article] [PubMed] [Google Scholar]
- Lehman EJ, et al. Genetic background regulates beta-amyloid precursor protein processing and beta-amyloid deposition in the mouse. Hum Mol Genet. 2003;12:2949–2956. doi: 10.1093/hmg/ddg322. [DOI] [PubMed] [Google Scholar]
- Li L, Tasic B, Micheva KD, Ivanov VM, Spletter ML, Smith SJ, Luo L. Visualizing the distribution of synapses from individual neurons in the mouse brain. PloS One. 2010;5:e11503. doi: 10.1371/journal.pone.0011503. [DOI] [PMC free article] [PubMed] [Google Scholar]
- Liu L, Drouet V, Wu JW, Witter MP, Small SA, Clelland C, Duff K. Trans-synaptic spread of tau pathology in vivo. PloS One. 2012;7:e31302. doi: 10.1371/journal.pone.0031302. [DOI] [PMC free article] [PubMed] [Google Scholar]
- Long MA, Rossi FM. Silencing inhibits Cre-mediated recombination of the Z/AP and Z/EG reporters in adult cells. PloS One. 2009;4:e5435. doi: 10.1371/journal.pone.0005435. [DOI] [PMC free article] [PubMed] [Google Scholar]
- Mayford M, Baranes D, Podsypanina K, Kandel ER. The 3′-untranslated region of CaMKII alpha is a cis-acting signal for the localization and translation of mRNA in dendrites. Proc Natl Acad Sci USA. 1996;93:13250–13255. doi: 10.1073/pnas.93.23.13250. [DOI] [PMC free article] [PubMed] [Google Scholar]
- Metz AV, Chynoweth J, Allan AM. Influence of genetic background on alcohol drinking and behavioral phenotypes of 5-HT3 receptor over-expressing mice. Pharmacol Biochem Behav. 2006;84:120–127. doi: 10.1016/j.pbb.2006.04.016. [DOI] [PubMed] [Google Scholar]
- Moene IA, Subramaniam S, Darin D, Leergaard TB, Bjaalie JG. Toward a workbench for rodent brain image data: systems architecture and design. Neuroinformatics. 2007;5:35–58. doi: 10.1385/ni:5:1:35. [DOI] [PubMed] [Google Scholar]
- Morimoto M, Kopan R. rtTA toxicity limits the usefulness of the SP-C-rtTA transgenic mouse. Dev Biol. 2009;325:171–178. doi: 10.1016/j.ydbio.2008.10.013. [DOI] [PMC free article] [PubMed] [Google Scholar]
- Odeh F, Leergaard TB, Boy J, Schmidt T, Riess O, Bjaalie JG. Atlas of transgenic Tet-Off Ca2+/calmodulin-dependent protein kinase II and prion protein promoter activity in the mouse brain. Neuroimage. 2011;54:2603–2611. doi: 10.1016/j.neuroimage.2010.11.032. [DOI] [PubMed] [Google Scholar]
- Opsahl ML, McClenaghan M, Springbett A, Reid S, Lathe R, Colman A, Whitelaw CB. Multiple effects of genetic background on variegated transgene expression in mice. Genetics. 2002;160:1107–1112. doi: 10.1093/genetics/160.3.1107. [DOI] [PMC free article] [PubMed] [Google Scholar]
- Previtali SC, et al. Epitope-tagged P(0) glycoprotein causes Charcot-Marie-Tooth-like neuropathy in transgenic mice. J Cell Biol. 2000;151:1035–1046. doi: 10.1083/jcb.151.5.1035. [DOI] [PMC free article] [PubMed] [Google Scholar]
- Querfurth HW, LaFerla FM. Alzheimer's disease. N Engl J Med. 2010;362:329–344. doi: 10.1056/NEJMra0909142. [DOI] [PubMed] [Google Scholar]
- Raineri I, Carlson EJ, Gacayan R, Carra S, Oberley TD, Huang TT, Epstein CJ. Strain-dependent high-level expression of a transgene for manganese superoxide dismutase is associated with growth retardation and decreased fertility. Free Radic Biol Med. 2001;31:1018–1030. doi: 10.1016/s0891-5849(01)00686-4. [DOI] [PubMed] [Google Scholar]
- Reijmers LG, Perkins BL, Matsuo N, Mayford M. Localization of a stable neural correlate of associative memory. Science. 2007;317:1230–1233. doi: 10.1126/science.1143839. [DOI] [PubMed] [Google Scholar]
- Robertson A, Perea J, Tolmachova T, Thomas PK, Huxley C. Effects of mouse strain, position of integration and tetracycline analogue on the tetracycline conditional system in transgenic mice. Gene. 2002;282:65–74. doi: 10.1016/s0378-1119(01)00793-4. [DOI] [PubMed] [Google Scholar]
- Rose-Hellekant TA, Gilchrist K, Sandgren EP. Strain background alters mammary gland lesion phenotype in transforming growth factor-alpha transgenic mice. Am J Pathol. 2002;161:1439–1447. doi: 10.1016/s0002-9440(10)64419-7. [DOI] [PMC free article] [PubMed] [Google Scholar]
- Rowland DC, Weible AP, Wickersham IR, Wu H, Mayford M, Witter MP, Kentros CG. Transgenically targeted rabies virus demonstrates a major monosynaptic projection from hippocampal area CA2 to medial entorhinal layer II neurons. J Neurosci. 2013;33:14889–14898. doi: 10.1523/JNEUROSCI.1046-13.2013. [DOI] [PMC free article] [PubMed] [Google Scholar]
- Sanders DW, et al. Distinct tau prion strains propagate in cells and mice and define different tauopathies. Neuron. 2014;82:1271–1288. doi: 10.1016/j.neuron.2014.04.047. [DOI] [PMC free article] [PubMed] [Google Scholar]
- Schwarcz R, Witter MP. Memory impairment in temporal lobe epilepsy: the role of entorhinal lesions. Epilepsy Res. 2002;50:161–177. doi: 10.1016/s0920-1211(02)00077-3. [DOI] [PubMed] [Google Scholar]
- Sheng JG, Price DL, Koliatsos VE. Disruption of corticocortical connections ameliorates amyloid burden in terminal fields in a transgenic model of Abeta amyloidosis. J Neurosci. 2002;22:9794–9799. doi: 10.1523/JNEUROSCI.22-22-09794.2002. [DOI] [PMC free article] [PubMed] [Google Scholar]
- Strong MK, Southwell AL, Yonan JM, Hayden MR, Macgregor GR, Thompson LM, Steward O. Age-Dependent Resistance to Excitotoxicity in Htt CAG140 Mice and the Effect of Strain Background. J Huntingtons Dis. 2012;1:221–241. doi: 10.3233/JHD-129005. [DOI] [PMC free article] [PubMed] [Google Scholar]
- Swain JL, Stewart TA, Leder P. Parental legacy determines methylation and expression of an autosomal transgene: a molecular mechanism for parental imprinting. Cell. 1987;50:719–727. doi: 10.1016/0092-8674(87)90330-8. [DOI] [PubMed] [Google Scholar]
- Taniguchi H, et al. A resource of Cre driver lines for genetic targeting of GABAergic neurons in cerebral cortex. Neuron. 2011;71:995–1013. doi: 10.1016/j.neuron.2011.07.026. [DOI] [PMC free article] [PubMed] [Google Scholar]
- Tumbar T, Guasch G, Greco V, Blanpain C, Lowry WE, Rendl M, Fuchs E. Defining the epithelial stem cell niche in skin. Science. 2004;303:359–363. doi: 10.1126/science.1092436. [DOI] [PMC free article] [PubMed] [Google Scholar]
- Urlinger S, Baron U, Thellmann M, Hasan MT, Bujard H, Hillen W. Exploring the sequence space for tetracycline-dependent transcriptional activators: novel mutations yield expanded range and sensitivity. Proc Natl Acad Sci USA. 2000;97:7963–7968. doi: 10.1073/pnas.130192197. [DOI] [PMC free article] [PubMed] [Google Scholar]
- Vecchio LM, Bermejo MK, Beerepoot P, Ramsey AJ, Salahpour A. N-terminal tagging of the dopamine transporter impairs protein expression and trafficking in vivo. Mol Cell Neurosci. 2014;61:123–132. doi: 10.1016/j.mcn.2014.05.007. [DOI] [PMC free article] [PubMed] [Google Scholar]
- Wei W, Nguyen LN, Kessels HW, Hagiwara H, Sisodia S, Malinow R. Amyloid beta from axons and dendrites reduces local spine number and plasticity. Nat Neurosci. 2009 doi: 10.1038/nn.2476. [DOI] [PMC free article] [PubMed] [Google Scholar]
- Westmark CJ, et al. Reversal of fragile X phenotypes by manipulation of AβPP/Aβ levels in Fmr1KO mice. PLoS One. 2011;6:e26549. doi: 10.1371/journal.pone.0026549. [DOI] [PMC free article] [PubMed] [Google Scholar]
- Witter MP. The hippocampus. In: Paxinos G, Puelles L, Watson C, editors. The mouse nervous system. Academic Press; San Diego: 2011. pp. 112–139. [Google Scholar]
- Wu J, et al. Arc/Arg3.1 regulates an endosomal pathway essential for activity-dependent β-amyloid generation. Cell. 2011;147:615–628. doi: 10.1016/j.cell.2011.09.036. [DOI] [PMC free article] [PubMed] [Google Scholar]
- Yamada K, et al. Neuronal activity regulates extracellular tau in vivo. J Exp Med. 2014;211:387–393. doi: 10.1084/jem.20131685. [DOI] [PMC free article] [PubMed] [Google Scholar]
- Yasuda M, Mayford MR. CaMKII activation in the entorhinal cortex disrupts previously encoded spatial memory. Neuron. 2006;50:309–318. doi: 10.1016/j.neuron.2006.03.035. [DOI] [PubMed] [Google Scholar]
- Yasuda M, Johnson-Venkatesh EM, Zhang H, Parent JM, Sutton MA, Umemori H. Multiple forms of activity-dependent competition refine hippocampal circuits in vivo. Neuron. 2011;70:1128–1142. doi: 10.1016/j.neuron.2011.04.027. [DOI] [PMC free article] [PubMed] [Google Scholar]
Associated Data
This section collects any data citations, data availability statements, or supplementary materials included in this article.