

Abstract
Myotonic Dystrophy 1 (DM1) is a genetic disease caused by expansion of CTG repeats in DNA. Once transcribed, these repeats form RNA hairpins with repeating 1×1 nucleotide UU internal loop motifs, r(CUG)n, which attract muscleblind-like 1 (MBNL1) protein leading to the disease. In DM1 CUG can be repeated thousands of times, so these structures are intractable to characterization using structural biology. However, inhibition of MBNL1-r(CUG)n binding requires a detailed analysis of the 1×1 UU internal loops. In this contribution we employ regular and umbrella sampling molecular dynamics (MD) simulations to describe the structural and thermodynamic properties of 1×1 UU internal loops. Calculations were run on a reported crystal structure and a designed system, which mimics an infinitely long RNA molecule with continuous CUG repeats. Two-dimensional (2D) potential of mean force (PMF) surfaces were created by umbrella sampling, and the discrete path sampling (DPS) method was utilized to investigate the energy landscape of 1×1 UU RNA internal loops, revealing that 1×1 UU base pairs are dynamic and strongly prefer the anti–anti conformation. Two 2D PMF surfaces were calculated for the 1×1 UU base pairs, revealing several local minima and three syn–anti ↔ anti–anti transformation pathways. Although at room temperature the syn–anti ↔ anti–anti transformation is not observed on the MD time scale, one of these pathways dominates the dynamics of the 1×1 UU base pairs in temperature jump MD simulations. This mechanism has now been treated successfully using the DPS approach. Our results suggest that local minima predicted by umbrella sampling calculations could be stabilized by small molecules, which is of great interest for future drug design. Furthermore, distorted GC/CG conformations may be important in understanding how MBNL1 binds to RNA CUG repeats. Hence we provide new insight into the dynamic roles of RNA loops and their contributions to presently incurable diseases.
Introduction
Repeat expansion disorders are caused by mutations in DNA where repeats in certain genes become expanded. Once the repeats are transcribed, mRNA (mRNA) folds into a hairpin with repeating internal loop motifs, which can be translated into toxic proteins or sequester proteins and cause disease.1,2 The mechanisms by which these repeats expand are not fully known. One hypothesis is that formation of non-B-form conformations by the repetitive DNA sequences, such as hairpins, is the reason for the expansion during DNA replication and repair.3−5 In the expansions of CAG repeats, which are typically found in the coding regions of mRNAs such as Huntingtin (HTT), androgen receptor (AR), spinocerebellar ataxia (SCA), and atrophin-1 (ATN1) genes, the transcripts are translated into toxic polyglutamine (polyQ)6 proteins, resulting in Huntington’s disease (HD), Spinal and Bulbar Muscular Atrophy (SBMA), Spinocerebellar Ataxia Type 1 (SCA1), and Dentatorubral-pallidoluysian atrophy (DRPLA), respectively.7−12 Furthermore, it has been shown recently that RNA CAG repeat expansions can sequester proteins and contribute to neurodegeneration.13−15 Another genetic disorder, Friedreich’s ataxia (FRDA), is caused by expansion of GAA repeats.9,16 A common heritable form of mental retardation, Fragile X-associated tremor ataxia syndrome (FXTAS), is caused by expansion of the CGG segment from 50 to 200 repeats in the 5′-untranslated region (UTR) of the fragile X mental retardation 1 (FMR1) gene.7,16−23 Once the FMR1 gene is transcribed into mRNA, the expanded CGG repeats fold into a hairpin structure with repeating 1×1 GG internal loops that sequester and inactivate Sam68 protein.
Myotonic dystrophy (DM) is another genetic disease that is the most common adult-onset form of muscular dystrophy. DM is a neuromuscular disorder that is characterized by muscle weakness and slow relaxation of muscles after contraction.7,24 It is caused by expansion of CTG and CCTG repeats in DNA,7,24 with CTG leading to myotonic dystrophy type 1 (DM1) and CCTG to type 2 (DM2). In both DM1 and DM2, once the trinucleotide CTG in the 3′-UTR of the dystrophia myotonica protein kinase (DMPK) gene and the tetranucleotide CCTG repeats in the zinc-finger 9 (ZNF9) gene are transcribed, the CUG and CCUG repeats fold into RNA hairpins with repeating 1×1 UU and 2×2 CU/UC internal loop motifs, respectively,25 attracting muscleblind-like 1 (MBNL1)26−29 or cytoplasmic multiprotein complexes30,31 that cause, for example, muscle chloride channel dysfunction32,33 and abnormal regulation of insulin receptors.34 Because the expanded RNA repeats are in the noncoding regions the diseases are caused by RNA gain-of-function.7,20,21 Even though the disease mechanisms described above are the most well established ones, expanded RNA repeats might play other roles in the cell. As an example, expanded repeats in UTRs are translated via a repeat associated non-ATG translation.35
The crystal structures of model RNA molecules containing CUG repeats have been determined before by different groups using X-ray diffraction methods.36−39 In addition, an NMR structure of a single copy of the DM1 motif was characterized that displayed an overall A-form structure.40 Even though all these structures show 1×1 UU internal loops in anti–anti conformations, large amplitude motions in RNA internal loops could not be investigated with the current experimental methods. The conformations that RNA CUG repeats adopt upon protein or small molecule binding require a better understanding of these motions. Helical stacking ↔ unstacking and syn ↔ anti transformation of uridines in 1×1 UU base pairs are two such important large scale motions that have significance in small molecule–RNA binding. Various groups have designed and published small molecules and ligands targeting RNA CUG repeats,41−46 but at present there is no experimental structure available that reports the atomistic details of a small molecule bound to RNA CUG repeats. Thus, the structural and thermodynamic properties of 1×1 UU base pairs in RNA CUG repeats are of significant interest, since they may provide insight into the conformations that these repeats adopt upon interaction with proteins or small molecules.42,47
We recently analyzed the properties of 1×1 AA internal loops seen in RNA CAG repeat expansions. The crystal structure of a model RNA with three CAG repeats, r[5′UUGGGC(CAG)3GUCC]2, was found to exhibit terminal 1×1 AA base pairs in syn–anti conformations with the middle 1×1 AA base pair anti–anti.48 The terminal AA base pairs interact with dangling uridine bases, stabilizing the syn–anti conformational state. The results basically indicated that a dynamic base pair such as 1×1 AA internal loops could transform to another conformation upon interacting with a molecule. Thus, we utilized umbrella sampling MD simulations to predict the 2D free energy surface for 1×1 AA internal loops to investigate the potential stable conformations and transformation pathways.48 In line with the experimental results, the 2D free energy surface for 1×1 AA internal loops displayed anti–anti and syn–anti conformations as global and local minima, respectively. Furthermore, several stable local minima states in both anti–anti and syn–anti conformations were found for 1×1 AA internal loops. The results indicated that the stable 1×1 RNA internal loop conformations could be exploited for small molecule binding. Indeed, we analyzed the binding mechanism of a substituted naphthyridine (C-2) to RNA 1×1 UU internal loops, which inhibits binding of MBNL1 to RNA CUG repeat expansions.43 The results indicated that complex structural transformations are associated with binding.43 Similar results were seen when we analyzed 6′-N-5-hexynoate kanamycin alkyne (K-alkyne) binding to 2×2 CU/UC internal loops in RNA CCUG repeats, which is a lead small molecule targeting RNA causing DM2.49 Hence, atomistic details of the structure and dynamics of RNA internal loops as well as the transformation pathways extracted from the predicted free energy profiles can yield insights that might be used to understand and develop drugs that will target RNA repeat expansions. Although there are no structures reported for MBNL1 bound to CUG repeats, it is thought that the zinc finger 3 and 4 domains (Zn3/4) of MBNL1 have some functional roles in the binding process.50 Thus, the present investigations could also shed light on this pathogenic interaction.
In the present contribution, structural and thermodynamic properties of 1×1 UU RNA internal loops are predicted using regular and umbrella sampling MD simulations in explicit solvent with an AMBER force field, which includes a χ torsional revision for RNA.51 We also exploited the discrete path sampling (DPS) method to investigate the energy landscape of the 1×1 UU internal loop in RNA CUG repeats. Three systems were considered: 3×CUG3SYW (r[5′UUGGGC(CUG)3GUCC]2), 3×CUGinf (r[5′C(CUG)3G]2), and 1×CUG (r[5′CCGCUGCGG]2). 3×CUG3SYW and 3×CUGinf were used to predict the dynamic properties of 1×1 UU base pairs. In particular, 3×CUGinf was designed to simulate 1×1 UU RNA internal loops in an infinitely long linear RNA system, while 3×CUG3SYW is an already solved crystal structure with PDB accession code 3SYW.38 1×CUG was designed to predict the 2D free energy surfaces of 1×1 RNA UU internal loops using umbrella sampling MD calculations. Similar to our previous RNA CAG repeat study,48 one of the reaction coordinates was chosen as the χ torsion (rotation around the glycosidic bond) in order to mimic the orientation of the uridine base with respect to sugar, while the other reaction coordinate was a pseudotorsion (θ) mimicking base flipping (base stacking ↔ unstacking). Two 2D potentials of mean force (PMF) surfaces, (θ1,χ) and (θ1,θ2), were calculated for the 1×1 UU base pairs. Our results indicate that 1×1 UU RNA internal loops are dynamic and favor the anti–anti conformation but have several local minima in the 2D PMF profiles displaying both anti–anti and syn–anti conformations. The 2D (θ1,χ) PMF exhibits three pathways for the syn–anti ↔ anti–anti transformation, one of which dominates in temperature jump MD simulations. These results were verified using DPS calculations, which showed that in the dominant kinetic pathway the uridine flips out via the major groove, followed by a rotation around χ to produce a syn → anti transformation. In line with previous studies, the 2D (θ1,θ2) PMF as well as regular MD simulations displayed 1×1 UU base pairs in 2, 1, and 0 anti–anti hydrogen-bond conformations. Similar to the 1×1 AA base pairs studied before,48 a Na+ binding pocket was discovered near the 1×1 UU base pair, stabilizing the syn–anti conformation. Furthermore, MD simulations of 3×CUG3SYW showed 2×2 GC/CG regions flanked by 1×1 UU base pairs to have stable but distorted forms, which indicates flexibility.
The present results reveal atomistic details of the structure and thermodynamics of 1×1 UU base pairs in RNA CUG repeat expansions that are inaccessible with current experimental methods. This insight should help us to design better compounds targeting RNA CUG repeats in future work.
Methods
Preparation of Model Systems for MD Simulations
1×CUG (Figure 1A) was employed to predict the 2D free energy surfaces of 1×1 UU base pairs using umbrella sampling calculations. 3×CUG3SYW (Figure 1B) was considered to model the structural properties of a crystal structure (PDB accession code 3SYW),38 which has three consecutive CUG repeats. Finally, 3×CUGinf (Figure 1C) should provide insight into the dynamics of 1×1 UU base pairs in an infinitely long linear RNA system. The initial structure of 1×CUG was built from the already solved NMR structure (PDB accession code 2L8U).40 A homology model of 3×CUGinf was built from the crystal structure data of 3SYW(38) with UU base pairs in either anti–anti or syn–anti conformations. Two initial structures were created for 3×CUGinf; one where all 1×1 UU base pairs were in anti–anti conformations (3×CUGinf/anti–anti) and another where the middle UU base pair (U6U17) was in syn–anti (3×CUGinf/syn–anti). This was done in order to investigate potential syn–anti ↔ anti–anti transformations. For the initial structure of 3×CUG3SYW, data from the crystal structure 3SYW(38) was used, including dangling uridine residues, which were utilized experimentally to crystallize the system. As shown in Figure 1B, the dangling uridine residues were kept in the structure in order to mimic the original system as far as possible. The Leap module of AMBER MD package52 was used to neutralize all the systems with Na+ and/or Cl– ions53 and to solvate with TIP3P water molecules.54 In 3×CUGinf, 10 extra Cl– and Na+ ions were randomly included in the systems. The 1×CUG and 3×CUG3SYW were designed to have truncated octahedral boxes, while 3×CUGinf was designed to have a cubic box that created an infinitely long RNA system (Figure 1C). The 1×CUG, 3×CUGinf, and 3×CUG3SYW systems had 4025, 2265, and 10766 water molecules, respectively. Once equilibrated, these systems had 0.67, 0.21, and 0.18 mM Na+ concentrations, respectively. We also designed another 3×CUGinf system, which was neutralized with 20 Na+ ions, had the middle UU basepair in syn–anti conformation, and was solvated with 4333 water molecules to yield a Na+ concentration of 0.24 mM. Two sets of MD simulations for this system were run. The Amber force field55 with revised χ51 and α/γ56 torsional parameters were used in both regular and umbrella sampling MD simulations, as these revised parameters have been shown to improve the predictions.48,51,57−63
Figure 1.

Model RNA sequences and initial structures used in regular and umbrella sampling MD simulations. For illustrative purposes, the hydrogen atoms of the water molecules are not shown. The oxygen atoms of water molecules are represented with red dots. Blue and cyan spheres represent Na+ and Cl– ions, respectively. RNA structures are shown in the “new ribbons” format.65 The opaque region of C represents the unit cell, while transparent regions represent the neighboring cells to illustrate the design of the infinitely long RNA system. Residue numbers described for each system are used in the analyses.
Molecular Dynamics Simulations
Each system was first minimized and equilibrated in two steps (see also Table S1).48,57,58 After equilibration, constant pressure dynamics with isotropic positional scaling was used in all the production runs. The reference pressure was set to 1 atm with a pressure relaxation time of 2 ps. Bonds involving hydrogen atoms were constrained with SHAKE.64 In all the MD simulations an atom-based long-range hard cutoff of 8.0 Å was used. A total of 1 μs MD was run on 3×CUG3SYW. As described above, two independent MD calculations were run on 3×CUGinf, 3×CUGinf/anti–anti and 3×CUGinf/syn–anti, with total MD simulation times of 500 and 606 ns, respectively, with a 1 fs time step. These sets of MD simulations were run in order to characterize any syn–anti ↔ anti–anti transformations for the UU base pairs. The temperatures of all MD simulations were kept at 300 K. The PMEMD module in AMBER1252 was used to run the MD simulations. Trajectory files were written at intervals of 5000 fs time steps. For all these calculations, over 138 K CPU hours were required.
Umbrella Sampling Simulations
The reaction coordinates shown in Figure 2, which we previously utilized to study RNA 1×1 AA base pairs,48 were used to build the 2D PMF surfaces for RNA 1×1 UU internal loops. Two different 2D potential of mean force (PMF) surfaces, (θ1 vs χ) and (θ1 vs θ2), were calculated for 1×1 UU base pairs using the model system 1×CUG (Figure 1A). Nucleic acid bases can rotate around glycosidic bonds (rotation around χ torsional angle), which are responsible for the syn and anti base orientations with respect to sugar (Figure 2A). While purine residues prefer both syn and anti orientations, pyrimidine residues mostly prefer anti. Hence, one of the reaction coordinates was chosen to be the χ torsional rotation. The second reaction coordinate was chosen to imitate base stacking ↔ unstacking, where the center-of-mass pseudodihedral angle (θ) was defined to mimic this motion (Figure 2B). In order to build each 2D PMF surface, 36 × 36 = 1296 umbrella sampling windows were simulated. Initial structures with different (θ1,χ) and (θ1,θ2) combinations were created for the model system 1×CUG (see Section S1 in the Supporting Information for the details).
Figure 2.

Reaction coordinates utilized to build the 2D PMF surfaces for RNA 1×1 UU base pairs. In A, the torsional angle highlighted in red is χ (O4′–C1′–N1–C2) responsible for the syn ↔ anti transformation. In order to investigate the base stacking ↔ unstacking, pseudodihedral angles, θ1 and θ2, defined by the center-of-masses (COMs) of four atom groups in B were chosen as reaction coordinates.
Temperature Jump MD Simulations
Due to the relatively large energy barriers we did not see any syn ↔ anti transformations in the MD simulations of 3×CUG3SYW and 3×CUGinf (except for one case, which had low Na+ concentration). Thus, we studied the structural properties of 1×1 UU base pairs with respect to temperature using 1×CUG. Two systems were considered: one where the 1×1 UU base pair is in an anti–anti conformation (χ = 200° and θ1 = 40°) and another where it is in a syn–anti conformation (χ = 40° and θ1 = 350°). For each case, 10 independent MD simulations were run where the temperature was increased from 300 to 400 K by 5 K for each 1 ns MD time interval. Once the temperature reached 400 K, another 19 ns MD was run in each case. No restraints were imposed on the system. MD simulations were carried out with the pmemd.MPI module of AMBER12.52 A total of over 800 ns MD was run in these simulations. We should note that this particular calculation is somewhat similar to simulated annealing protocol and was done to force the system to overcome the energy barriers responsible of syn ↔ anti transformation. Because 400 K is higher than the boiling point, a full MD would not mean much.
Umbrella Sampling of RNA Mononucleosides
We utilized umbrella sampling MD simulations to predict the 1D PMF profiles of A, G, U, and C mononucleosides along the χ torsional axis (Figure 2A). The procedure is similar to the umbrella sampling simulations described above, except that only the individual mononucleosides were solvated with 738 TIP3P water molecules54 and simulated. χ torsional angles were incremented by 10° that created 36 umbrella sampling windows for each system. After minimization and 1 ns equilibration, each window was simulated for 5 ns. The χ torsions in the umbrella sampling MD simulations were restrained in a square bottom well with parabolic sides and 30 kcal/(mol rad2) force constants.
Discrete Path Sampling
The discrete path sampling66,67 method (DPS) has previously been used to study the energy landscapes for a diverse range of atomic and molecular systems.68−70 In particular, this approach has proved to be effective in exploring landscapes that feature broken ergodicity,71 leading to multiple relaxation time scales. DPS is based on geometry optimization techniques and is efficient in sampling “rare event” dynamics, which are typically inaccessible in conventional unbiased simulation methods.72,73 In the present work we have used DPS to explore the energy landscape of the RNA CUG repeats, to supplement our results from unbiased molecular dynamics and umbrella sampling simulations (see Section S2 in the Supporting Information for the details).
DPS simulations were seeded from conformations corresponding to the major basins on the 2D PMF of the single CUG repeat, choosing a diverse range of pseudotorsion and χ torsion values. These conformations were locally minimized using a modified version of the LBFGS algorithm,74 to build an initial database of minima. Geometry optimizations were deemed to have converged when the root-mean-square gradient fell below 10–6 kcal mol–1. Connection attempts were made between these minima in a pairwise fashion, starting from the highest energy minimum in the database to the lowest. Once sufficient connections were found, a disconnectivity graph75−77 analysis revealed that syn–anti and anti–anti states of the uridine base pairs were likely to emerge as competing funnels on the energy landscape. The stationary point databases were further expanded by refining the discrete paths between the syn–anti and anti–anti end points, using systematic applications of the SHORTCUT BARRIER and UNTRAP schemes, which have been described in detail in previous work78 and are available within our PATHSAMPLE code.79 DPS simulations were deemed to have converged sufficiently when the rate constants corresponding to the syn–anti ↔ anti–anti conformational transition were stable to within an order of magnitude. The final stationary point database consisted of 21927 minima and 25467 transition states. Free energies were estimated from the database by employing the harmonic superposition approximation.80 Here, the molecular partition function is approximated as a sum over harmonic vibrational densities of states corresponding to the catchment basins of each minimum.81,82
Analysis
The Ptraj module of AMBER1252 was used for dihedral, root-mean-square deviation (rmsd), and cluster analyses. The weighted histogram analysis method83,84 (WHAM) was used to calculate the PMF surfaces using WHAM ver. 2.0.4 written by Alan Grossfield.85 In the WHAM analysis, the last 1.5 ns data of each umbrella sampling simulation was used, and periodicity was turned on in both dimensions. X3DNA86 was used to extract global structural properties of 3×CUG3SYW from the MD trajectory.
Calculation of Rate Constants
The rate constants corresponding to the conformational transitions between the syn–anti and anti–anti states were calculated from the stationary point database using a graph transformation method, as described in a previous work.87 The estimates for the rate constants at 300 K were obtained using a self-consistent regrouping scheme,88 which recursively lumps minima separated by free energy barriers below a threshold into one macrostate. This is an attractive approach, as the free energy surface then becomes a function of the experimental observation time, due to the lumping of minima separated by low barriers.89 Furthermore, this method alleviates any bias arising due to the choice of original end points, as they are expanded into ensembles of structures that are assumed to be in local equilibrium on the time scale of the rate-determining step of interest.
Disconnectivity Graphs
The potential and free energy landscapes were visualized in the form of disconnectivity graphs.75−77 The disconnectivity graph provides a powerful yet simple representation of the energy landscapes and is free of potential artifacts that can arise from low dimensional projections onto selected order parameters.90,91 This representation retains all of the kinetic information in the database and thus provides a way to rigorously test the validity of the reaction coordinates employed in our 2D umbrella sampling simulations (see Section S3 in the Supporting Information for the details).
Results and Discussion
Detailed analyses of each system are described below. In summary, we found that the MD trajectories for 3×CUG3SYW and 3×CUGinf show stable 1×1 UU base pairs both in anti–anti and syn–anti conformations. Except for one case (3×CUGinf with low Na+ concentration), no syn–anti ↔ anti–anti transformations are observed. This result was attributed to the high energy barriers observed in umbrella sampling and DPS calculations, which predicted three syn–anti ↔ anti–anti transformation pathways. Temperature jump MD simulations were performed, which revealed that one of the pathways predicted by umbrella sampling and DPS calculations dominates the syn–anti → anti–anti transformation. For illustration we use different colors to represent each stable 1×1 UU base pair conformation to highlight the transformations (Figure 3).
Figure 3.
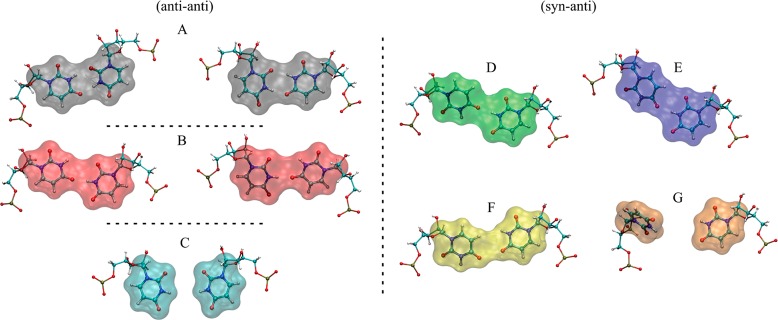
Conformational states of 1×1 UU base pairs seen in MD trajectories of 3×CUG3SYW and 3×CUGinf. Color notation was used to represent each state to make visualization of rmsd plots (vide infra) easier. Black (A), red (B), and cyan (C) represent anti–anti conformations with 2, 1, and 0 hydrogen-bond. Green (D), blue (E), yellow (F), and orange (G) are used for syn–anti conformations. Note that, in anti–anti UU conformations, the system is symmetric. As a result, there are two conformations each in A and B representing the same state.
Structure of r(3×CUG3SYW)
The initial structure of 3×CUG3SYW solved by X-ray diffraction with 2.20 Å resolution is shown in Figure 1B.38 The system contains three consecutive RNA CUG repeats with two dangling uridines which were included experimentally to facilitate crystallization. We analyzed the global structural properties of 3×CUG3SYW and compared them to the published crystal structure. Furthermore, the conformational preference of each 1×1 UU base pair, as well as the 2×2 CG/GC base pairs flanked by two neighboring 1×1 UU base pairs (Figure 4), along with the dynamics of dangling uridines, were analyzed.
Figure 4.

Rmsd analysis of 3×CUG3SYW. See Figure 1B for residue numbering. Rmsd’s (in Å) of U8U33, G9C10/G31C32, U11U30, G12C13/G28C29, and U14U27 are plotted with respect to the stable conformations shown in Figures 3 and 5. Note that all the UU base pairs are in anti–anti conformations with stable forms represented by black, red, and cyan (Figure 3A–C, and Movie S1). In the rmsd analysis of the 1×1 UU base pairs (U8U33, U11U30, and U14U27), conformational states with rmsd greater than 1 Å represent symmetry related versions of the states. As noted in Figure 3, UU base pairs in states colored black and red have two identical conformations representing 2 and 1 hydrogen-bond states, respectively. The plots were created in this form to display the transformations of 1×1 UU base pairs during the trajectory. Note also that the stable GC/CG conformation represented by magenta only forms when the flanking 1×1 UU base pairs are both in the 2 hydrogen-bond and opposite symmetry states (black) (see Movie S2).
Global Structural Properties of 3×CUG3SYW
The main difference between the 3SYW crystal structure and the 3×CUG3SYW structure is that the former is an almost frozen system while the latter is a system equilibrated at 300 K and thus includes dynamics. The minor (mgw) and major groove widths (Mgw) in the crystal structure of 3SYW are around 15 and 16 Å, respectively (Figure S1). Analysis of the MD trajectory shows that the mgw fluctuates around the crystal structure value (Figure S1), which is globally in an A-form conformation. On the other hand, the MD trajectory shows a Mgw that fluctuates around 20 Å. The expanded Mgw suggests that the inclusion of 1×1 UU internal loops gives flexibility to the system. To understand the flexibility of each region in the RNA duplex, we analyzed the rmsd of 3×CUG3SYW with respect to the crystal structure. In the analysis, the sequence was broken down into 2 and 5 base pair segments so that we could investigate which regions in the RNA were responsible for the flexible behavior (Figure S2). The results show that the regions including UU base pairs are more flexible than the other regions in 3SYW (Figure S2). Globally, the central region, which includes 3 CUG repeats, is more flexible than the terminal regions, which includes Watson–Crick GC and Wobble GU base pairs (Figure S2). This result is expected because individual fluctuations of 1×1 UU internal loops will accumulate and yield global flexible regions as seen in 3SYW. It is noteworthy, however, that the overexpanded Mgw might be a force field artifact. Even though it is known that RNA internal loops introduce flexibility into the system, the overexpanded Mgw might be due to an improper description of base stacking and/or backbone torsions.
Conformational Preference of 1×1 UU Base Pairs
The crystal structure of 3SYW has three 1×1 UU base pairs in anti–anti conformations. Cluster analyses of the MD trajectory show three unique anti–anti conformations for the 1×1 UU base pairs, in line with the previous experimental results,40 which represent 2, 1, and 0 hydrogen-bond states, colored black, red, and cyan, respectively, in the rmsd plots (Figures 3 and 4). During the 1 μs MD simulation, we observed anti–anti ↔ anti–anti transformations numerous times (Figure 4 and Movie S1). Hydrogen-bond analyses indicate that the 1×1 UU base pairs populate the 2, 1, and 0 hydrogen-bond states with probabilities 43%, 41%, and 16%, respectively. Furthermore, in the regions where the 2×2 GC/CG base-pairs are in canonical Watson–Crick forms the black ↔ red transformations are very fast because the conformational states are very similar to each other (Figures 3A,B and 4). The 0 hydrogen-bond state (cyan) seems to act like an intermediate state and is less stable than to the 1 (red) and 2 (black) hydrogen-bond states. Hence, the dynamic behavior of the 1×1 UU base pairs yields flexible regions in the RNA structure described above (Figure S2).
Conformational States of 2×2 GC/CG Base-Pairs Flanked by UU Base-Pairs in 3SYW
The structure of 3×CUG3SYW (Figure 1B) is not as rigid as an infinitely long RNA. Thus, the effects of its flexibility will appear in weak regions of 3×CUG3SYW. The 1×1 UU base pairs will be the first to acquire this flexibility, as noted above. The next weakest regions are 2×2 GC/CG base-pairs flanked by these UU base-pairs. Even though the GC base pairs in these regions are in Watson–Crick forms, they will not be as rigid as in regular RNA stem regions due to the flanking UU base pairs. We observed similar results when analyzing RNA CAG and CCUG repeat expansions.48,49 Indeed, our analysis shows that 2×2 GC/CG regions flanked by UU base-pairs are flexible and can have a stable noncanonical conformation (Figures 4 and 5C and Movie S2). In the rmsd analysis of G9C10/G31C32 and G12C13/G28C29 the magenta color represents this stable noncanonical conformation (Figure 5C), which persists for as long as 200 ns, as is apparent during 420 and 610 ns intervals in the MD simulation (magenta color in Figure 4). Note, however, that this stable noncanonical GC/CG conformation only forms when the flanking 1×1 UU base pairs are both in stable 2 hydrogen-bond and opposite symmetry states (black) (Figure 4 and Movie S2). In this noncanonical GC/CG form, each GC base pair loses two Watson–Crick hydrogen-bonds, while forming an attractive electrostatic interaction between the −NH2 group of guanine and the 2′-OH group of the ribose of its Watson–Crick partner (Figure 5). The results indicate that if the flanking base pairs (in this case the 1×1 UU) transform to energetically favorable states they can distort the repeating 2×2 GC/CG regions (Movie S2). This particular phenomenon is one of the reasons why we observe an overexpanded Mgw in the MD trajectory (Figure S1). As described above, the particular distorted GC/CG conformation shown in Figure 5 forms when the flanking UU base pairs are in 2 hydrogen-bond states (Figure 4). The overexpression of the 2 hydrogen-bond states might be a force field artifact, which could indirectly cause the overexpanded Mgw we observed (Figure S1). Therefore, caution is required when analyzing the results, even though we are using an improved RNA force field.
Figure 5.
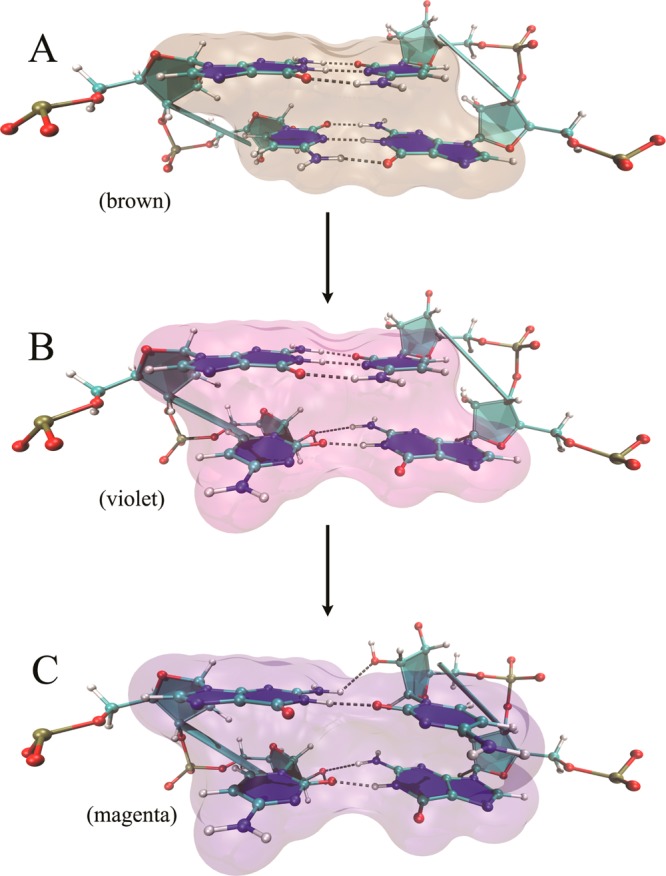
Stable 2×2 GC/CG conformations flanked by 1×1 UU base pairs. (A) GC base pairs in canonical Watson–Crick base pair forms. (B) One of the GC base pairs is distorted and loses a hydrogen-bond. In this form, the −NH2 group of guanine forms an attractive electrostatic interaction with the 2′-OH group of cytidine. (C) Both GC base pairs are distorted and lose one hydrogen-bond each. Both GC base pair conformations are in the distorted GC form described in B. The distortions happen only when the flanking 1×1 UU base pairs are both in the 2 hydrogen-bond but opposite symmetry states (see Movie S2).
Structural Preference of Dangling Uridine Bases in 3SYW
As noted above, the RNA sequence shown in Figure 1B includes dangling uridines, which were used experimentally to help crystallize the system. We kept these uridine ends and analyzed their structural preferences using 3×CUG3SYW. The initial conformations of the dangling uridine ends are shown in Figures 1B and 6A. At later times, however, they transform to a stable state where U2 and U21 are both unstacked, while U1 and U20 are stacked on top of the guanine of the terminal GC base pairs (G3C38 and G22C19) (Figure 6C). In this form, both U1 and U20 have flipped upside down sugars (Figure 6C), as seen previously in NMR and MD analyses of the single-stranded RNA structure GACC.58 Crystal structures basically are frozen systems, while MD simulations include dynamics. Although the crystal structure of 3SYW has the dangling uridine ends being inserted into the RNA major grooves, this does not mean that they will remain there when the system is equilibrated at room temperature. Indeed, the MD simulation of 3×CUG3SYW shows the dangling uridine ends in very different conformations, where stacking interactions play an important role in the final conformations (Figure 6C). Once the dangling uridine ends transformed to this final stable conformation (Figure 6C) they stayed there for the rest of the MD simulation (see Supporting Information). However, we should note that this particular result might be a force field artifact caused by the improper description of the backbone, the nonbonded interactions, or solvent molecules. Chen and Garcia recently showed that the van der Waals parameters of adenine base atoms required revision,92 and a similar revision might be required for uridine.
Figure 6.
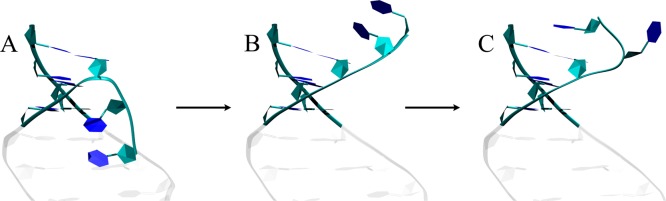
Conformational transformation of the dangling uridine bases (from the MD trajectory of 3×CUG3SYW). (A) Initial state where dangling uridines are bent toward the RNA major groove. (B) Dangling uridines stacked over the RNA terminal base pairs. (C) Final stable state where uridine (U1 and U20) is flipped upside down and stacked over the RNA terminal base pair, while the other uridine (U2 and U19) is unstacked. For residue numbering see Figure 1B.
Structure of r(3×CUGinf)
In DM1, expanded repeats can have sizes between 50 and 10000.9 These RNA CUG repeats adopt hairpin structures with very long nonhairpin regions.93 Hence, the system in Figure 1C was designed specifically to study the behavior of 1×1 UU base pairs in an infinitely long linear RNA system with continuous CUG repeats. Because a full turn of an A-form RNA duplex requires ∼11 basepairs, we designed the system shown in Figure 1C, such that the RNA duplex is along the z-axis, has 11 basepairs, and stacks perfectly with the neighboring RNA duplexes when periodic boundary conditions are turned on. No restraints (either positional or torsional) were imposed on the RNA duplex; stacking interactions between the neighboring GC base pairs keep the system in a linear form automatically. This trick, which we previously applied to RNA CCUG repeats to investigate the dynamic properties of CU/UC internal loops,49 allows us to design an infinitely long linear RNA duplex (see Movie S3). Although r(3×CUGinf) is not a perfect RNA CUG repeat expansion, it is rather a linear RNA duplex having three continuous CUG repeats and then a GGCC/CCGG tetramer region (see Figure 1C). If we leave off the “end-fraying” effects in the finite duplexes, this does give the same structural properties of finite duplexes. Ultimately the periodic trick will break down when the length of the structure is longer than the persistence length. Nevertheless, the designed system allowed us to “implicitly” force the RNA duplex to stay in a linear form due to the stacking of the neighboring RNA duplexes and, hence, study the behavior of 1×1 UU base pairs in a linear RNA geometry (see Supporting Information). Two MD simulations were run; one where the initial conformations of all the UU base pairs were anti–anti (3×CUGinf/anti–anti) and another where the initial conformations of U3U20 and U9U14 were anti–anti and U6U17 was syn–anti (3×CUGinf/syn–anti). We further completed two independent MD simulations on 3×CUGinf/syn–anti, which had low Na+ concentration (0.24 mM).
3×CUGinf/anti–anti
A 500 ns MD simulation was run for this system. The initial conformations of all the UU base pairs were anti–anti and stayed in this form during the MD simulation (Figure 7). Similar to the results seen for 3×CUG3SYW, three 1×1 UU base pair conformations are observed in the MD trajectory representing 2, 1, and 0 hydrogen-bond states (Figures 3 and 7). Even though no anti–anti → syn–anti transformations are seen, numerous anti–anti ↔ anti–anti transformations are observed (Figure 7). A hydrogen-bond analysis indicates that the 1×1 UU base pairs in 3×CUGinf/anti–anti populate states with 2, 1, and 0 hydrogen-bonds with probabilities 33%, 60%, and 7%, respectively. The reason for the increase in the 1 hydrogen-bond state compared to 3×CUG3SYW is due to the rigidity of the 2×2 GC/CG regions flanked by 1×1 UU base-pairs in 3×CUGinf. Structurally, the 2 (black) and 1 (red) hydrogen-bond states are alike, while the 0 (cyan) hydrogen-bond state acts like an intermediate (Figure 3A–C). Thus, the black ↔ red transformations will be fast if no large distortions occur in the 2×2 GC/CG regions. In 3×CUG3SYW, because 2×2 GC/CG regions are flexible the 1×1 UU base pairs have a higher probability of transforming to the stable 2 hydrogen-bond states. On the other hand, analyses showed that the conformations of the 2×2 GC/CG regions in 3×CUGinf/anti–anti were always in canonical Watson–Crick GC base pairs with 3 hydrogen-bonds. The results indicate that the 2×2 GC/CG regions in 3×CUGinf/anti–anti are structurally more rigid than the ones in 3×CUG3SYW. As a result, it is harder for the 1×1 UU base-pairs to transform to a stable 2 hydrogen-bond state without distorting the 2×2 GC/CG regions in 3×CUGinf/anti–anti.
Figure 7.

RMSD analysis of 1×1 UU base pairs seen in the 3×CUGinf/anti–anti MD simulation (See Figure 1C for residue numbering). The initial structures of all the UU base pairs were in anti–anti. The color scheme described in Figure 3 was used to display the conformational transformations. Note that black and red conformations (Figure 3) represent 2- and 1-hydrogen-bond states, which can be described by two symmetric orientations (Figure 3A,B). Rmsd states greater than 1 Å represent the symmetry related orientations.
3×CUGinf/syn–anti
An over 600 ns MD simulation was run for this system. As described above, the initial conformation was designed to have the middle UU base pair (U6U17) in a syn–anti conformation and the terminal UU base pairs (U3U20 and U9U14) in anti–anti. This design enables us to investigate potential syn–anti → anti–anti transformation pathways. Figure 8 shows the rmsd and Na+ binding analyses for this system. Except for one case, which had low Na+ concentration, no anti–anti ↔ syn–anti transformations were observed. Similar to the 3×CUGinf/anti–anti results, numerous anti–anti ↔ anti–anti transformations were seen for U3U20 and U9U14, where 2, 1, and 0 hydrogen-bond states were occupied with probabilities 47%, 48%, and 5%, respectively. However, U6U17, which stayed in the syn–anti conformation, exhibited only 1 and 0 hydrogen-bond states with probabilities 93% and 7%, respectively. The green and blue conformations shown in Figure 3 display 1 hydrogen-bond state when the 1×1 UU base pair has a syn–anti conformation. Even though no syn–anti → anti–anti transformation was observed for U6U17 in this system we see that there are at least four times where U6, which is in the syn conformation, unstacked from the helical axis, colored orange in the rmsd plot (Figures 3G and 8). In this orange state (Figure 3G), U6 is unstacked from the helical axis via the minor groove but does not complete the syn → anti transformation (Movie S4). One reason for not observing the syn → anti transformation is the Na+ binding pocket seen near U6 (Figure 9). The transformation of U6 from a stacked state (green, blue, and yellow colored states displayed in Figure 3) to an unstacked state (orange) only happens when the Na+ binding pocket is not occupied by a Na+ ion (Movie S4). However, this state was short-lived because Na+ ions were found to rapidly occupy the binding pocket even after U6 tried to unstack and then stabilize the syn–anti UU conformation by bringing back U6 to the stacked conformation (see MD simulation times ∼205, ∼ 360, ∼ 420, and ∼545 ns in Figure 8). As a result, no syn → anti transformation was observed.
Figure 8.

Rmsd of 1×1 UU base pairs and Na+ binding to the pocket seen in 3×CUGinf/syn–anti MD simulations (see Figure 1C for residue numbering). The initial structures of the terminal UU base pairs, U3U20 and U9U14, were anti–anti, while U6U17 was syn–anti. The color scheme described in Figure 3 was used to display conformational transformations of the UU base pairs. See Figure 7 caption for details of the rmsd analysis. A Na+ binding pocket was observed near U6 when it was in the syn conformation (Figure 9). In the Na+ binding analysis different colors represent different Na+ ions in the system where the distance between each ion and the center-of-mass (COM) of the three atoms shown in Figure 9 (O2P and O2 of U6, and N7 of G7) were calculated. Note that when the binding pocket was not occupied by a Na+ ion, U6 tried to unstack from the helical axis and transformed to the orange state (Figure 3G). However, this state was short-lived, and no syn ↔ anti transformation was observed (Movie S4).
Figure 9.

Na+ binding pocket was observed near U6 when it was in the syn orientation. When occupied by a Na+ ion, there are three attractive electrostatic interactions. As shown in Figure 8, these interactions stabilize the syn–anti UU orientation. When no Na+ ion was present in the pocket, U6 unstacked via the minor groove (Movie S4). A full syn → anti transformation, however, was not observed, due to the rapid occupation of the pocket by Na+ ions. This can be seen in the rmsd analyses of U6U17 (Figure 8) where the orange colored state has a short lifetime.
In order to investigate further the role of Na+ ions, we designed another 3×CUGinf system, which had a low Na+ ion concentration. We did two independent MD simulations on this new system. In the first set, we observed a syn → anti transformation within 60 ns (Figure S3). This transformation happened right after the loss of a Na+ ion from the binding pocket (Figure S3). In the second set, however, we did not observe any syn → anti transformation within 200 ns (Figure S4). During the MD simulation of the second set, the Na+ binding pocket was occupied by different Na+ ions almost all the time (Figure S4). The results indicate that the syn–anti UU conformation is intrinsically stable and is further stabilized by Na+ ions through the Na+ binding pocket.
Umbrella Sampling Results for 1×1 UU Base Pairs
The MD results for 3×CUG3SYW and 3×CUGinf have provided details of the dynamics of each system. Except for one case (3×CUGinf with low Na+ concentration), we did not observe any syn–anti ↔ anti–anti transformation for 1×1 UU base pairs. To further explore this result, we utilized umbrella sampling MD simulations to build two 2D PMF surfaces, (θ1,χ) and (θ1,θ2) (variables defined in Figure 2), to extract the transformation pathways for 1×1 UU base pairs as well as other potentially stable UU conformations. Note, however, that the calculated 2D PMF surfaces are approximations to the true multidimensional energy landscapes. For example, in the analysis we assumed that the flanking GC basepairs will not be distorted during base stacking ↔ unstacking. It is possible that the flanking GC basepairs might stack on top of each other once the uridines are fully unstacked from the helical axis. Such phenomena were omitted from the analysis. The choice of pseudodihedral shown in Figure 2B was made after careful analysis, where we tried other reaction coordinates to mimic base stacking ↔ unstacking. The use of pseudodihedrals to study base flipping in nucleic acids was previously done by us and others.48,94−96
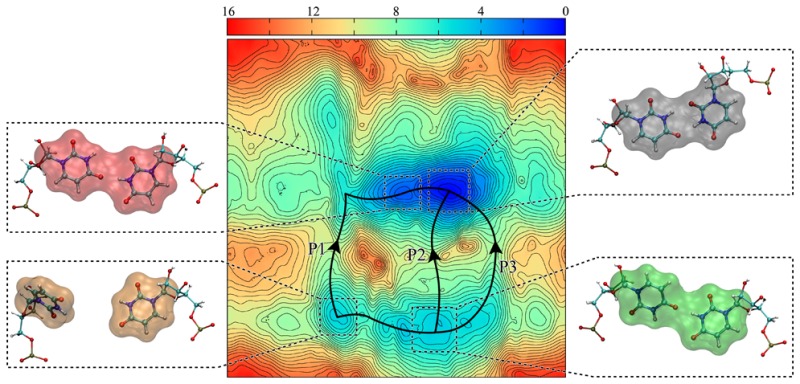
2D (θ1,χ) PMF Surface
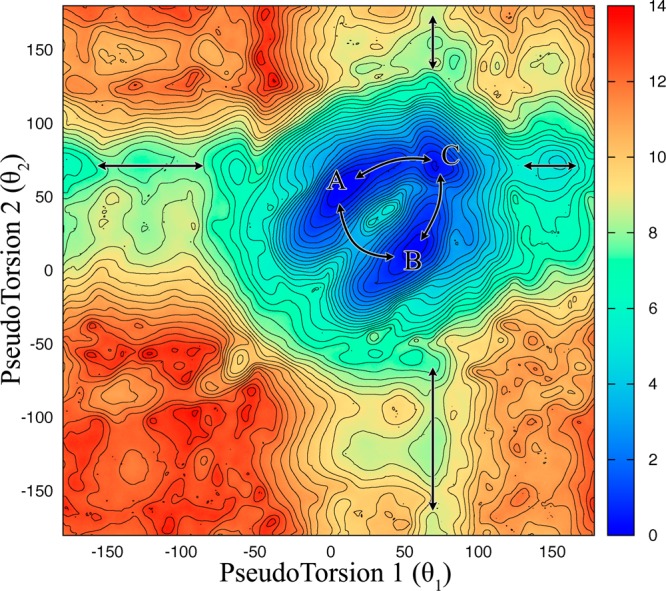
Figure 10 shows the 2D (θ1,χ) PMF surface predicted by umbrella sampling calculations for 1×1 UU base pairs. There is excellent overlap of the (θ1,χ) distributions calculated for each umbrella sampling run (Figures S5 and S6). Three pathways were found for syn–anti ↔ anti–anti transformations: P1, where uridine unstacks via the minor groove in order to make the syn ↔ anti transformation, P2, where uridine follows a direct transformation from syn ↔ anti, while stacked within the RNA helical axis, and P3, where uridine unstacks via the major groove to perform the syn ↔ anti transformation. These pathways are similar to the ones predicted for RNA CAG repeats, but details of the free energy landscape (Figure S7) are different.48 Energy barriers in the 2D (θ1,χ) PMF surface predicted for 1×1 AA base pairs are roughly 2 to 4 kcal/mol lower than for the 1×1 UU base pairs considered in Figure 10 (see also Figure S7). This result is expected because adenosine mononucleoside is known to prefer ∼40% syn and ∼60% anti, while cytidine is known to prefer over 90% anti,51 which results in different energy barriers (Figure S7).
Figure 10.

2D (θ1,χ) PMF surface predicted for 1×1 UU base pairs by umbrella sampling calculations. The results include 11 minima, where (g) is the global minimum conformation (anti–anti). Three transformation pathways for syn–anti ↔ anti–anti are predicted. Energy barriers, such as the ones seen in b ↔ e and j ↔ g transformations, might be the reason why we could not see any syn–anti ↔ anti–anti transformation in regular MD simulations at 300 K. See Figure S7 for a comparison with the results previously obtained for 1×1 AA base pairs.48
2D (θ1,θ2) PMF Surface
Figure 11 shows the 2D (θ1,θ2) PMF surface predicted by umbrella sampling calculations for 1×1 UU base pairs (for details of the reaction coordinates see Figure 2B). The overlap of the (θ1,θ2) distributions calculated for each umbrella sampling run is shown in Figure S8. This particular analysis was performed to investigate the correlation of stacking ↔ unstacking of each base in a 1×1 UU base pair. Note, however, that the initial conformations of the 1×1 UU base pairs are anti–anti. Thus, the effect of syn ↔ anti transformations is omitted in this analysis. First we note that the 2D PMF surface is symmetric, which is expected for 1×1 UU base pairs in the RNA CUG (Figure 11). Second, we find that unstacking of each uridine is negatively correlated. Hence, when one of the uridines starts to unstack the other uridine in the 1×1 UU base pair tends to stay in the helical axis. This result is illustrated in Figure 11 with double-ended arrows, here emphasizing the channels directing the stacking and unstacking for each uridine. Third, the results indicate the lowest free energy states describing the different stacked 1×1 UU base pair conformations. States A and B in Figure 11 represent a mix of 2 and 1 hydrogen-bond conformations, while state C represents a mix of 1 and 0 hydrogen-bond. As described before, the conformations of 2 and 1 hydrogen-bond UU base pairs are almost identical and, therefore, overlap in Figure 11. A detailed hydrogen-bond analysis is displayed in Figure S9. In the 2D (θ1,θ2) PMF surface, regions around (θ1 = 40, θ2 = 70) and (θ1 = 70, θ2 = 40) represent 2 hydrogen-bond conformations, while the other regions of states A and B shown in Figure 11 represent 1 hydrogen-bond conformations (Figure S9). The A ↔ B, A ↔ C, and B ↔ C transformations displayed in Figure 11 were also observed in the MD simulations of 3×CUG3SYW and 3×CUGinf (Figures 4 and 7).
Figure 11.
2D (θ1,θ2) PMF surface predicted for 1×1 UU base pairs by umbrella sampling calculations. Double-ended arrows indicate the channels directing the stacking and unstacking of uridine in a 1×1 UU base pair. The lowest free energy states describe different stacked 1×1 UU base pair conformations. A and B represent a mix of 2 and 1 hydrogen-bond states, while C represents a mix of 1 and 0 hydrogen-bond states (see Figure S9 for hydrogen-bond analyses).
Comparison of Energy Barriers and Base Orientations in RNA Mononucleosides
As described above, the syn and anti are two important RNA conformations. Even though the 2D (θ1,χ) PMF profile displayed high energy barriers, we also investigated individual RNA mononucleosides of A, G, U, and C, to see if there are intrinsic differences between purines and pyrimidines. Umbrella sampling calculations were utilized to create the 1D PMF profiles for each RNA residue along the χ torsional axis (Figure S10). The results indicate that pyrimidines mostly prefer anti, while purines can have significant populations in syn (Figure S10). In A and G, ΔΔGsyn→anti (ΔGanti – ΔGsyn) differences are approximately 1.40 and 1.21 kcal/mol, respectively, while in U and C they are −0.39 and −0.21 kcal/mol, respectively (Figure S10). The percentage of anti conformations extracted from ΔΔGsyn→anti for A, G, U, and C at 300 K are 9%, 12%, 66%, and 58%, respectively, in line with previous results.51 Furthermore, the energy barriers seen in purines are lower than the ones seen in pyrimidines (Figure S10). In 1D PMF profiles, there are two barriers for the syn ↔ anti transformation: one around χ ∼ 120° (PB) and the other around χ ∼ 360° (PA) (Figure S10). While the energy barrier around χ ∼ 120° is only slightly larger in pyrimidines, the barrier around χ ∼ 360° is over 2 kcal/mol higher than for purines (Figure S10). The results indicate that purines in free mononucleoside forms would prefer the syn orientation over anti and will readily sample the syn ↔ anti transformation via PA and PB due to the low energy barriers, while pyrimidines would prefer anti over syn in free mononucleoside forms and will follow PB to perform the syn ↔ anti transformation (Figure S10).
Results of Temperature Jump MD Simulations
Even though the umbrella sampling calculations predicted three transformation pathways for syn–anti ↔ anti–anti, we did not observe any such transformation in the 600 ns MD simulation of 3×CUGinf/syn–anti (except when Na+ concentration was low). An intermediate state represented in orange (Figure 3G), corresponding to the potential minimum state b shown in Figure 10, was observed in the MD trajectory of 3×CUGinf/syn–anti (Figure 8) where U6 (in syn conformation) unstacked from the helical axis. However, the b → e transformation through P1 was not observed (Figure 10) even though this pathway was followed by 1×1 AA base pairs in the syn–anti → anti–anti transformation.48 One reason for not seeing the full transformation is due to the high energy barriers observed in the free energy profile of the 1×1 UU base pair (Figure 10), which were increased by the Na+ binding pocket near UU stabilizing the syn–anti UU conformation (Figures 8 and 9). We therefore utilized 1×CUG (Figure 1A) and increased the temperature of the system slowly from 300 to 400 K to study the syn–anti ↔ anti–anti transformations in 1×1 UU base pairs. Ten independent MD simulations starting with syn–anti and anti–anti 1×1 UU base pair conformations were run. Six out of 10 of the syn–anti systems ended up with anti–anti UU conformations, while no anti–anti → syn–anti was observed. The syn–anti → anti–anti transformations observed in the temperature jump MD simulations occurred via P1 and P3, which were followed 1 and 5 times, respectively (for definitions of pathways see Figure 10). Conformational states observed in the temperature jump MD simulations and the pathways followed during the syn–anti → anti–anti transformations are shown in Figure S11. Pathways P1 and P3 include unstacking via minor and major grooves, respectively. In the temperature jump MD simulations, even though numerous i ↔ b transformations were observed, only one of them overcame the energy barrier and followed the b ↔ e transformation (Figure 10). These results are different from the corresponding RNA CAG results, where the favorable syn–anti ↔ anti–anti pathway is via P1 in 1×1 AA base pairs (Figure S7).48 Indeed, the relative energy barriers of b ↔ e and j ↔ g transformations are 2.4 and 6.0 kcal/mol in the 2D (θ1,χ) PMF surface for 1×1 AA base pairs, while the same barriers for 1×1 UU base pairs are 4.4 and 3.8 kcal/mol, respectively (Figure S7). As a result, P1 and P3 are the favored syn–anti ↔ anti–anti transformation pathways for 1×1 AA and UU base pairs, respectively, due to the associated energy barriers.
Energy Landscape of 1×1 UU Base Pairs (Disconnectivity Graphs)
The potential and free energy disconnectivity graphs for the RNA system containing one CUG repeat are shown in Figures 12 and S12, respectively. The free energy disconnectivity graph was computed at 300 K using a regrouping threshold of 2 kcal/mol.76,97
Figure 12.
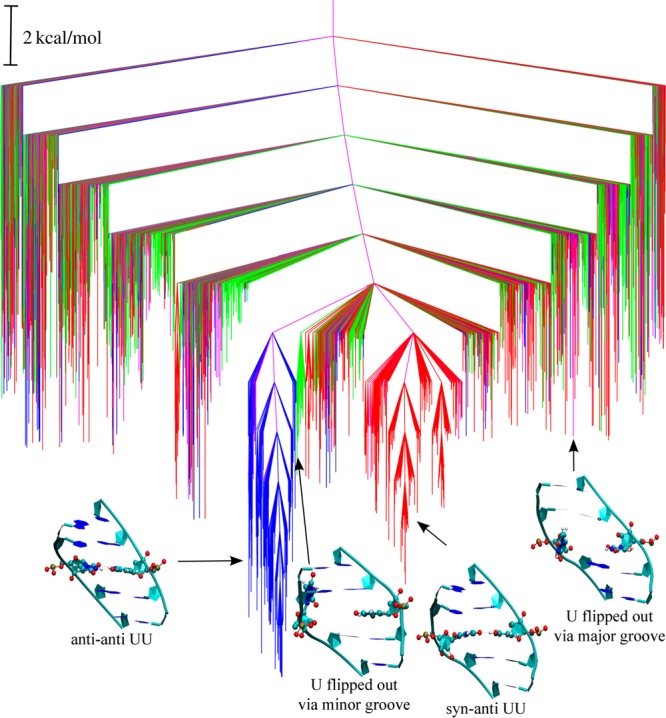
Potential energy disconnectivity graph for RNA CUG repeat. The red and blue branches lead to minima with the UU base pair in syn–anti and anti–anti conformations, respectively. The green and pink branches lead to minima, in which the uridine is unstacked via minor and major grooves, respectively. Some representative structures corresponding to different conformational states are also shown.
To make a direct comparison with the 2D PMF obtained from umbrella sampling calculations, the graphs were colored according to the pseudotorsion and χ torsion angles. The disconnectivity graph in Figure 12 clearly illustrates the double-funnel character of the underlying potential energy landscape. The anti–anti and the syn–anti states of the UU base pair corresponding to the two major funnels are colored blue and red, respectively. This observation is in agreement with the 2D PMF obtained from umbrella sampling calculations, where the two major free energy basins correspond to the anti–anti and syn–anti conformational states. The two funnels are separated by high energy barriers, leading to two competing morphologies. To quantify the barriers separating the two conformational states at 300 K, we have estimated the rate constants for the syn–anti ↔ anti–anti transformations using the graph transformation87 employing a regrouping threshold88 of 2 kcal/mol. This choice is appropriate, as similar values were obtained in terms of rate constants and disconnectivity graphs for a range of values around this selection. The rate constant for the conformational transition from syn–anti to anti–anti is estimated as 17240 s–1. The reverse transformation (i.e., anti–anti → syn–anti) is at least 2 orders of magnitude slower, with an estimated rate constant of 174 s–1. These rate constants approximately correspond to time scales of 58 μs and 6 ms, respectively. The presence of such competing morphologies separated by high barriers is normally associated with multiple relaxation time scales and features in the heat capacity profile.71
The minima corresponding to the flipped-out conformations of the UU base pair are colored green and purple for unstacking through the minor and major grooves, respectively. These conformations do not constitute any major funnel on the energy landscape and are distributed over a wide energy range in the disconnectivity graph. The free energy disconnectivity graph at 300 K (Figure S12) displays essentially the same features as the potential energy landscape, with two major funnels corresponding to the syn–anti and anti–anti states.
In general, we find that the selected order parameters distinguish the two major funnels quite well. Nonetheless, the intermixing of colors in certain regions of the graph suggests that structural order parameters alone are not sufficient to correctly represent the complexities of the underlying landscape.91,98 Hence, we use the recursive regrouping scheme instead,88 which is based on kinetic criteria, to estimate the rate constants.
Pathways between syn–anti and anti–anti Conformational States in UU Base Pairs
The kinetically relevant pathways between the syn–anti and anti–anti conformational states of the uridine base pairs were extracted from the stationary point databases using the recursive enumeration algorithm,88 which is based on kinetic criteria to estimate the rate constants.99,100 The diverse range of pathways that exist between the two conformational states can be classified in terms of three distinct mechanisms: (i) Pathway P1 (Figure 10), in which the uridine flips out via minor groove (Figure S13A) prior to the rotation of the uracil base around its glycosidic bond; (ii) Pathway P2 (Figure 10), in which the uridine transforms from syn to anti without unstacking significantly from the helical axis (Figure S13B); and (iii) Pathway P3 (Figure 10), in which the uridine flips out via the major groove (Figure S13C) followed by rotation of the uracil base around its glycosidic bond resulting a transformation from syn to anti.
For pathways P1 and P3, unstacking of uridine outside the helical axis (via minor and major grooves, respectively) precedes the rotation of the uracil base around its glycosidic bond that causes the syn ↔ anti transformation. These transitions are effectively the rate-determining steps in the two mechanisms. For pathway P2, the rotation around the glycosidic bond resulting in the flip of the χ torsion from syn to anti is associated with the surmounting of a transition state and corresponds to the rate-determining step. Although pathways P1 and P3 have similar path lengths, P3 is associated with relatively lower barriers and emerges as the “fastest pathway” in our kinetic transition network. Pathway P2 is longer than paths P1 and P3 and makes a smaller contribution. Thus, the properties of our kinetic transition network, in particular the existence of three different pathways from syn to anti conformational states as well as the mechanistic details of the transformation, are consistent with the predictions of the 2D (θ1,χ) PMF profile obtained from umbrella sampling.
Targeting RNA CUG Repeats with Small Molecules
In DM1, inhibition of RNA-MBNL1 binding through small molecules, which will target 1×1 UU base pairs, could ameliorate the disease. Therefore, understanding the structural and thermodynamic properties of RNA 1×1 UU internal loops could help us discover the binding mechanism of small molecules to RNA internal loops and thus the design rules for drugs, which will effectively target these RNA structures. Previously, we studied the binding mechanism of a substituted naphthyridine (C-2) that targets RNA CUG repeats.43 The results indicated complex structural transformations of the RNA internal loop in the small molecule binding process. C-2 had a total 16 stable C-2/CUG binding modes. The lowest two binding modes displayed 1×1 UU base pair in conformations near (θ1 = −55, χ = 200) and (θ1 = −55, θ2 = −55). Indeed, (θ1 = −55, χ = 200) represents one of the local minima, “e” in Figure 10 (also see Figure S7). Furthermore, (θ1 = −55, θ2 = −55) is one of the local minima in Figure 11. In other words, upon C-2 binding to RNA CUG, 1×1 UU base pair was transformed from global minimum g (anti–anti) to local minimum e (anti–anti) (Figure 10). Our previous results combined with the current work suggest that small molecules can exploit the stable local minima states of 1×1 UU base pairs if the final bound state is thermodynamically favorable.
Insights into the Binding of Proteins to CUG Repeats
It is known that MBNL1 binds to RNA CUG repeats, but the details are uncertain.27,101−103 Patel and co-workers solved the crystal structure of the MBNL1 tandem zinc finger 3 and 4 domains (Zn3/4) interacting with a single-stranded RNA, r(CGCUGU), which shows guanosine residues interacting with Zn3/4.50 Studies have suggested that the binding to CUG hairpins occurs upon a conformational change in the structure that melts the hairpin.28,50,104 Based on the results of 3×CUG3SYW, we discovered that tandem GC/CG base pairs flanked by 1×1 UU internal loops are less stable than when they are located in RNA stem regions. This result might give insight into how MBNL1 binds to RNA CUG repeat expansions. The distortions seen in tandem GC/CG regions flanked by 1×1 UU base pairs might enhance the binding of MBNL1 to RNA CUG repeat expansions. These studies also suggest that small molecules that stabilize RNA repeats could be effective modulators of cellular function.104
RNA CUG Loops in the Literature
Using the CoSSMos database105 developed by Znosko and co-workers we found 73 RNA structures that have CUG motifs with 1×1 UU loops (Table S2). The biological systems that have the RNA CUG motifs include RNA, ribosomes, zinc finger/RNA, transcription/RNA, and ribosome/antibiotic complexes (Table S2). Importantly, there are many RNAs that have single copies of the CUG motif, which might be targeted through binding to multiple motifs in a CUG hairpin simultaneously38,106 or using small molecules that cooperatively bind to repeats.43 The RNA CUG motifs in these structures either interact with Mg2+ ions or have tertiary interactions. Note that all the 1×1 UU base pairs in these CUG motifs have anti–anti conformations.
Using an in-house code, we extracted all the RNA CUG motifs from the structures and calculated the (θ1,χ) and (θ1,θ2) values for each 1×1 UU base pair. The results were then plotted on top of the MD results, which showed that the regions sampled by MD simulations were in line with the conformations seen in the literature (Figure S14). Basically, the 1×1 UU base pairs in these structures have 2, 1, or 0 hydrogen-bonds and prefer anti–anti. This observation suggests that the interaction of ions or tertiary interactions does not disturb the base orientations of uridines with respect to sugar, so the 1×1 UU base pairs prefer to stay in anti–anti. Furthermore, our binding studies of compound C-2 to RNA CUG repeats included over 25 μs MD simulations where 1×1 UU base pair stayed in anti–anti almost all the time.43 These results are in line with the umbrella sampling calculations, where the free energy difference of syn–anti to anti–anti (ΔGsyn–anti – ΔGanti–anti) is over 5 kcal/mol for 1×1 UU base pairs (Figure 10), while no significant difference was seen in the umbrella sampling calculations of RNA CAG repeats (Figure S7).48
Summary and Conclusions
Trinucleotide and tetranucleotide repeat expansions caused by mutations in certain genes lead to neuromuscular disorders. A promising therapeutic strategy is to target the transcribed RNA with small molecules. These RNA transcripts are known to form stable hairpin structures with 1×1 or 2×2 internal loops regularly placed in the stem regions. However, a thorough understanding of the atomistic details of RNA hairpins formed by expanded repeats is a must for designing rules and, therefore, better compounds, which will target RNA repeat expansions at nanomolar levels.
In the present contribution we utilized regular and umbrella sampling MD simulations of model RNA CUG systems and explained the structural and thermodynamic properties of 1×1 UU internal loops. The results indicate that RNA 1×1 UU internal loops are dynamic and can form more than one stable conformation where the global minimum conformation of the 1×1 UU base pair is anti–anti. Our MD results indicate that the 1×1 UU base pairs have 2, 1, and 0 hydrogen-bond states, which are in line with the 73 NMR/X-RAY structures we analyzed, as well as with previous studies.40 Moreover, the global picture of the 2D (θ1,χ) PMF surface for 1×1 UU base pairs has the same topology as one we previously determined for 1×1 AA base pairs, but with different energy barriers and free energy differences.48 While the syn–anti AA conformation is a possible state for RNA CAG repeats upon small molecule binding it is not as stable as anti–anti in RNA CUG repeats. This conclusion follows from umbrella sampling studies where the anti–anti UU conformation is over 5 kcal/mol more favorable than syn–anti. The result is also supported by experimental studies where no syn–anti UU conformations were seen in the reported structures with RNA CUG motifs. Additionally, the lowest free energy binding state of a compound to a model RNA CUG system exhibited a conformation in line with the present results described.43 Thus, the local minima conformations discovered for 1×1 UU base pairs by the umbrella sampling calculations could be important targets for small molecule binding. Our studies also showed that a Na+ binding pocket similar to the one detected in RNA CAG repeats exists for RNA CUG repeats, and it stabilizes the syn–anti UU conformation. This pocket includes three attractive electrostatic interactions between Na+ ions and RNA backbone/bases, so it could be used in drug design where electropositive groups such as −NH2 and −NH are incorporated in small molecules to utilize this binding pocket for a higher binding affinity. Hence, our results should help explain the mechanism behind small molecule driven structural change in RNA CUG repeat expansions.
Our results also indicate that there is an intrinsic difference between RNA CAG and CUG repeats, where purines prefer both syn and anti, while pyrimidines predominantly prefer anti. Furthermore, purine mononucleosides have lower energy barriers compared to pyrimidines. As a result, the differences we see in the 2D PMF surfaces and MD calculations for RNA CAG and CUG repeats can be traced to intrinsic properties in the torsion dependence of the force field. These results are, therefore, dependent on improvements implemented recently in the RNA force field. It was shown that the χ torsional parameters for the AMBER force field needed revision to make physically meaningful computational predictions including structural and thermodynamic properties of RNA mononucleosides, single-stranded RNA, RNA structures with modified residues, and RNA hairpins.51,57,58,60,107,108 Using these revised RNA force fields, other RNA repeat expansions such as CCUG, CCG, and CGG will be studied and compared to RNA CAG and CUG repeats. These studies should produce insight that can be used in understanding the mechanisms of different RNA repeat expansions and designing drugs that will target them.
Acknowledgments
Computations were done in Advanced Research Computing (QUEST) at the Northwestern University and Theory Group Computing Clusters at the University of Cambridge. This work was supported by the National Science Foundation Grant CHE-1147335) (G.C.S.), PS-OC Center of the NIH/NCI Grant 1U54CA143869-01 (G.C.S.), NIH Grant R01GM097455 (M.D.D.), Muscular Dystrophy Association Grant 254929 (M.D.D.), the EPSRC Grant EP/I001352/1 (D.J.W.), and the ERC Grant RG59508 (D.J.W.). D.C. acknowledges financial support from the Cambridge Commonwealth European and International Trust.
Glossary
Abbreviations
- C
cytidine
- U
uridine
- G
guanosine
- A
adenosine
- QM
quantum mechanical
- MM
molecular mechanics
- MD
molecular dynamics
- WHAM
weighted histogram analysis method
- PMF
potential of mean force
- DPS
Discrete Path Sampling
- PME
Particle Mesh Ewald
- rmsd
root-mean-square deviation
- 3×CUG3SYW
r[5′UUGGGC(CUG)3GUCC]2
- 3×CUGinf
r[5′C(CUG)3G]2
- 1×CUG
r[5′CCGCUGCGG]2
Supporting Information Available
The Supporting Information is available free of charge on the ACS Publications website at DOI: 10.1021/acs.jctc.5b00728.
Movie S1 (AVI)
Movie S2 (AVI)
Movie S3 (MPG)
Movie S4 (AVI)
Details of Umbrella Sampling simulation, the DPS method, and disconnectivity graphs; input files used in equilibration and production runs of r(3×CUGinf); RNA CUG motifs extracted from CoSSMos database; minor/major groove widths and RMSD analysis of 3×CUG3SYW; analysis of low Na+ concentration 3×CUGinf/syn–anti systems; (χ, θ1) and (θ1,θ2) distribution analysis; comparison of the 2D PMF surfaces for AA and UU base pairs; detailed hydrogen-bond analysis; 1D PMF profiles of RNA mononucleosides; syn–anti → anti–anti transformation observed in temperature jump MD simulations; free energy disconnectivity graph; DPS pathways; overlap of (θ1,χ) and (θ1,θ2) conformations sampled by UU base pairs in the MD simulation and seen in the literature; extra references. The publication is accompanied by sample data available at the https://www.repository.cam.ac.uk/handle/1810/247719 data repository. Because the total size of the computational data is over 400 GB it is not cost-efficient for public sharing. A detailed procedure explaining how the computations are done is provided in the Methods section. (PDF)
The authors declare no competing financial interest.
Supplementary Material
References
- Sobczak K.; Michlewski G.; de Mezer M.; Kierzek E.; Krol J.; Olejniczak M.; Kierzek R.; Krzyzosiak W. J. J. Biol. Chem. 2010, 285, 12755–12764. 10.1074/jbc.M109.078790. [DOI] [PMC free article] [PubMed] [Google Scholar]
- Tian B.; White R. J.; Xia T. B.; Welle S.; Turner D. H.; Mathews M. B.; Thornton C. A. RNA 2000, 6, 79–87. 10.1017/S1355838200991544. [DOI] [PMC free article] [PubMed] [Google Scholar]
- Balkwill G. D.; Williams H. E. L.; Searle M. S. Org. Biomol. Chem. 2007, 5, 832–839. 10.1039/b616820e. [DOI] [PubMed] [Google Scholar]
- Figueroa A. A.; Cattie D.; Delaney S. Biochemistry 2011, 50, 4441–4450. 10.1021/bi200397b. [DOI] [PMC free article] [PubMed] [Google Scholar]
- Petruska J.; Hartenstine M. J.; Goodman M. F. J. Biol. Chem. 1998, 273, 5204–5210. 10.1074/jbc.273.9.5204. [DOI] [PubMed] [Google Scholar]
- Cooper A. J. L.; Sheu K. F. R.; Burke J. R.; Onodera O.; Strittmatter W. J.; Roses A. D.; Blass J. P. J. Neurochem. 1997, 69, 431–434. 10.1046/j.1471-4159.1997.69010431.x. [DOI] [PubMed] [Google Scholar]
- Ashley C. T.; Warren S. T. Annu. Rev. Genet. 1995, 29, 703–728. 10.1146/annurev.ge.29.120195.003415. [DOI] [PubMed] [Google Scholar]
- Klockgether T.; Paulson H. Mov. Disord. 2011, 26, 1134–1141. 10.1002/mds.23559. [DOI] [PMC free article] [PubMed] [Google Scholar]
- Orr H. T.; Zoghbi H. Y. Annu. Rev. Neurosci. 2007, 30, 575–621. 10.1146/annurev.neuro.29.051605.113042. [DOI] [PubMed] [Google Scholar]
- Shoulson I.; Young A. B. Mov. Disord. 2011, 26, 1127–1133. 10.1002/mds.23685. [DOI] [PubMed] [Google Scholar]
- Walker F. O. Lancet 2007, 369, 218–228. 10.1016/S0140-6736(07)60111-1. [DOI] [PubMed] [Google Scholar]
- Yazawa I.; Nukina N.; Hashida H.; Goto J.; Yamada M.; Kanazawa I. Nat. Genet. 1995, 10, 99–103. 10.1038/ng0595-99. [DOI] [PubMed] [Google Scholar]
- Li L. B.; Yu Z. M.; Teng X. Y.; Bonini N. M. Nature 2008, 453, 1107–U1109. 10.1038/nature06909. [DOI] [PMC free article] [PubMed] [Google Scholar]
- Li L. B.; Bonini N. M. Trends Neurosci. 2010, 33, 292–298. 10.1016/j.tins.2010.03.004. [DOI] [PMC free article] [PubMed] [Google Scholar]
- Mykowska A.; Sobczak K.; Wojciechowska M.; Kozlowski P.; Krzyzosiak W. J. Nucleic Acids Res. 2011, 39, 8938–8951. 10.1093/nar/gkr608. [DOI] [PMC free article] [PubMed] [Google Scholar]
- Grabczyk E.; Kumari D.; Usdin K. Brain Res. Bull. 2001, 56, 367–373. 10.1016/S0361-9230(01)00572-X. [DOI] [PubMed] [Google Scholar]
- Sellier C.; Rau F.; Liu Y. L.; Tassone F.; Hukema R. K.; Gattoni R.; Schneider A.; Richard S.; Willemsen R.; Elliott D. J.; Hagerman P. J.; Charlet-Berguerand N. EMBO J. 2010, 29, 1248–1261. 10.1038/emboj.2010.21. [DOI] [PMC free article] [PubMed] [Google Scholar]
- Greco C. M.; Berman R. F.; Martin R. M.; Tassone F.; Schwartz P. H.; Chang A.; Trapp B. D.; Iwahashi C.; Brunberg J.; Grigsby J.; Hessl D.; Becker E. J.; Papazian J.; Leehey M. A.; Hagerman R. J.; Hagerman P. J. Brain 2006, 129, 243–255. 10.1093/brain/awh683. [DOI] [PubMed] [Google Scholar]
- Jin P.; Duan R. H.; Qurashi A.; Qin Y. L.; Tian D. H.; Rosser T. C.; Liu H. J.; Feng Y.; Warren S. T. Neuron 2007, 55, 556–564. 10.1016/j.neuron.2007.07.020. [DOI] [PMC free article] [PubMed] [Google Scholar]
- Verheij C.; Bakker C. E.; Degraaff E.; Keulemans J.; Willemsen R.; Verkerk A.; Galjaard H.; Reuser A. J. J.; Hoogeveen A. T.; Oostra B. A. Nature 1993, 363, 722–724. 10.1038/363722a0. [DOI] [PubMed] [Google Scholar]
- Verkerk A.; Pieretti M.; Sutcliffe J. S.; Fu Y. H.; Kuhl D. P. A.; Pizzuti A.; Reiner O.; Richards S.; Victoria M. F.; Zhang F. P.; Eussen B. E.; Vanommen G. J. B.; Blonden L. A. J.; Riggins G. J.; Chastain J. L.; Kunst C. B.; Galjaard H.; Caskey C. T.; Nelson D. L.; Oostra B. A.; Warren S. T. Cell 1991, 65, 905–914. 10.1016/0092-8674(91)90397-H. [DOI] [PubMed] [Google Scholar]
- Chen L. S.; Tassone F.; Sahota P.; Hagerman P. J. Hum. Mol. Genet. 2003, 12, 3067–3074. 10.1093/hmg/ddg331. [DOI] [PubMed] [Google Scholar]
- Galvao R.; Mendes-Soares L.; Camara J.; Jaco I.; Carmo-Fonseca M. Brain Res. Bull. 2001, 56, 191–201. 10.1016/S0361-9230(01)00651-7. [DOI] [PubMed] [Google Scholar]
- Emery A. E. H. Lancet 2002, 359, 687–695. 10.1016/S0140-6736(02)07815-7. [DOI] [PubMed] [Google Scholar]
- Raca G.; Siyanova E. Y.; McMurray C. T.; Mirkin S. M. Nucleic Acids Res. 2000, 28, 3943–3949. 10.1093/nar/28.20.3943. [DOI] [PMC free article] [PubMed] [Google Scholar]
- Kino Y.; Mori D.; Oma Y.; Takeshita Y.; Sasagawa N.; Ishiura S. Hum. Mol. Genet. 2004, 13, 495–507. 10.1093/hmg/ddh056. [DOI] [PubMed] [Google Scholar]
- Miller J. W.; Urbinati C. R.; Teng-umnuay P.; Stenberg M. G.; Byrne B. J.; Thornton C. A.; Swanson M. S. EMBO J. 2000, 19, 4439–4448. 10.1093/emboj/19.17.4439. [DOI] [PMC free article] [PubMed] [Google Scholar]
- Warf M. B.; Berglund J. A. RNA 2007, 13, 2238–2251. 10.1261/rna.610607. [DOI] [PMC free article] [PubMed] [Google Scholar]
- Yuan Y.; Compton S. A.; Sobczak K.; Stenberg M. G.; Thornton C. A.; Griffith J. D.; Swanson M. S. Nucleic Acids Res. 2007, 35, 5474–5486. 10.1093/nar/gkm601. [DOI] [PMC free article] [PubMed] [Google Scholar]
- Salisbury E.; Schoser B.; Schneider-Gold C.; Wang G. L.; Hluichalaf C.; Jin B. W.; Sirito M.; Sarkar P.; Krahe R.; Timchenko N. A.; Timchenko L. T. Am. J. Pathol. 2009, 175, 748–762. 10.2353/ajpath.2009.090047. [DOI] [PMC free article] [PubMed] [Google Scholar]
- Tsuda K.; Kuwasako K.; Takahashi M.; Someya T.; Inoue M.; Terada T.; Kobayashi N.; Shirouzu M.; Kigawa T.; Tanaka A.; Sugano S.; Guntert P.; Muto Y.; Yokoyama S. Nucleic Acids Res. 2009, 37, 5151–5166. 10.1093/nar/gkp546. [DOI] [PMC free article] [PubMed] [Google Scholar]
- Lueck J. D.; Mankodi A.; Swanson M. S.; Thornton C. A.; Dirksen R. T. J. Gen. Physiol. 2006, 129, 79–94. 10.1085/jgp.200609635. [DOI] [PMC free article] [PubMed] [Google Scholar]
- Wheeler T. M.; Lueck J. D.; Swanson M. S.; Dirksen R. T.; Thornton C. A. J. Clin. Invest. 2007, 117, 3952–3957. 10.1172/JCI33355. [DOI] [PMC free article] [PubMed] [Google Scholar]
- Savkur R. S.; Philips A. V.; Cooper T. A. Nat. Genet. 2001, 29, 40–47. 10.1038/ng704. [DOI] [PubMed] [Google Scholar]
- Zu T.; Gibbens B.; Doty N. S.; Gomes-Pereira M.; Huguet A.; Stone M. D.; Margolis J.; Peterson M.; Markowski T. W.; Ingram M. A. C.; Nan Z.; Forster C.; Low W. C.; Schoser B.; Somia N. V.; Clark H. B.; Schmechel S.; Bitterman P. B.; Gourdon G.; Swanson M. S.; Moseley M.; Ranum L. P. W. Proc. Natl. Acad. Sci. U. S. A. 2011, 108, 260–265. 10.1073/pnas.1013343108. [DOI] [PMC free article] [PubMed] [Google Scholar]
- Coonrod L. A.; Lohman J. R.; Berglund J. A. Biochemistry 2012, 51, 8330–8337. 10.1021/bi300829w. [DOI] [PMC free article] [PubMed] [Google Scholar]
- Kiliszek A.; Kierzek R.; Krzyzosiak W. J.; Rypniewski W. Nucleic Acids Res. 2009, 37, 4149–4156. 10.1093/nar/gkp350. [DOI] [PMC free article] [PubMed] [Google Scholar]
- Kumar A.; Park H.; Fang P. F.; Parkesh R.; Guo M.; Nettles K. W.; Disney M. D. Biochemistry 2011, 50, 9928–9935. 10.1021/bi2013068. [DOI] [PMC free article] [PubMed] [Google Scholar]
- Tamjar J.; Katorcha E.; Popov A.; Malinina L. J. Biomol. Struct. Dyn. 2012, 30, 505–523. 10.1080/07391102.2012.687517. [DOI] [PubMed] [Google Scholar]
- Parkesh R.; Fountain M.; Disney M. D. Biochemistry 2011, 50, 599–601. 10.1021/bi101896j. [DOI] [PMC free article] [PubMed] [Google Scholar]
- Childs-Disney J. L.; Hoskins J.; Rzuczek S. G.; Thornton C. A.; Disney M. D. ACS Chem. Biol. 2012, 7, 856–862. 10.1021/cb200408a. [DOI] [PMC free article] [PubMed] [Google Scholar]
- Parkesh R.; Childs-Disney J. L.; Nakamori M.; Kumar A.; Wang E.; Wang T.; Hoskins J.; Tran T.; Housman D.; Thornton C. A.; Disney M. D. J. Am. Chem. Soc. 2012, 134, 4731–4742. 10.1021/ja210088v. [DOI] [PMC free article] [PubMed] [Google Scholar]
- Childs-Disney J. L.; Stepniak-Konieczna E.; Tran T.; Yildirim I.; Park H.; Chen C. Z.; Hoskins J.; Southall N.; Marugan J. J.; Patnaik S.; Zheng W.; Austin C. P.; Schatz G. C.; Sobczak K.; Thornton C. A.; Disney M. D. Nat. Commun. 2013, 4, 2044. 10.1038/ncomms3044. [DOI] [PMC free article] [PubMed] [Google Scholar]
- Gareiss P. C.; Sobczak K.; McNaughton B. R.; Palde P. B.; Thornton C. A.; Miller B. L. J. Am. Chem. Soc. 2008, 130, 16254–16261. 10.1021/ja804398y. [DOI] [PMC free article] [PubMed] [Google Scholar]
- Arambula J. F.; Ramisetty S. R.; Baranger A. M.; Zimmerman S. C. Proc. Natl. Acad. Sci. U. S. A. 2009, 106, 16068–16073. 10.1073/pnas.0901824106. [DOI] [PMC free article] [PubMed] [Google Scholar]
- Ofori L. O.; Hoskins J.; Nakamori M.; Thornton C. A.; Miller B. L. Nucleic Acids Res. 2012, 40, 6380–6390. 10.1093/nar/gks298. [DOI] [PMC free article] [PubMed] [Google Scholar]
- Kumar A.; Parkesh R.; Sznajder L. J.; Childs-Disney J. L.; Sobczak K.; Disney M. D. ACS Chem. Biol. 2012, 7, 496–505. 10.1021/cb200413a. [DOI] [PMC free article] [PubMed] [Google Scholar]
- Yildirim I.; Park H.; Disney M. D.; Schatz G. C. J. Am. Chem. Soc. 2013, 135, 3528–3538. 10.1021/ja3108627. [DOI] [PMC free article] [PubMed] [Google Scholar]
- Childs-Disney J. L.; Yildirim I.; Park H.; Lohman J. R.; Guan L.; Tran T.; Sarkar P.; Schatz G. C.; Disney M. D. ACS Chem. Biol. 2014, 9, 538–550. 10.1021/cb4007387. [DOI] [PMC free article] [PubMed] [Google Scholar]
- Teplova M.; Patel D. J. Nat. Struct. Mol. Biol. 2008, 15, 1343–1351. 10.1038/nsmb.1519. [DOI] [PMC free article] [PubMed] [Google Scholar]
- Yildirim I.; Stern H. A.; Kennedy S. D.; Tubbs J. D.; Turner D. H. J. Chem. Theory Comput. 2010, 6, 1520–1531. 10.1021/ct900604a. [DOI] [PMC free article] [PubMed] [Google Scholar]
- Case D. A.; Darden T. A.; Cheatham T. E. I.; Simmerling C. L.; Wang J.; Duke R. E.; Luo R.; Walker R. C.; Zhang W.; Merz K. M.; Roberts B.; Hayik S.; Roitberg A.; Seabra G.; Swails J.; Götz A. W.; Kolossváry I.; Wong K. F.; Paesani F.; Vanicek J.; Wolf R. M.; Liu J.; Wu X.; Brozell S. R.; Steinbrecher T.; Gohlke H.; Cai Q.; Ye X.; Wang J.; Hsieh M.-J.; Cui G.; Roe D. R.; Mathews D. H.; Seetin M. G.; Salomon-Ferrer R.; Sagui C.; Babin V.; Luchko T.; Gusarov S.; Kovalenko A.; Kollman P. A.. AMBER 12; University of California, San Francisco: San Francisco, CA, 2012. [Google Scholar]
- Joung I. S.; Cheatham T. E. J. Phys. Chem. B 2008, 112, 9020–9041. 10.1021/jp8001614. [DOI] [PMC free article] [PubMed] [Google Scholar]
- Jorgensen W. L.; Chandrasekhar J.; Madura J. D.; Impey R. W.; Klein M. L. J. Chem. Phys. 1983, 79, 926–935. 10.1063/1.445869. [DOI] [Google Scholar]
- Cornell W. D.; Cieplak P.; Bayly C. I.; Gould I. R.; Merz K. M.; Ferguson D. M.; Spellmeyer D. C.; Fox T.; Caldwell J. W.; Kollman P. A. J. Am. Chem. Soc. 1995, 117, 5179–5197. 10.1021/ja00124a002. [DOI] [Google Scholar]
- Perez A.; Marchan I.; Svozil D.; Sponer J.; Cheatham T. E.; Laughton C. A.; Orozco M. Biophys. J. 2007, 92, 3817–3829. 10.1529/biophysj.106.097782. [DOI] [PMC free article] [PubMed] [Google Scholar]
- Yildirim I.; Kennedy S. D.; Stern H. A.; Hart J. M.; Kierzek R.; Turner D. H. J. Chem. Theory Comput. 2012, 8, 172–181. 10.1021/ct200557r. [DOI] [PMC free article] [PubMed] [Google Scholar]
- Yildirim I.; Stern H. A.; Tubbs J. D.; Kennedy S. D.; Turner D. H. J. Phys. Chem. B 2011, 115, 9261–9270. 10.1021/jp2016006. [DOI] [PMC free article] [PubMed] [Google Scholar]
- Banas P.; Hollas D.; Zgarbova M.; Jurecka P.; Orozco M.; Cheatham T. E.; Sponer J.; Otyepka M. J. Chem. Theory Comput. 2010, 6, 3836–3849. 10.1021/ct100481h. [DOI] [PMC free article] [PubMed] [Google Scholar]
- Deb I.; Sarzynska J.; Nilsson L.; Lahiri A. J. Chem. Inf. Model. 2014, 54, 1129–1142. 10.1021/ci400582a. [DOI] [PubMed] [Google Scholar]
- Condon D. E.; Yildirim I.; Kennedy S. D.; Mort B. C.; Kierzek R.; Turner D. H. J. Phys. Chem. B 2014, 118, 1216–1228. 10.1021/jp408909t. [DOI] [PMC free article] [PubMed] [Google Scholar]
- Condon D. E.; Kennedy S. D.; Mort B. C.; Kierzek R.; Yildirim I.; Turner D. H. J. Chem. Theory Comput. 2015, 11, 2729–2742. 10.1021/ct501025q. [DOI] [PMC free article] [PubMed] [Google Scholar]
- Tubbs J. D.; Condon D. E.; Kennedy S. D.; Hauser M.; Bevilacqua P. C.; Turner D. H. Biochemistry 2013, 52, 3390–3392. 10.1021/bi400401j. [DOI] [PMC free article] [PubMed] [Google Scholar]
- Ryckaert J. P.; Ciccotti G.; Berendsen H. J. C. J. Comput. Phys. 1977, 23, 327–341. 10.1016/0021-9991(77)90098-5. [DOI] [Google Scholar]
- Humphrey W.; Dalke A.; Schulten K. J. Mol. Graphics 1996, 14, 33–38. 10.1016/0263-7855(96)00018-5. [DOI] [PubMed] [Google Scholar]
- Wales D. J. Mol. Phys. 2002, 100, 3285–3305. 10.1080/00268970210162691. [DOI] [Google Scholar]
- Wales D. J. Mol. Phys. 2004, 102, 891–908. 10.1080/00268970410001703363. [DOI] [Google Scholar]
- Evans D. A.; Wales D. J. J. Chem. Phys. 2004, 121, 1080–1090. 10.1063/1.1759317. [DOI] [PubMed] [Google Scholar]
- Farrell J. D.; Lines C.; Shepherd J. J.; Chakrabarti D.; Miller M. A.; Wales D. J. Soft Matter 2013, 9, 5407–5416. 10.1039/c3sm50711d. [DOI] [Google Scholar]
- Chakraborty D.; Collepardo-Guevara R.; Wales D. J. J. Am. Chem. Soc. 2014, 136, 18052–18061. 10.1021/ja5100756. [DOI] [PubMed] [Google Scholar]
- Doye J. P. K.; Miller M. A.; Wales D. J. J. Chem. Phys. 1999, 110, 6896–6906. 10.1063/1.478595. [DOI] [Google Scholar]
- Wales D. J.Energy Landscapes; Cambridge University Press: U.K., 2003. [Google Scholar]
- Somani S.; Wales D. J. J. Chem. Phys. 2013, 139, 121909. 10.1063/1.4813627. [DOI] [PubMed] [Google Scholar]
- Liu D. C.; Nocedal J. Math. Program. 1989, 45, 503–528. 10.1007/BF01589116. [DOI] [Google Scholar]
- Wales D. J.; Miller M. A.; Walsh T. R. Nature 1998, 394, 758–760. 10.1038/29487. [DOI] [Google Scholar]
- Becker O. M.; Karplus M. J. Chem. Phys. 1997, 106, 1495–1517. 10.1063/1.473299. [DOI] [Google Scholar]
- Krivov S. V.; Karplus M. J. Chem. Phys. 2002, 117, 10894–10903. 10.1063/1.1517606. [DOI] [Google Scholar]
- Strodel B.; Whittleston C. S.; Wales D. J. J. Am. Chem. Soc. 2007, 129, 16005–16014. 10.1021/ja075346p. [DOI] [PubMed] [Google Scholar]
- Wales D. J.PATHSAMPLE: A program for generating connected stationary point databases and extracting global kinetics. http://www-wales.ch.cam.ac.uk/PATHSAMPLE (accessed March 31, 2015).
- Strodel B.; Wales D. J. Chem. Phys. Lett. 2008, 466, 105–115. 10.1016/j.cplett.2008.10.085. [DOI] [Google Scholar]
- Hoare M. R.; McInnes J. Faraday Discuss. Chem. Soc. 1976, 61, 12–24. 10.1039/dc9766100012. [DOI] [Google Scholar]
- Hoare M. R. In Advances in Chemical Physics; Prigogine I., Rice S. A., Eds.; John Wiley & Sons, Inc.: Hoboken, NJ, U.S.A., 1979; Vol. 40, pp 49–135. [Google Scholar]
- Roux B. Comput. Phys. Commun. 1995, 91, 275–282. 10.1016/0010-4655(95)00053-I. [DOI] [Google Scholar]
- Kumar S.; Rosenberg J. M.; Bouzida D.; Swendsen R. H.; Kollman P. A. J. Comput. Chem. 1995, 16, 1339–1350. 10.1002/jcc.540161104. [DOI] [Google Scholar]
- Grossfield A. WHAM: The weighted histogram analysis method, 2.0.4. http://membrane.urmc.rochester.edu/content/wham, 2010.
- Lu X. J.; Olson W. K. Nat. Protoc. 2008, 3, 1213–1227. 10.1038/nprot.2008.104. [DOI] [PMC free article] [PubMed] [Google Scholar]
- Wales D. J. J. Chem. Phys. 2009, 130, 204111. 10.1063/1.3133782. [DOI] [PubMed] [Google Scholar]
- Carr J. M.; Wales D. J. J. Phys. Chem. B 2008, 112, 8760–8769. 10.1021/jp801777p. [DOI] [PubMed] [Google Scholar]
- Wales D. J.; Salamon P. Proc. Natl. Acad. Sci. U. S. A. 2014, 111, 617–622. 10.1073/pnas.1319599111. [DOI] [PMC free article] [PubMed] [Google Scholar]
- Krivov S. V.; Karplus M. J. Phys. Chem. B 2006, 110, 12689–12698. 10.1021/jp060039b. [DOI] [PubMed] [Google Scholar]
- Krivov S. V.; Karplus M. Proc. Natl. Acad. Sci. U. S. A. 2004, 101, 14766–14770. 10.1073/pnas.0406234101. [DOI] [PMC free article] [PubMed] [Google Scholar]
- Chen A. A.; Garcia A. E. Proc. Natl. Acad. Sci. U. S. A. 2013, 110, 16820–16825. 10.1073/pnas.1309392110. [DOI] [PMC free article] [PubMed] [Google Scholar]
- Sobczak K.; de Mezer M.; Michlewski G.; Krol J.; Krzyzosiak W. J. Nucleic Acids Res. 2003, 31, 5469–5482. 10.1093/nar/gkg766. [DOI] [PMC free article] [PubMed] [Google Scholar]
- Banavali N. K.; MacKerell A. D. J. Mol. Biol. 2002, 319, 141–160. 10.1016/S0022-2836(02)00194-8. [DOI] [PubMed] [Google Scholar]
- Song K.; Campbell A. J.; Bergonzo C.; de los Santos C.; Grollman A. P.; Simmerling C. J. Chem. Theory Comput. 2009, 5, 3105–3113. 10.1021/ct9001575. [DOI] [PMC free article] [PubMed] [Google Scholar]
- Priyakumar U. D.; MacKerell A. D. Chem. Rev. 2006, 106, 489–505. 10.1021/cr040475z. [DOI] [PubMed] [Google Scholar]
- Miller M.; Wales D. J.; de Souza V. disconnectionDPS. http://www-wales.ch.cam.ac.uk/software.html (accessed March 31, 2015).
- Wales D. J.; Head-Gordon T. J. Phys. Chem. B 2012, 116, 8394–8411. 10.1021/jp211806z. [DOI] [PubMed] [Google Scholar]
- Carr J. M.; Wales D. J. In Latest Advances in Atomic Cluster Collisions; Connerade J. P., Solov’yov A., Eds.; Imperial College Press: London, 2008; pp 321–330. [Google Scholar]
- Jiménez V. M.; Marzal A. In Algorithm Engineering; Vitter J. S., Zaroliagis C. D., Eds.; Springer: Berlin, Heidelberg, 1999; Vol. 1668, pp 15–29. [Google Scholar]
- Cass D.; Hotchko R.; Barber P.; Jones K.; Gates D. P.; Berglund J. A. BMC Mol. Biol. 2011, 10.1186/1471-2199-12-20. [DOI] [PMC free article] [PubMed] [Google Scholar]
- Lee J. E.; Cooper T. A. Biochem. Soc. Trans. 2009, 37, 1281–1286. 10.1042/BST0371281. [DOI] [PMC free article] [PubMed] [Google Scholar]
- Lin X. Y.; Miller J. W.; Mankodi A.; Kanadia R. N.; Yuan Y.; Moxley R. T.; Swanson M. S.; Thornton C. A. Hum. Mol. Genet. 2006, 15, 2087–2097. 10.1093/hmg/ddl132. [DOI] [PubMed] [Google Scholar]
- Fu Y.; Ramisetty S. R.; Hussain N.; Baranger A. M. ChemBioChem 2012, 13, 112–119. 10.1002/cbic.201100487. [DOI] [PMC free article] [PubMed] [Google Scholar]
- Vanegas P. L.; Hudson G. A.; Davis A. R.; Kelly S. C.; Kirkpatrick C. C.; Znosko B. M. Nucleic Acids Res. 2012, 40, D439–D444. 10.1093/nar/gkr943. [DOI] [PMC free article] [PubMed] [Google Scholar]
- Pushechnikov A.; Lee M. M.; Childs-Disney J. L.; Sobczak K.; French J. M.; Thornton C. A.; Disney M. D. J. Am. Chem. Soc. 2009, 131, 9767–9779. 10.1021/ja9020149. [DOI] [PMC free article] [PubMed] [Google Scholar]
- Tubbs J. D.; Condon D. E.; Kennedy S. D.; Hauser M.; Bevilacqua P. C.; Turner D. H. Biochemistry 2013, 52, 996–1010. 10.1021/bi3010347. [DOI] [PMC free article] [PubMed] [Google Scholar]
- Kuhrova P.; Banas P.; Best R. B.; Sponer J.; Otyepka M. J. Chem. Theory Comput. 2013, 9, 2115–2125. 10.1021/ct301086z. [DOI] [PubMed] [Google Scholar]
Associated Data
This section collects any data citations, data availability statements, or supplementary materials included in this article.