Abstract
Objectives
Study the time development of methicillin-resistant Staphylococcus aureus (MRSA) and forecast future behaviour. The major question: Is the number of MRSA isolates in Norway increasing and will it continue to increase?
Design
Time trend analysis using non-stationary γ-Poisson distributions.
Setting
Two data sets were analysed. The first data set (data set I) consists of all MRSA isolates collected in Oslo County from 1997 to 2010; the study area includes the Norwegian capital of Oslo and nearby surrounding areas, covering approximately 11% of the Norwegian population. The second data set (data set II) consists of all MRSA isolates collected in Health Region East from 2002 to 2011. Health Region East consists of Oslo County and four neighbouring counties, and is the most populated area of Norway.
Participants
Both data sets I and II consist of all persons in the area and time period described in the Settings, from whom MRSA have been isolated.
Primary and secondary outcome measures
MRSA infections have been mandatory notifiable in Norway since 1995, and MRSA colonisation since 2004. In the time period studied, all bacterial samples in Norway have been sent to a medical microbiological laboratory at the regional hospital for testing. In collaboration with the regional hospitals in five counties, we have collected all MRSA findings in the South-Eastern part of Norway over long time periods.
Results
On an average, a linear or exponential increase in MRSA numbers was observed in the data sets. A Poisson process with increasing intensity did not capture the dispersion of the time series, but a γ-Poisson process showed good agreement and captured the overdispersion. The numerical model showed numerical internal consistency.
Conclusions
In the present study, we find that the number of MRSA isolates is increasing in the most populated area of Norway during the time period studied. We also forecast a continuous increase until the year 2017.
Keywords: IMMUNOLOGY, MICROBIOLOGY
Strengths and limitations of this study.
The strength of this study is the advanced time series development used.
The limitations of this study: The data were collected from five different hospitals. However, a difference in the way data was retrieved is unlikely as the data extraction was quite straightforward. Temporarily increased detection and screening may result in more methicillin-resistant Staphylococcus aureus (MRSA) being identified over shorter periods of time, thereby creating bias in our estimates of MRSA over time. Our model is based on a Poisson or γ-Poisson distribution, with exponential/linear/power time functions that are estimated by the least square fit method. The maximum likelihood principle may have been applied instead of the least square method used here. To account for the strong bursting behaviour in MRSA, we may consider, as other alternatives, different time estimators of λ(t). One possibility, for instance, is to include deterministic low frequency components. Yet another possibility is to apply different stochastic processes, for instance, generated by stochastic differential equations. However, a more realistic model is difficult to construct unless we know more about the biological or administrative reasons for the bursting behaviour. Lastly our forecast depends on the choice of a linear or exponential model or power for the time trend. However, all functions show an increasing trend.
Introduction
The bacterium Staphylococcus aureus (S. aureus) is part of the human flora, colonising about a third of the world's population.1 S. aureus has the ability to quickly develop resistance to antimicrobial agents.2 When acquiring the resistance gene mecA, the bacterium is called methicillin-resistant Staphylococcus aureus (MRSA), and the acquisition results in resistance to all β-lactam antibiotics. MRSA is globally spread and contributes significantly to medical treatment failures and deaths.3 MRSA is one of the antibiotic-resistant bacteria having the most impact on human health, being responsible for over 80 000 severe infections and over 11 000 deaths per year in the USA alone, and accounting for more than one-half of the nosocomial S. aureus strains in most Asian countries.4
In Norway, MRSA infections became mandatory notifiable in 1995 and its incidence has been monitored closely ever since. Today, the incidence is still rather rare with 0.029% of the population being infected in 2013 (http://www.msis.no, http://www.ssb.no). Despite the low incidence, both official numbers from the Norwegian National Institute of Public Health (NIPH) and several studies reveal an increasing incidence of MRSA in Norway during the past two decades (http://www.msis.no).5–9 Our group recently published a study on the proportion of methicillin-resistance in S. aureus isolates regardless of infection type in the most populated area of Norway over a 13 year long time period.9 The analyses revealed a non-linear increase in the proportion of MRSA in the time period 1997 to 2010, while the proportion of S. aureus (MRSA and methicillin-sensitive S. aureus (MSSA)) remained relatively stable. The largest increase of MRSA is found in the community setting which could indicate an increased import of MRSA from abroad or MRSA becoming endemic in Norway. The Norwegian MRSA infection control guidelines were introduced and updated in 2004 and 2009, respectively.10 11 The guidelines follow a ‘search and destroy’ policy with a primary focus on the hospital settings. The main changes in the updated vision of the guidelines were broader and more detailed guidelines for the handling of MRSA-infected persons in healthcare services outside hospitals. The introduction of the guidelines did not have a significant effect on the increase of methicillin-resistance in S. aureus when implemented in our last study.9
Several studies have performed time series analysis to study both the evolution of antimicrobial resistance and infection control policies,12–16 to study MRSA colonisation and infection17 18 and to study the temporal association between different variables and the incidence of MRSA infections.19 A time series analysis does not necessarily assume that the data are generated independently; the dispersion may vary with time and the time series may be governed by a trend that could have cyclical components. To check model adequacy, the use of dispersion and deviance is often used.16
In the present article, we use stochastic theory to model the occurrence of MRSA infections in Norway. We apply a non-stationary Poisson process for MRSA infections and compare it with time series of the data. To account for overdispersion in the data we applied the γ-Poisson distribution. The analyses in the present study apply MRSA counts and not, as in our recent study,9 the proportion of MRSA. This has some advantages, but also some disadvantages. The advantage is that the proportion is difficult to collect correctly; MRSA count is more trustworthy. We have collected all MRSA findings in the South-Eastern part of the country over long time periods. This makes the MRSA count in the time period studied reliable. MSSA is not mandatory notifiable in Norway, making it even more difficult to extract the MRSA proportion. However, the disadvantage is that the count of MRSA may be biased due to a varying number of tests for MRSA. It is notable that in stochastic theories it is essential how randomness is accounted for.20 Different models of the same phenomena may give different results. We apply non-stationary γ-Poisson distributions for the count of MRSA isolates in a Health Region in Norway, including exponential and linear functions to describe the temporal trends in the S. aureus isolates resistant to methicillin. We use the fitted models to make 5-year predictions on the future development of MRSA in the region over time.
Data
The data used in this paper, study area, sampling methods, inclusion parameters have been partly presented previously.9 We have extended the study period by 3 years for data set II. To summarise: Two data sets were analysed. The first data set (data set I) consists of all MRSA isolates collected in Oslo County from 1997 to 2010; the study area includes the Norwegian capital of Oslo and nearby surrounding areas, covering approximately 11% of the Norwegian population. The second data set (data set II) consists of all MRSA isolates collected in Health Region East from 2002 to 2011. Health Region East consists of Oslo County and four neighbouring counties and is the most populated area of Norway; it includes many large and small cities and rural areas, and covers approximately 36% of the Norwegian population. MRSA isolates from Oslo County are included in both data sets, but due to the use of two different databases for extraction of data, SWISSLAB (Swisslab, GmbH, Berlin, Germany) for data set I and MICLIS (Miclis AS, Lillehammer, Norway) for data set II, and due to other factors outlined and discussed in our previous paper,9 the two data sets for Oslo county could not be combined.
A model for the number of MRSA
Let t be the continuous time variable. We model the monthly reported number of MRSA isolates as a random variable  , where
  , is an index variable for each month during the study period. Mostly we measure time from a specific time point. Thus, we let
  . In figures where year is used we let the year be defined by
  , where
  is the number of the month in the year when the study starts.
  is the year the study starts. For simplicity, we write
  instead of
  in the formulas.
The strategy for constructing a feasible stochastic process should be based on a three-step iterative cycle. The first is model identification, the second is model estimation and finally, the diagnostic checks on model adequacy.
Model identification
The Poisson process is a natural starting point for count data analysis. The non-stationary Poisson process is the next step when modelling non-stationary processes, though it is often inadequate due to overdispersion.21 Overdispersion may be due to unobserved heterogeneity, may arise because the process of generating the first events may differ from that determining later events (hurdle model or non-stationary model), or may arise due to the failure of the assumption of independence of events. The probability  of observing
  is assumed to be a non-stationary Poisson distribution according to:
 |
1 |
where ‘mod’ refers to the model assumption. We note that  is assumed to depend on time. The expectation (mean) and variance is found to be:
| 2 |
We let  and
and  denote the expectation and the variance.
In principle, by studying an infinite number of realisations of  ,
,  is simply given by
  . However, we have only one non-stationary time series
  available for use and in addition, only a finite number of time points. Consequently, we construct an estimator
  for
for  that is as simple as possible, but which still gives a good representation of the available data. However, there is no unique method for the construction of such an estimator and as a first hypothesis,
  is set to be deterministic. We apply a least square fit (LSF) and compare different functional representations for the time trend of
  : an exponential function and a linear function. Linear regression is commonly used, but may not be the most appropriate for count data, which are non-negative integers. Essentially exponential growth occurs in two different ways: If an entity is self-reproducing, then exponential growth is inherent. If an entity is driven by something else that is growing exponentially, then its’ growth is derived.
Model estimation
In this model estimation section, we establish the parameters of the stochastic model that is used for forecast. The realisation of the stochastic process in equation (3) is used to compare with the given data and for forecast.
We apply a LSF of the data of  of MRSA to find the estimator
  of the expectation. We construct the realisations based on the estimator
  :
:
| 3 |
Equation (3) gives the simulated number of MRSA for each month where we numerically draw a random number from a Poisson distribution with intensity parameter  that varies with time.
Diagnostic checks on model adequacy and overdispersion
As the first check on the least square fit estimator, we simulate one time series by considering  as input. We calculate
  and apply the LSF to find
  , which is compared with
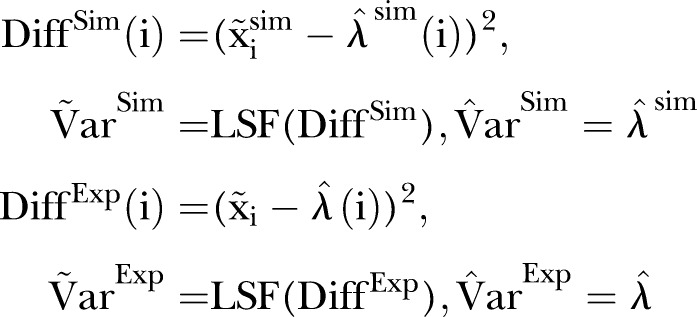
  . Further to test model adequacy and dispersion we calculate
 |
4 |
Here  is the measured number of MRSA counts, and
  is the simulated number of MRSA counts.
  is the LSF to the squared difference between the MRSA data and the estimated intensity based on the MRSA data.
  is the LSF to the squared difference between the simulated data and the estimated intensity based on the simulated data.
Good model adequacy gives  ,
,  . However, overdispersion in the data gives
  which we account for by adopting a γ-Poisson distribution (also called negative binomial model), which is a common choice for capturing overdispersion in the Poisson distribution.22 This means that we let the
  in the Poisson distribution be stochastic according to the γ distribution. The overdispersion in our data may be due to failure of the assumption of independence or correlation of events. Indeed, particular assumptions of observed heterogeneity due to dependence and correlation lead to the γ-Poisson distribution.23 In general, we believe that the overdispersion is due to individuals acting as a group (ie, epidemic outbreaks). However, individual responses to covariates, such as dates, may also be an explanation.
The γ distribution has two parameters called  and
and  (see online supplementary appendix A). It can be shown that (see for instance online supplementary appendix A) equation (2) becomes
 |
5 |
Here  (often denoted by r) is the scale factor and
  (often denoted by
  ) is the shape factor. When
  and
and  approach infinity, the overdispersion approaches zero. To construct an estimator for
  and
and  , we apply
 |
6 |
Thus, altogether we use two different LSFs to find  . One for
  based on the LSF to
  , and one for
  based on the LSF to
  . As a final test of the algorithm, we generate data by applying the γ-Poisson distribution with parameters
  . From these data we calculate the dispersion for comparison with
  .
.
The simulations were performed in Mathematica 8 (Wolfram Research Inc, Champaign, Illinois, USA).
Ethics statement
The approval, from both the Norwegian Regional Committees for Medical and Health Research Ethics, South East, and the representative of privacy protection at Akershus University Hospital Trust, includes the acceptance of using microbiological data from the routine databases in the microbiological laboratories without the need for written consent. Written consent was not needed in the present study as the material used is of microbial origin only and no personally identifiable information was gathered. The information gathered from microbial data cannot be traced back to the person from whom it was collected.
Numerical and experimental results
Data set I: Oslo County, 1997–2010
Trends in identified MRSA
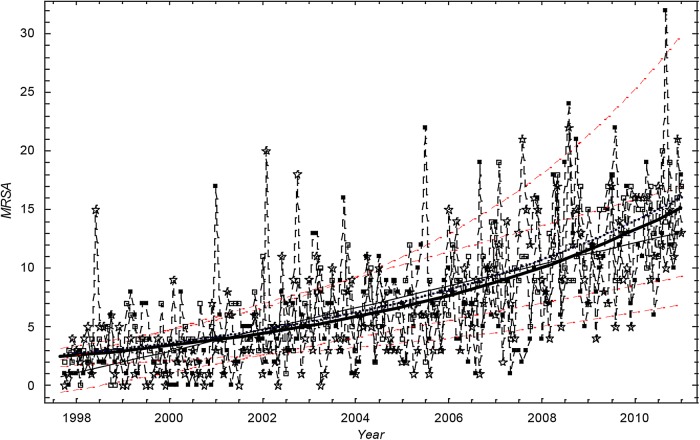
Figure 1 shows the number of cases of MRSA. The trend is increasing. The exponential function was found to give the best fit for data set I, and this was closely followed by the linear and power functions. In all cases, the choice of a linear or exponential model or power function for the time trend produced only marginally different model fits.
Figure 1.
The monthly number of methicillin-resistant Staphylococcus aureus cases in Oslo County: September 1997 to 2010. Thick black curve:  based on exponential LSF of data. Thin black curve:
  based on linear LSF of data. Red dashed curve: 95% confidence bounds for exponential and linear LSF of the data. Blue curve:
  based on exponential LSF of simulated data. ▪: Data, □: Stochastic simulation based on the Poisson distribution.⋆: Stochastic simulation based on the γ-Poisson distribution.
The mean monthly number of MRSA cases in Oslo County was estimated to increase by a factor of 5.4 in the study period, from 2.7 cases (SD 1.0–4.1) in 1997 to 14.5 cases (SD 11.0–18.8) at the end of 2010, thereby representing monthly incidence rates of 0.5 and 2.4 per 100 000 inhabitants in 1997 and 2010, respectively (population statistics from http://www.ssb.no).9
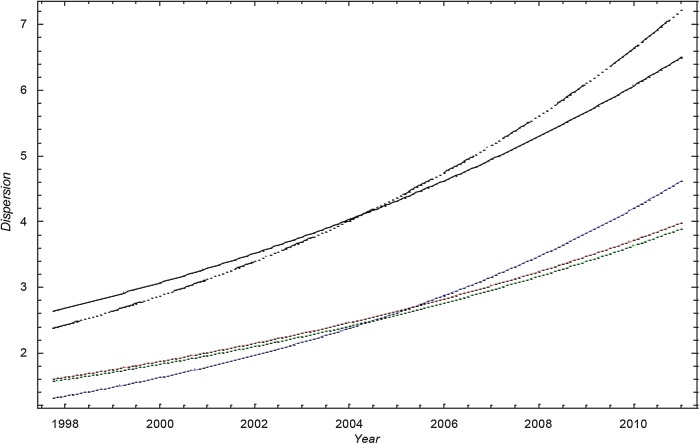
A visual inspection of figure 1 suggests that the scatter (dispersion) in the data is larger than in the simulation based on the Poisson distribution. Figures 1 and 2 show that  .
.
Figure 2.
The SD of methicillin-resistant Staphylococcus aureus cases in Oslo County: September 1997 to 2010. Blue curve:  ; Green curve:
  ; Red curve:
  ; Black curve:
  Black dashed curve: Variance calculated from simulated data by using the γ-Poisson distribution.
The dispersion of the data is significantly larger than the dispersion in the Poisson model. To account for overdispersion we use the γ-Poisson distribution. The scatter (dispersion) of γ-Poisson distribution is much more in agreement with the data (figure 1).
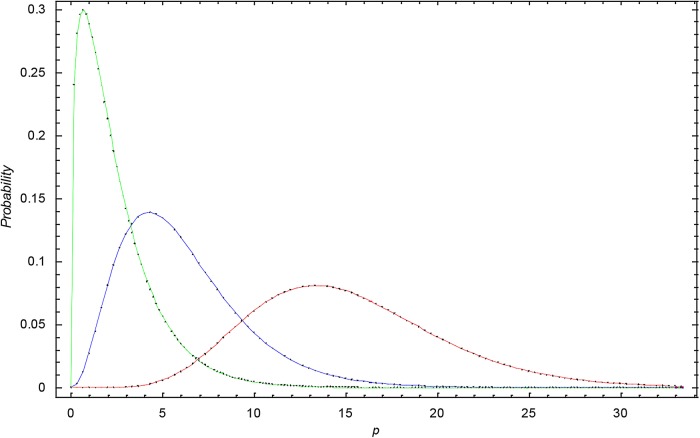
Figure 3 shows the γ-distribution for data set I for 1998, 2006 and 2010. We observe that the γ-distribution becomes broader with time and that the expectation shifts to higher p values.
Figure 3.
The γ-distribution at different times in data set I. Green curve: the γ-distribution in 1998 for data set I; Blue curve: the γ-distribution in 2005 for data set I; Red curve: the γ-distribution in 2010 for data set I.
Data set II: Health Region East, 2002–2011
Trends in identified MRSA cases
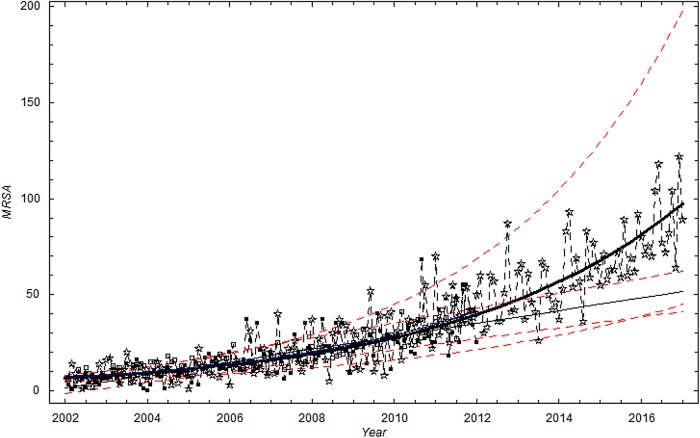
In the study period from January 2002 to December 2011 (120 months), a linear time trend was found to provide the best description of the mean monthly number of MRSA cases in Health Region East, and was marginally better compared to the power function fit and the exponential fit. However, as for data set I, the choice of a linear, exponential model or power for the time trend produced only marginally different model fits.
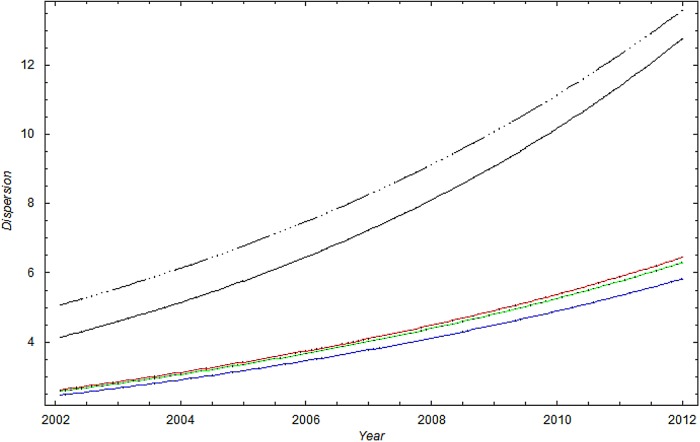
A visual inspection of figure 4 suggests that the scatter (dispersion) in the data is larger than in the simulation based on the Poisson distribution. Figures 4 and 5 show, as for data set I, the dispersion of the data is significantly larger than the dispersion in the Poisson model. To account for overdispersion, we use the γ-Poisson distribution.
Figure 4.
The monthly number of methicillin-resistant Staphylococcus aureus cases in Health Region East: 2002 to 2011. Extrapolation to 2017. Thick black curve:  based on exponential LSF of data. Thin black curve:
  based on linear LSF of data. Red dashed curve: 95% confidence bounds on exponential and linear LSF of data. ▪: Data, □: Stochastic simulation based on the Poisson distribution. ⋆: Stochastic simulation based on the γ-Poisson distribution. Extrapolation to 2017.
Figure 5.
The SD of methicillin-resistant Staphylococcus aureus cases in Health Region East: 2002 to 2011. Blue curve:  ; Green curve:
  ; Red curve:
  ; Black curve:
  ; Black dashed curve: Variance calculated from simulated data by using the γ-Poisson distribution.
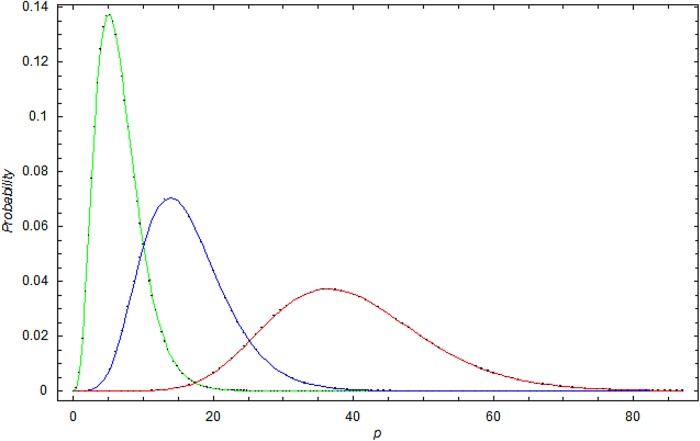
Figure 6 shows the γ distribution for data set II for 2002, 2005 and 2010. We observe that the γ distribution becomes broader with time and that the expectation shifts to higher p values. In general, the trends for data set I and data set II are much the same.
Figure 6.
The γ-distribution at different times in data set II. Green curve: the γ-distribution in 2002 for data set II; Blue curve: the γ-distribution in 2005 for data set II; Red curve: the γ-distribution in 2010 for data set II.
Forecasting
We use the model to forecast future development. Both linear and exponential extrapolation is used in our forecast. The different CIs are also highlighted in figure 4.
Conclusion
In the present study, we find that the number of MRSA isolates is increasing in the most populated areas of Norway during the time period studied. We also forecast a continuous increase until the year 2017. MRSA infections have been mandatory notifiable in Norway since 1995 and MRSA colonisation, since 2004. In the time period studied, all bacterial samples in Norway, with few exceptions, have been sent to a medical microbiological laboratory at the regional hospital for testing. In collaboration with the regional hospitals in five counties, we have collected all MRSA findings in the South-Eastern part of the country over long time periods. This makes the MRSA count in the time period studied reliable. MSSA is not mandatory notifiable making it more difficult to extract the MRSA proportion. We believe that the results from the present study both compliments and strengthen our previous work.9 The results from both studies show an increase in methicillin-resistance in S. aureus and the increase is larger than the official numbers from the Norwegian NIPH.
The causes of the increased level of methicillin-resistance found in our study area are not known, but de novo evolution from MSSA to MRSA, local establishment of MRSA or increased import from abroad could be important reasons. According to the NIPH, both domestic and import cases are increasing (http://www.msis.no). An increase in domestic cases can indicate that the bacteria have become endemic.24 Import has been seen as a major contribution to the MRSA increase in our neighbouring country, Sweden.25 26 Population mobility is seen as a main factor in globalisation of public health threats and risks, and especially in the spread of antimicrobial resistance.27 There is a vast number of persons moving large geographical distances each year for various reasons: vacation travels, medical tourists, refugees, work travels, asylum seekers, military conflicts and natural disasters. Our study area is the most densely populated area in Norway and also includes the largest airport in the country. It is also the area settling the most number of refugees and asylum seekers (http://www.imdi.no). The relatively large number of people travelling to and through the study area makes it probable and likely that MRSA is imported into the area. Previous studies from our group have revealed heterogeneity in the genetic lineages of the study area, supporting the theory of MRSA import.6 8
Bursting behaviour (dispersion) in the MRSA cases appeared more irregular throughout the time periods than expected from the Poisson stochastic model alone (figures 1 and 4). In Oslo County, several larger and smaller endemic-like outbreaks of MRSA have been documented during the study period.8 28 29 The strong bursting behaviour may be related to situations in which an MRSA carrier or infected person has been discovered at a healthcare institution. By applying a γ-Poisson distribution that accounts for overdispersion, we account for the dispersion (figures 2 and 4).
The major limitations in our study are:
The data were collected from five different hospitals. However, a difference in the way data was retrieved is unlikely as the data extraction was quite straightforward. The number of MRSA counts may depend on the population size if the intensity of the Poisson process increases with the population size. However, we have seen no sign of such a relationship. False negative probability is negligible since the sensitivity of both culture and molecular detection methods are very good.30 We believe that not testing for MRSA is by far a much larger problem.
Temporarily increased detection and screening may result in more MRSA being identified over shorter periods of time, thereby creating bias in our estimates of MRSA over time. Our model is based on a Poisson or γ-Poisson distribution, with exponential and linear time functions that are estimated by the least square fit method. The maximum likelihood principle may have been applied instead of the least square method used here. A diagnostic plot of the empirical fit of the variance using LSF on squared residuals suggested that the overdispersion in the data was significant. Other diagnostic fits may more directly underscore the maximum likelihood principle. To account for the strong bursting behaviour in MRSA, we may, as other alternatives, consider different time estimators for
 . One possibility is, for instance, to include deterministic low frequency components. Yet another possibility is to apply different stochastic processes, for instance, generated by stochastic differential equations.18 However, a more realistic model is difficult to construct unless we know more about the biological or administrative reasons for the bursting behaviour. Interhospital variability may be modelled in future research where different random effects may be accounted for separately. This will increase insight on how demographics influence MRSA development.
Lastly, our forecast depends on the choice of a linear or exponential model for the time trend. However, all functions show an increasing trend.
Acknowledgments
The authors thank the staff at the Department of Microbiology and Health Control, Akershus University Hospital Trust, Norway; Professor Kjetil Klavenes Melby of Oslo University Hospital—Ullevål; MD Anita Kanestrøm of Østfold Hospital; MD Pål Arne Jenum of Vestre Viken Hospital—Asker and Bærum, and MD Viggo Hasseltvedt and biomedical laboratory scientist Kari Ødegaard of Innlandet Hospital for kindly providing MRSA strains and statistics. The authors wish to thank Assistant Professor Birgitte Freiesleben de Blasio, Norwegian Institute of Public Health, for her much appreciated advice and discussions on the study.
Footnotes
Contributors: JFM was responsible the mathematical model. AEFM collected the data. TML constructed the study. All authors contributed to the outline of the study, discussed the results and prepared the final version of the study.
Funding: Norwegian Defence Research Establishment, Akershus University Hospital, and South-Eastern Norway Regional Health Authority (project nr. 2005162).
Competing interests: None declared.
Ethics approval: Regional Committees for Medical and Health Research Ethics, South East.
Provenance and peer review: Not commissioned; externally peer reviewed.
Data sharing statement: The full data set is available by emailing the first author of the study.
References
- 1.Wertheim HF, Melles DC, Vos MC et al. The role of nasal carriage in Staphylococcus aureus infections. Lancet Infect Dis 2005;5:751–62. 10.1016/S1473-3099(05)70295-4 [DOI] [PubMed] [Google Scholar]
- 2.Lowy FD. Antimicrobial resistance: the example of Staphylococcus aureus. J Clin Invest 2003;111:1265–73. 10.1172/JCI18535 [DOI] [PMC free article] [PubMed] [Google Scholar]
- 3.Centres for Disease Control and Prevention. Antibiotic resistance threats in the United States 2013. Atlanta, USA, 2013. [Google Scholar]
- 4.Jean SS, Hsueh PR. High burden of antimicrobial resistance in Asia. Int J Antimicrob Agents 2011;37:291–5. 10.1016/j.ijantimicag.2011.01.009 [DOI] [PubMed] [Google Scholar]
- 5.Elstrom P, Kacelnik O, Bruun T et al. Meticillin-resistant Staphylococcus aureus in Norway, a low-incidence country, 2006–2010. J Hosp Infect 2012;80:36–40. 10.1016/j.jhin.2011.10.004 [DOI] [PubMed] [Google Scholar]
- 6.Fossum AE, Bukholm G. Increased incidence of methicillin-resistant Staphylococcus aureus ST80, novel ST125 and SCCmecIV in the south-eastern part of Norway during a 12-year period. Clin Microbiol Infect 2006;12:627–33. 10.1111/j.1469-0691.2006.01467.x [DOI] [PubMed] [Google Scholar]
- 7.Hanssen AM, Fossum A, Mikalsen J et al. Dissemination of community-acquired methicillin-resistant Staphylococcus aureus clones in northern Norway: sequence types 8 and 80 predominate. J Clin Microbiol 2005;43:2118–24. 10.1128/JCM.43.5.2118-2124.2005 [DOI] [PMC free article] [PubMed] [Google Scholar]
- 8.Moen AEF, Storla DG, Bukholm G. Distribution of methicillin-resistant Staphylococcus aureus in a low-prevalence area. FEMS Immunol Med Microbiol 2010;58:374–80. [DOI] [PubMed] [Google Scholar]
- 9.Moxnes JF, de Blasio BF, Leegaard TM et al. Methicillin-Resistant Staphylococcus aureus (MRSA) is increasing in Norway: a time series analysis of reported MRSA and methicillin-sensitive S. aureus cases, 1997–2010. PLoS ONE 2013;8:e70499 10.1371/journal.pone.0070499 [DOI] [PMC free article] [PubMed] [Google Scholar]
- 10.National Institute of Public Health and The Norwegian Directorate of Health. [Infection control 10 MRSA-guidelines]. Oslo: Nordberg Trykk AS, 2004. [Google Scholar]
- 11.National Institute of Public Health and The Norwegian Directorate of Health. [Infection control 16 MRSA-guidelines]. Oslo: Nordberg Trykk AS, 2009. [Google Scholar]
- 12.Lopez-Lozano JM, Monnet DL, Yague A et al. Modelling and forecasting antimicrobial resistance and its dynamic relationship to antimicrobial use: a time series analysis. Int J Antimicrob Agents 2000;14:21–31. 10.1016/S0924-8579(99)00135-1 [DOI] [PubMed] [Google Scholar]
- 13.Muller AA, Mauny F, Bertin M et al. Relationship between spread of methicillin-resistant Staphylococcus aureus and antimicrobial use in a French university hospital. Clin Infect Dis 2003;36:971–8. 10.1086/374221 [DOI] [PubMed] [Google Scholar]
- 14.Vernaz N, Sax H, Pittet D et al. Temporal effects of antibiotic use and hand rub consumption on the incidence of MRSA and Clostridium difficile. J Antimicrob Chemother 2008;62:601–7. 10.1093/jac/dkn199 [DOI] [PubMed] [Google Scholar]
- 15.Aldeyab MA, Monnet DL, Lopez-Lozano JM et al. Modelling the impact of antibiotic use and infection control practices on the incidence of hospital-acquired methicillin-resistant Staphylococcus aureus: a time-series analysis. J Antimicrob Chemother 2008;62:593–600. 10.1093/jac/dkn198 [DOI] [PubMed] [Google Scholar]
- 16.Gebski V, Ellingson K, Edwards J et al. Modelling interrupted time series to evaluate prevention and control of infection in healthcare. Epidemiol Infect 2012;140:2131–41. 10.1017/S0950268812000179 [DOI] [PMC free article] [PubMed] [Google Scholar]
- 17.Ellingson K, Muder RR, Jain R et al. Sustained reduction in the clinical incidence of methicillin-resistant Staphylococcus aureus colonization or infection associated with a multifaceted infection control intervention. Infect Control Hosp Epidemiol 2011;32:1–8. 10.1086/657665 [DOI] [PubMed] [Google Scholar]
- 18.Feng PJI, Kallen AJ, Ellingson K et al. Clinical incidence of methicillin-resistant Staphylococcus aureus (MRSA) colonization or infection as a proxy measure for MRSA transmission in acute care hospitals. Infect Control Hosp Epidemiol 2011;32:20–5. 10.1086/657668 [DOI] [PubMed] [Google Scholar]
- 19.Bertrand X, Lopez-Lozano JM, Slekovec C et al. Temporal effects of infection control practices and the use of antibiotics on the incidence of MRSA. J Hosp Infect 2012;82:164–9. 10.1016/j.jhin.2012.07.013 [DOI] [PubMed] [Google Scholar]
- 20.Moxnes JF, Hausken K. Introducing randomness into first-order and second-order deterministic differential equations. Adv Math Phys 2010;2010:1–42. [Google Scholar]
- 21.Karlin S, Taylor HM. A first course in stochastic processes. New York: Academic Press, 1975. [Google Scholar]
- 22.Hoef JMV, Boveng PL. Quasi-poisson vs. negative binomial regression: how should we model overdispersed count data? Ecology 2007;88:2766–72. 10.1890/07-0043.1 [DOI] [PubMed] [Google Scholar]
- 23.Winkelmann R. Duration dependence and dispersion in count-data models. J Bus Econ Stat 1995;13:467–74. [Google Scholar]
- 24.Moen AEF, Tannaes TM, Leegaard TM. USA300 methicillin-resistant Staphylococcus aureus in Norway. APMIS 2013;121:1091–6. 10.1111/apm.12077 [DOI] [PubMed] [Google Scholar]
- 25.Larsson AK, Gustafsson E, Johansson PJ et al. Epidemiology of MRSA in southern Sweden: strong relation to foreign country of origin, health care abroad and foreign travel. Eur J Clin Microbiol Infect Dis 2014;33:61–8. 10.1007/s10096-013-1929-2 [DOI] [PubMed] [Google Scholar]
- 26.SWEDRES-SVARM 2012 . Use of antimicrobials and occurrence of antimicrobial resistance in Sweden. Solna/Uppsala: Swedish Institute for Communicable Disease Control and National Veterinary Institute, 2013. [Google Scholar]
- 27.MacPherson DW, Gushulak BD, Baine WB et al. Population mobility, globalization, and antimicrobial drug resistance. Emerg Infect Dis 2009;15:1727–32. [DOI] [PMC free article] [PubMed] [Google Scholar]
- 28.Andersen BM, Rasch M, Syversen G. Is an increase of MRSA in Oslo, Norway, associated with changed infection control policy?. J Hosp Infect 2007;55:531–8. 10.1016/j.jinf.2007.09.008 [DOI] [PubMed] [Google Scholar]
- 29.Leendert van der Werff HF, Steen TW, Garder KM et al. [An outbreak of MRSA in a nursing home in Oslo]. Tidsskr Nor Laegeforen 2008;128:2734–7. [PubMed] [Google Scholar]
- 30.Chambers HF, Deleo FR. Waves of resistance: Staphylococcus aureus in the antibiotic era. Nat Rev Microbiol 2009;7:629–41. 10.1038/nrmicro2200 [DOI] [PMC free article] [PubMed] [Google Scholar]


