

Abstract
Graphene, an atomically thin material with the theoretical surface area of 2600 m2g−1, has great potential in the fields of catalysis, separation, and gas storage if properly assembled into functional 3D materials at large scale. In ideal non-interacting ensembles of non-porous multilayer graphene plates, the surface area can be adequately estimated using the simple geometric law ~ 2600 m2g−1/N, where N is the number of graphene sheets per plate. Some processing operations, however, lead to secondary plate-plate stacking, folding, crumpling or pillaring, which give rise to more complex structures. Here we show that bulk samples of multilayer graphene plates stack in an irregular fashion that preserves the 2600/N surface area and creates regular slot-like pores with sizes that are multiples of the unit plate thickness. In contrast, graphene oxide deposits into films with massive area loss (2600 to 40 m2g−1) due to nearly perfect alignment and stacking during the drying process. Pillaring graphene oxide sheets by co-deposition of colloidal-phase particle-based spacers has the potential to partially restore the large monolayer surface. Surface areas as high as 1000 m2g−1 are demonstrated here through colloidal-phase deposition of graphene oxide with water-dispersible aryl-sulfonated ultrafine carbon black as a pillaring agent.
1. Introduction
Graphene oxide (GO) has widely been used as precursor for graphene-based materials synthesis [1–3]. Over the years the GO synthesis volumes have been steadily increasing, reportedly reaching as high as a ton per year [3]. There is already a large number of published few layer GO adsorption studies in which modified few layer GO is reported successfully to remove Cd (II), Co (II) [4], As (III), As (V) [5] and Hg2+ [6].
Monolayer graphene with the surface area as high as 2600 m2g−1 has great potential in the fields of catalysis, separation and gas storage if effectively converted into bulk materials [1, 7–13]. Processing graphene often leads to layer stacking and therefore to reduced surface area in bulk materials. In simple restacking processes, the surface area of the bulk material drops quickly as the number of sheets per stack increases. Today, the most common techniques to determine the graphene stack mean layer number are Raman [14–16], High-Resolution Transmission Electron Microscopy (HRTEM) and Atomic Force Microscopy (AFM) techniques [17–19] and the use of the scaling law: N = 2600/ABET. Ohba et al. 2013 [20] recently reported Monte Carlo simulations of nitrogen adsorption and recommended a method to improve upon the basic scaling law for the prediction of layer number in complex restacked graphene-derived materials. Many of the commercially advertised “graphene” materials have relatively low surface areas, often less than 200 m2g−1, and are thus properly regarded as graphite nanoplates with a layer number above 10. The commercial graphene samples with layer number less than 10 can properly be considered as multilayer graphene (MLG) samples [21]. The 2600 m2g−1/N scaling law assumes the interlayer gallery spaces are inaccessible to the probe molecules used in surface area analysis (e.g. N2, CO2). This assumption is clearly true for MLG and also for graphite nanoplates made by incomplete exfoliation of natural graphite, with its 0.335 nm layer spacing (separation of nuclear planes), but it is unclear if GO gallery spaces will be inaccessible to adsorbates under all conditions, since the nuclear-plane separations as determined by XRD can be as large as 1.2 nm [22] depending on the humidity level of GO. It is clear that some forms of reassembled and deformed graphene and GO create accessible surface area and opportunities to fabricate functional high-area bulk materials [1, 23]. It is also unclear whether bulk materials made from few- or multilayer graphene materials lose some of this 2600/N area by secondary restacking of the multilayer plates.
Thermal reduction of GO (sp3 C-O bonds) has been extensively used to partially restore the sp2 network and electrical conductivity of pristine graphene. The process of thermal exfoliation can be used to partially recover much of the GO monolayer surface area if the volatilizing gases build up internal pressure that partially exfoliates initial GO film. It seems that the highest surface areas are obtained at relatively low temperatures and at very low vacuum conditions. The reported surface areas are the following: 368 m2g−1 by [24], 758 m2g−1 by [25] and 480 m2g−1 by [9]. Yang et al., 2013 [13] has investigated the effect of heating rate on the GO porosity during thermal exfoliation of GO. The study [13] concludes that the final equilibrium exfoliation temperature and the gas environment during the exfoliation are not the main factors that support the increase of the surface area and porosity in reduced graphene oxide product, but instead the rate at which the GO is heated. For example, GO treated with the heating rate of 50 K/min resulted highly porous product, which had N2 BET surface area of 580 m2g−1 [13].
Zhu et al., 2011 [3] has reported that GO that was activated using KOH before thermal exfoliation has the BET surface area as high as 3100 m2g−1.
An alternative approach to partially regain the high surface area of monolayer graphene is to add organic or non-organic spacers that act as interlayer “pillars” to create enlarged gallery spaces that allow adsorbate access. Surface areas up to 470 m2g−1 are widely reported by many investigators for various applications when pillaring GO with boronic acid, [11] fullerenes, [26] or other inorganics and organics [8, 10, 27–29].
Despite the interest of the research community and the many individual studies we are not aware of systematic attempts to characterize surface areas and porosities in reassembled graphene-based materials. Here we present such a systematic study of the surface areas and porosities for a set of stacked, crumpled and pillared graphene and GO materials of potential interest in a variety of applications in gas storage, separation or catalysis.
2. Experimental section
2.1. Synthesis of graphene oxide, graphene oxide freestanding films, crumpled reduced graphene oxide nanoparticles and surface modified ultrafine carbon black pillared graphene oxide composites
GO was prepared according to modified Hummers method [30] including the pre-oxidation treatment. The GO sample was further purified by a two-step acid-acetone wash to remove the salt byproducts [31].
Simple freestanding GO films were made by pipetting 1–2 ml of GO solution onto a teflon surface, and then dried at room temp in the hood. After drying was complete the GO film was peeled off from the teflon surface. Altering the GO solution concentration controls the thickness of GO film.
Crumpled reduced graphene oxide (rGO) nanoparticles were synthesized by ultrasonic aerosolization of GO suspensions with varying concentrations (stock solution 1 mg/ml) to a mist of approximately 2–10 μm diameter droplets, and then suspended in 0.8 lmin−1 nitrogen gas flow as reported elsewhere [1]. The GO mist in nitrogen gas was directed to a tube furnace (operating between 70–600°C) for fast drying. After drying, the product rGO nanoparticles were captured on a polycarbonate filter.
Pillared composites of colloidally stable binary suspensions of GO and hydrophilic ultrafine carbon black (CB) were prepared by aqueous-phase deposition as follows. GO suspensions of varying concentrations were mixed with aryl-sulfonated commercial CB (Printex 90, primary particle diameter 14 nm) with negative surface charge. The well-mixed binary mixtures were first dried in laboratory oven at 70°C for 48 hours, and then heated in tube furnace at 400°C to generate the final rGO and CB composites.
2.2. Material characterizations
Quantachrome Autosorb-1 instrument was used to obtain N2 isotherms at 77K and CO2 isotherms at 273K from which the surface areas based on the Brunauer-Emmett-Teller (BET) theory and pore size distributions (PSD) based on non-local density functional theory (NLDFT) slit pore model [32, 33] were calculated. Generally the BET surface areas were calculated from N2 adsorption isotherm relative pressures ranging from 0.05 to 0.30, if nearly perfect liner BET correlation was observed. The relative pressure range in BET area calculation was slightly modified when the correlation factor R2 value was slightly off from unity. The BET surface area was recorded when linear correlation factor at least R2 =0.9999 was achieved. Morphology and surface features of assembled GO structures were studied using high-resolution transmission electron microscopy (HRTEM) and Scanning Electron Microscopy (SEM).
3. Results and Discussion
Five commercial powder samples which are classified according to [21] to be either multilayer graphene (MLG) or graphite nanoplates depending on layer number were characterized by determining their N2 BET surface areas. The corresponding graphene sheet numbers per stack were calculated using these BET surface areas based on the following simple geometric law:
| [Eq. 1] |
where N is number of sheets in a stack, 2600 is the theoretical surface area of monolayer graphene in m2g−1, and ABET is the measured BET surface area of the sample in m2g−1. Table 1 lists the N2 BET surface areas measured, together with their estimated layer numbers N calculated from surface area A according to Eq.1. This law is derived by assuming insignificant edge contribution to surface area (valid for very high aspect-ratio materials), non-porous flakes, and sufficient irregularity (including imperfections) in the plate surfaces or packing arrangements to prevent atomically-perfect face-to-face adhesion that would lead the creation of new pi-pi bonds and surface area loss.
Table 1.
Measured BET surface areas and estimated layer numbers in commercial origin multilayer graphene (MLG) and graphite nanoplates applying Eq.1.
| Commercial powder sample | Measured N2 BET area [m2g−1] | Estimated number of sheets from [Eq.1] | Number of sheets quoted by manufacturer |
|---|---|---|---|
| G1 | 675 | 3.9 | 3–5 |
| G2 | 126 | 21 | 20 |
| G3 | 187 | 14 | 10 |
| G4 | 98 | 14 | * NP |
| G5 | 26 | 100 | 20–30 |
NP - not provided
Commercial vendors do not always reveal their analysis methods, but we believe they use surface area measurements and the 2600/N scaling law, or electron microscopy in cases where graphene layer numbers are given as ranges. Raman spectroscopy can also be used to determine layer number [14–16] together with AFM or HRTEM [17–19] techniques. As in other sp2 carbons, it is the 2700 cm−1 historically G′ feature in the Raman spectrum (originating from the double resonance Raman process) which provides the number of layers in graphene sample [34]. However, Raman has its limitations. According to Ferrari et al, [16] Raman spectroscopy can successfully be applied with graphene samples with less than 5 graphenic layers, else the Raman spectrum becomes hardly distinguishable from that of bulk graphite. In addition, the AFM technique has limitation in determining graphene layer number, since it only provides and opportunity to distinguish optimally mono and bilayer graphene [16]. Our results show that the BET surface area measurement and scaling law give stack numbers with wide range of layers that compare reasonably well (see results in Table 1), and this is a simple technique not limited by layer number. Note, Ohba et al., 2013 [20] reports that the BET technique does become inaccurate for few-layer graphene layer numbers of 1 or 2 due to altered adsorption potentials on atomically thin walls, but these layer numbers are lower than any material in our commercial dataset presented in Table 1.
Bulk samples of physically assembled multilayer graphene flakes have a pore structure that was also of interest in this study. Figures 1a and 1b present the N2 isotherm and the pore size distribution (PSD) of ~ 3.5-layer commercial MLG sample G1 (measured surface area in Table 1). Figure 1c presents a geometric model we propose for aligned but irregularly positioned flakes that is consistent with the measured pore size distribution shown in Fig. 1b.
Figure 1.

a) N2 adsorption isotherm of commercial powder G1 sample with N2 BET surface area of 675 m2g−1, b) multilayer graphene G1 sample pore size distribution (PSD) obtained from N2 adsorption isotherms by applying nonlocal density functional theory (NLDFT) [31, 32] carbon slit pore model, c) a model of irregular stacking of multilayer graphene (similar to G1) when repetitive slot (rectangular) type pore spaces are created. The geometric model gives a periodic PSD with the same characteristic modes as the data (b), if the unit plate size is 1.55 nm thick, which corresponds to about 4 graphene layers per stack.
According to IUPAC classification the commercial MLG sample G1 isotherm (see Fig. 1a) is categorized as type 2 adsorption isotherm with some microporosity (pore sizes below 2 nm) and with a wide range of mesoporosity (pores from 2 nm up to 50 nm). The N2 BET surface area of this commercial MLG (G1 in Table 1) sample is 675 m2g−1, which is in close agreement with the BET surface area of 663 m2g−1 obtained from the CO2 adsorption isotherm at 273K.
The slit pore model non-local density function theory (NLDFT) PSD of the same G1 sample is offered on Fig. 1b. Here we observe an interesting periodicity in the PSD (see Fig. 1b). We hypothesize that this periodicity could be due to the irregular MLG plate stacking. If one formulates a MLG plate stacking model (similar to shown in Fig. 1c) with unknown unit plate thickness of x, then the best fit relationship to the actual PSD curve offered in Fig. 1b can provide the unknown unit stack thickness x for Fig. 1c stacking model.
After close examination of PSD observed in Fig. 1b, it seems that the sample G1 stack thickness of 1.55 nm corresponds the best to the actual PSD stack periodicity observed in Fig. 1b. The 1.55nm stack thickness would provide the following pore space periodicity: 1.55nm (x), 3.1nm (2x), 4.65nm (3x), 6.2nm (4x), 7.75nm (5x), 9.3nm (6x) and 10.85 nm (7x). Plate thickness of 1.55 nm corresponds to approximately 4 graphene layers per stack, which is in agreement with the layer number range (3 to 5) provided by the manufacturer, and with our estimated layer number obtained from the surface area scaling law. Most of the surface area that the adsorbate probe (either N2 or CO2) sees is on the outside of each stack flake, and apparently is not lost by restacking. This implies that the face-to-face contacts depicted in Fig. 1c are not in atomically-perfect alignment and are therefore not engaged in large-area pi-pi interactions that would effectively fuse adjacent stacks. The microporosity observed in the N2 adsorption isotherm (Fig. 1a) and in PSD plot (the 1 nm peak in Fig. 1b) is likely associated with these stack regions between aligned flakes that are in close contact, but where atomic step edges, impurities and grain boundaries prevent true pi-pi restacking and dramatic area loss. In summary, all of the porosity (meso- and microscale) in this multilayer graphene body originates from some form of irregular stacking of the multilayer flakes.
GO behaves differently from multi-layer graphene when deposited into bulk phases or multilayered films. We measured the surface area of GO multilayer films applying both the N2 (77K) and CO2 (273K) adsorption techniques, and observed very low surface area values. When applying the N2 adsorption technique, we were unable to detect any surface area, due to lack of sufficient sample amount for the isotherm analysis of such a low surface area material. Since this material begins in monolayer form with an area as high as A = 2600 m2g−1, the extent of surface area loss by restacking during the drying process is very large in GO films. Using the CO2 adsorption technique, we were able to make measurements above the detection limit and found the surface area to be approximately 38 m2g−1, which is a factor of 68 loss in surface area by GO restacking. We believe the surface area and those porosity differences between the multilayer graphene and GO are related to thickness and rigidity. Multilayer flakes and graphite nanoplates with the layer number from 3–20 have significant rigidity and can stack irregularly into porous materials with characteristic mesopore sizes that are multiples of the unit plate thickness, which range from 1–10 nm. The atomically thin and flexible GO, however, likely aligns by liquid crystal formulation during drying [2] to form conformal, close-packed non-porous films. After drying, any internal porosity due to spatially irregular packing as in Fig. 1c would leave to pores of characteristic size similar to dried GO monolayers, which range from 0.5–0.8nm, and are near the limit of microporosity accessible to N2 or CO2 (~0.33nm). These micropores in GO films, plus any porosity due to localized film wrinkling are likely responsible for the finite area (38 m2g−1) measured by CO2 above.
A variety of techniques have been proposed to preserve surface area by disrupting graphene and GO stacking [10, 27, 28]. One way to disrupt stacking is through folding or crumpling, which can be accomplished in a continuous process using an aerosol microdroplet drying technique [1, 35–37]. The conceptual model for the aerosol formation of crumpled reduced GO (rGO) particles is shown in Fig. 2.
Figure 2.

Conceptual model of formation of crumpled reduced graphene oxide (rGO) nanoparticles during the drying process.
During drying, there is evidence that GO sheets tend to accumulate on the surfaces of the water droplet [1]. Near the end of the evaporation process, the spherical, onion-peel-like multilayer GO film is collapsed by capillary forces into a folded GO nanoparticle with some of the characteristics of an empty nanosack [1]. The droplet surface acts as a template to guide the initial multilayer GO film formation, and the buckling from spherical geometry prevents further parallel stacking and retains a portion of the GO surface area [1].
An SEM image, N2 isotherm and NLDFT PSD for the crumpled rGO nanoparticles are shown in Figures 3a, 3b and 3c respectively. The SEM image (Fig. 3a) shows a cluster of folded sheet structures and extended creases, which have sharp edges suggesting plastic deformation during drying process.
Figure 3.

a) SEM image of folded reduced graphene oxide (rGO) nanoparticles synthesized by continuous micro-droplet drying of colloidal GO suspension, b) N2 adsorption isotherm of rGO nanoparticles, the BET areas measured by both CO2 and N2 adsorption techniques are fairly consistent: 169 m2g−1 vs 165 m2g−1 respectively, c) the non-local density function theory carbon slit pore model [31, 32] PSD of folded rGO sample, crumpled rGO particles have relatively narrow mesoporosity, pore sizes from 2 to 7 nm.
The CO2 BET surface area (A=169 m2g−1) of crumpled rGO nanoparticles is about 4.4 fold higher than dried planar GO film BET surface area (A=38 m2g−1). In comparison, the N2 BET surface area (A=165 m2g−1) of these crumpled rGO nanoparticles is nearly identical to the CO2 BET area measured, suggesting the pore structure created in crumpled rGO nanoparticles are similarly accessible for N2 at 77K and CO2 at 273K. These results suggest that the surface area can be increased when the GO nanoparticles are forced to crumple during drying process. The PSD (Fig. 3c) shows that the majority of the pores present in crumpled nanoparticle are mesopores in a relatively narrow range of from 2 to 7 nm, which are likely associated with the internal loops formed during the buckling process.
Crumpled rGO nanoparticles, such as presented in Figure 3a, have relatively uniform wall thickness. The nanoparticle wall thickness can be altered when GO stock solution concentration is varied during rGO nanoparticle synthesis. The HRETM images of two rGO nanoparticles originating from same stock (1 mg/ml) of GO, but at two different GO concentrations during rGO synthesis, are shown on Fig. 4a and 4b. Here we would like to report an interesting observation relating the rGO nanoparticle layer number obtained from HRTEM images to their measured BET surface area. As seen on Fig. 4a (adapted and modified from [1]) the crumpled rGO nanoparticle has walls composed of approximately 12 rGO sheets. The crumpled rGO nanoparticle in Fig. 4b features approximately 19 rGO sheets. The GO stock solution applied in both cases was the same, but was diluted to different GO concentration in order to obtain the varied wall thicknesses (layer number) in crumpled rGO nanoparticles. Lower GO concentration stock solution leads to fewer layers in rGO crumpled nanoparticle walls. Table 2 summarizes the results of measured BET areas, estimated layer numbers (from HRTEM images Fig. 4a and Fig. 4b), and calculated surface areas applying scaling-law, Eq.1 for two crumpled rGO nanoparticle sets examined in this work. Our experimental surface area results presented in Table 2 closely follow the surface areas calculated from rGO layer numbers when simple geometric law model (Eq.1) is applied. Results in Table 2 and Figures 4a and 4b suggest that the interlayer space gallery between each crumpled rGO sheet is not available to N2 adsorbate and the only surface area accessible is the external surface area of the crumpled multilayer structure. The accessibility of the crumpled nanoparticles was also tested with CO2 at 273K, and the surface area results were almost identical to what was observed with the N2 adsorption at 77K. In addition, the rGO nanoparticles in HRTEM images on Fig. 4a and Fig. 4b show 4 to 6 nm size (depending on the size of the crumpled rGO nanoparticle formed) clear cavity at their center, which is consistent with the findings about relatively narrow PSD observed in these nanoparticles and shown on Fig. 3c. Crumpling GO sheets certainly serves to enhance the surface area, but the vast interlayer gallery of these individuals sheets incorporated into nanoparticles is still lost.
Figure 4.
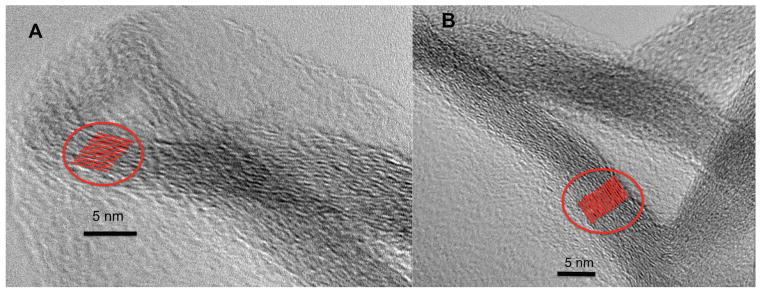
a) HRTEM image of crumpled reduced graphene oxide (rGO) nanoparticle with approximately 12 graphene oxide (GO) sheets (adapted and modified from [1]), b) HRTEM of crumpled rGO oxide nanoparticle with approximately 19 GO sheets.
Table 2.
The measured BET surface area of crumpled rGO nanoparticles and their corresponding sheet numbers estimated from the HRTEM images. The last column provides apparent surface areas estimated from the scaling law (Eq.1), where the sheet number is obtained from HRTEM Fig. 4a and Fig. 4b.
| Sample | Measured N2 BET area m2g−1 | # sheets by HRTEM | Estimated surface area from layer number, Eq. 1 m2g−1 |
|---|---|---|---|
| GO1 | 214 | ~12 | 217 |
| GO2 | 120 | ~19 | 137 |
The aerosol-based crumpling preserves some of the useful surface area, but the majority of the potential surface area remains inaccessible within the multilayer wall structures. There is great interest in other methods to prevent restacking and achieve ultrahigh areas in three-dimensional carbon bodies [8, 10, 27–29]. One class of method places spacers or pillars between the sheets to inhibit stacking. Here we synthesized binary suspensions of GO and aryl-sulfonated commercial carbon black (CB). The quality of GO encapsulation is influenced by the colloidal properties of the binary suspension used as the feedstock. The most uniform dispersion and best segregation of the sack (on outside) and cargo (on the inside) is typically achieved by engineering high surface charge of the same sign on the two components, typically through surface functionalization and control of pH in the suspension. The significant surface charge of the same sign leads to good colloidal stability and repulsive interactions between GO and the cargo (here: CB) that prevents association of the two solids until the latest stages of drying [1]. This allows diffusive segregation to occur in the early stages of drying. For this reason, the CB in this study was functionalized with aryl-sulfonate groups to provide large negative surface charge to match that of GO. After the CB and GO binary system was dried, the CB pillared rGO composites were generated, as those shown on SEM images in Figures 5a and 5b.
Figure 5.
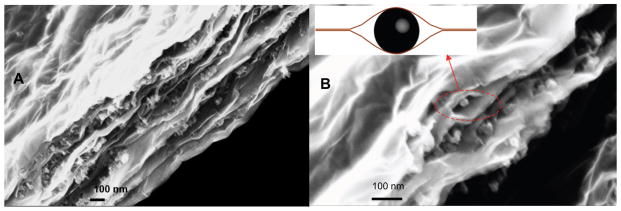
a) SEM image (section view) of reduced graphene oxide rGO sheets pillared by the CB nanoparticles and b) local “eye-like” structures in rGO and CB composites.
As seen from Figure 5a and 5b, the functional pillars are not 14 nm spheres but instead aggregates, consistent with the known secondary structure of CB materials that are fractal-like aggregates of fused primary particles. The relatively uniform dispersion and small size of these aggregates is likely the result of the aryl-sulfonation surface treatment for hydrophilicity and negative surface charge. Pillaring increases the accessibility of GO surfaces but also adds mass (of a lower area material), so we hypothesized that the specific area, A/m, must pass through a maximum at some optimal graphene-pillar mass ratio. Figures 6a and 6b show the results of systematically varying the mass ratio on total specific surface area of the CB and GO composite. The surface area of the pure dried GO is measured to be 38 m2g−1, and the surface area of pure Printex 90 CB is measured to be 158 m2g−1. At a mass ratio of 1:2 CB:GO (see Fig. 6a), the surface area of the bulk product is measured to be as high as 1006 m2g−1 due to GO pillaring effect. Thereafter, the surface area drops quickly to the pure CB surface area as the CB mass ratio increases in the binary system. We believe this is the largest surface area achieved by pillaring reported to date.
Figure 6.
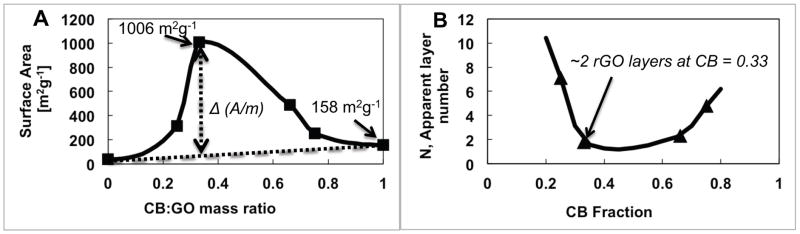
a) Pillaring effectiveness as a function of graphene-pillar mass ratio. The correlation line (obtained by applying the raw data to FlexSpline function) shows a simple additivity relationship, and the difference gives the specific functional effect of pillaring interactions, b) the apparent average graphene oxide (GO) layer number pillared with carbon black (CB) as a function of CB fraction in composite.
A simple mathematical model of the pillaring effect can be derived by assuming the composite surface area is the sum of a partially restacked GO area plus the original area of the pillaring agent itself (here CB) assumed to be unaltered by interaction with the GO, but weighted by its mass fraction in the composite;
| [Eq. 2] |
where (A/m)CB+GO is measured surface area of the composite product, (A/m)CB is measured surface area of the CB pillaring agent alone, (A/m)mlGO is the GO monolayer surface area (taken as 2600 m2g−1, and xCB and xGO corresponding mass fractions in the binary system. Based on this model, one could determine the effectiveness of pillaring as an apparent layer number, N, of residual (unpillared) stacks in the final composite and how this layer number varies as a function CB fraction. The N number equal one would correspond for ideal pillaring. The total surface areas of the composite material shown in Fig. 6a, (A/m)GO+CB, were used in Eq.2 to calculate the apparent layer number N, and its dependence on mass ratios is shown in Fig. 6b.
The apparent GO layer number reaches a value as low as 2 at a carbon black mass fraction of approximately 0.33, indicating uniform mixing of the binary colloid and high pillaring efficiency. The higher values observed at low xCB are easily explained by the low availability of CB. It is unclear at present why N increases above xCB = 0.7.
We have also investigated the PSD of the CB pillared rGO composite applying N2 adsorption isotherm data such as one presented in Fig. 7a. The PSD results are presented on Fig. 7b.
Figure 7.
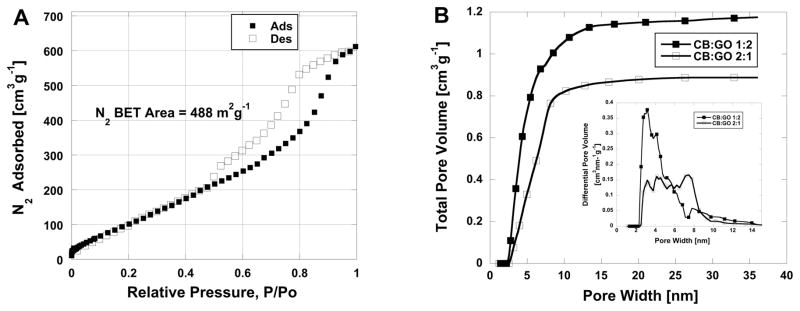
a) N2 adsorption isotherm of carbon black (CB) and graphene oxide (GO) composite with mass ratio of CB:GO 2:1, BET area of 488 m2g−1. b) Cumulative and differential (inset) non-local density function carbon slit pore model pore size distributions of carbon black (CB) and graphene oxide (GO) composites at two mass ratios 1:2 (area 1006 m2g−1) and 2:1 (area 488 m2g−1).
Our results demonstrate that the porosity generated in pillared rGO structures mainly originates from small mesopores – pore sizes from 2.3 – 10 nm, which is consistent with the eye-like spaces surrounding CB particles or aggregates in the size range from 14 nm to about 50 nm. As it shows, the enhanced surface area in CB:GO 1:2 sample is mostly originating from very narrow pore range from 2.0 to approximately 7.2 nm (see Fig. 7b). This all-mesoporous binary material with very high surface area 1006 m2g−1 offers interesting application potential in selective membranes or catalysts for environment technologies. In the future, the model may be used to tune the pore size distribution of pillared materials in a systematic way as a function of pillar size, shape, and mass fraction.
4. Conclusions
Three-dimensional assembly of 2D graphene materials can lead to a variety of porous and non-porous structures. Multilayer graphene and graphite nanoplates with layer numbers from 3–20 stack into bulk porous bodies whose pore size distributions show characteristic modes that are multiples of the unit plate thickness due to random positional stacking of aligned plates. Graphene oxide in contrast deposits from solution into multilayer bulk materials with most of the surface area lost due to restacking. The differences between graphene oxide and few layer graphene are attributed to the effects of thickness and rigidity on packing. Graphine oxide packing can be intentionally disrupted by crumpling which can enhance the available surface area from 38 m2g−1 up to 165 m2g−1. Pillaring is a more effective method than crumpling for increasing surface area, as demonstrated by our results using chemically modified ultrafine carbon black as a pillaring agent during colloidal deposition. We show the surface area of the bulk product can be increased to 1000 m2g−1 by optimal selection of the graphene oxide and carbon black mass ratio. The high surface area primarily originates from smaller size mesopores that are eye-like cavities produced when carbon black particles are partially wrapped by multilayer reduced graphene sheets, where the mean packet thickness can be as low as two monolayer reduced graphene oxide sheets. Models of the geometric structures in these perturbed plate networks are proposed, which may have use in the systematic design of porous 3D material from graphene-based building blocks.
Acknowledgments
The Superfund Research Program grant P42 ES013660 of the National Institute for Environmental Health Sciences is acknowledged for the financial support.
Footnotes
Publisher's Disclaimer: This is a PDF file of an unedited manuscript that has been accepted for publication. As a service to our customers we are providing this early version of the manuscript. The manuscript will undergo copyediting, typesetting, and review of the resulting proof before it is published in its final citable form. Please note that during the production process errors may be discovered which could affect the content, and all legal disclaimers that apply to the journal pertain.
References
- 1.Chen YT, Guo F, Jachak A, Kim SP, Datta D, Liu JY, et al. Aerosol Synthesis of Cargo-Filled Graphene Nanosacks. Nano Lett. 2012;12(4):1996–2002. doi: 10.1021/nl2045952. [DOI] [PMC free article] [PubMed] [Google Scholar]
- 2.Guo F, Kim F, Han TH, Shenoy VB, Huang JX, Hurt RH. Hydration-Responsive Folding and Unfolding in Graphene Oxide Liquid Crystal Phases. Acs Nano. 2011;5(10):8019–25. doi: 10.1021/nn2025644. [DOI] [PMC free article] [PubMed] [Google Scholar]
- 3.Zhu Y, Murali S, Stoller MD, Ganesh KJ, Cai W, Ferreira PJ, et al. Carbon-Based Supercapacitors Produced by Activation of Graphene. Science. 2011;332(6037):1537–41. doi: 10.1126/science.1200770. [DOI] [PubMed] [Google Scholar]
- 4.Zhao GX, Li JX, Ren XM, Chen CL, Wang XK. Few-Layered Graphene Oxide Nanosheets As Superior Sorbents for Heavy Metal Ion Pollution Management. Environ Sci Technol. 2011;45(24):10454–62. doi: 10.1021/es203439v. [DOI] [PubMed] [Google Scholar]
- 5.Chandra V, Park J, Chun Y, Lee JW, Hwang IC, Kim KS. Water-Dispersible Magnetite-Reduced Graphene Oxide Composites for Arsenic Removal. Acs Nano. 2010;4(7):3979–86. doi: 10.1021/nn1008897. [DOI] [PubMed] [Google Scholar]
- 6.Chandra V, Kim KS. Highly selective adsorption of Hg2+ by a polypyrrole-reduced graphene oxide composite. Chem Commun. 2011;47(13):3942–4. doi: 10.1039/c1cc00005e. [DOI] [PubMed] [Google Scholar]
- 7.Guo F, Silverberg G, Bowers S, Kim S-P, Datta D, Shenoy V, et al. Graphene-Based Environmental Barriers. Environ Sci Technol. 2012;46(14):7717–24. doi: 10.1021/es301377y. [DOI] [PMC free article] [PubMed] [Google Scholar]
- 8.Jin Z, Lu W, O’Neill KJ, Parilla PA, Simpson LJ, Kittrell C, et al. Nano-Engineered Spacing in Graphene Sheets for Hydrogen Storage. Chem Mater. 2011;23(4):923–5. [Google Scholar]
- 9.Meng L-Y, Park S-J. Effect of exfoliation temperature on carbon dioxide capture of graphene nanoplates. Journal of Colloid and Interface Science. 2012;386(1):285–90. doi: 10.1016/j.jcis.2012.07.025. [DOI] [PubMed] [Google Scholar]
- 10.Paul RK, Ghazinejad M, Penchev M, Lin JA, Ozkan M, Ozkan CS. Synthesis of a Pillared Graphene Nanostructure: A Counterpart of Three-Dimensional Carbon Architectures. Small. 2010;6(20):2309–13. doi: 10.1002/smll.201000525. [DOI] [PubMed] [Google Scholar]
- 11.Srinivas G, Burress JW, Ford J, Yildirim T. Porous graphene oxide frameworks: Synthesis and gas sorption properties. J Mater Chem. 2011;21(30):11323–9. [Google Scholar]
- 12.Stoller MD, Park SJ, Zhu YW, An JH, Ruoff RS. Graphene-Based Ultracapacitors. Nano Lett. 2008;8(10):3498–502. doi: 10.1021/nl802558y. [DOI] [PubMed] [Google Scholar]
- 13.Yang SJ, Kim T, Jung H, Park CR. The effect of heating rate on porosity production during the low temperature reduction of graphite oxide. Carbon. 2013;53(0):73–80. [Google Scholar]
- 14.Calizo I, Ghosh S, Bao W, Miao F, Ning Lau C, Balandin AA. Raman nanometrology of graphene: Temperature and substrate effects. Solid State Communications. 2009;149(27–28):1132–5. [Google Scholar]
- 15.Dresselhaus MS, Jorio A, Hofmann M, Dresselhaus G, Saito R. Perspectives on Carbon Nanotubes and Graphene Raman Spectroscopy. Nano Lett. 2010;10(3):751–8. doi: 10.1021/nl904286r. [DOI] [PubMed] [Google Scholar]
- 16.Ferrari AC, Meyer JC, Scardaci V, Casiraghi C, Lazzeri M, Mauri F, et al. Raman Spectrum of Graphene and Graphene Layers. Physical Review Letters. 2006;97(18):187401. doi: 10.1103/PhysRevLett.97.187401. [DOI] [PubMed] [Google Scholar]
- 17.Fang M, Wang K, Lu H, Yang Y, Nutt S. Single-layer graphene nanosheets with controlled grafting of polymer chains. J Mater Chem. 2010;20(10):1982–92. [Google Scholar]
- 18.Park HJ, Meyer J, Roth S, Skákalová V. Growth and properties of few-layer graphene prepared by chemical vapor deposition. Carbon. 2010;48(4):1088–94. [Google Scholar]
- 19.Ping J, Fuhrer MS. Layer Number and Stacking Sequence Imaging of Few-Layer Graphene by Transmission Electron Microscopy. Nano Lett. 2012;12(9):4635–41. doi: 10.1021/nl301932v. [DOI] [PubMed] [Google Scholar]
- 20.Ohba T, Takase A, Ohyama Y, Kanoh H. Grand canonical Monte Carlo simulations of nitrogen adsorption on graphene materials with varying layer number. Carbon. 2013;61(0):40–6. [Google Scholar]
- 21.Bianco A, Cheng H-M, Enoki T, Gogotsi Y, Hurt RH, Koratkar N, et al. All in the graphene family - a recommended nomenclature for two-dimensional carbon materials. Carbon. in press. [Google Scholar]
- 22.Buchsteiner A, Lerf A, Pieper J. Water Dynamics in Graphite Oxide Investigated with Neutron Scattering. The Journal of Physical Chemistry B. 2006;110(45):22328–38. doi: 10.1021/jp0641132. [DOI] [PubMed] [Google Scholar]
- 23.Dikin DA, Stankovich S, Zimney EJ, Piner RD, Dommett GHB, Evmenenko G, et al. Preparation and characterization of graphene oxide paper. Nature. 2007;448(7152):457–60. doi: 10.1038/nature06016. [DOI] [PubMed] [Google Scholar]
- 24.Lv W, Tang D-M, He Y-B, You C-H, Shi Z-Q, Chen X-C, et al. Low-Temperature Exfoliated Graphenes: Vacuum-Promoted Exfoliation and Electrochemical Energy Storage. Acs Nano. 2009;3(11):3730–6. doi: 10.1021/nn900933u. [DOI] [PubMed] [Google Scholar]
- 25.Zhang H-B, Wang J-W, Yan Q, Zheng W-G, Chen C, Yu Z-Z. Vacuum-assisted synthesis of graphene from thermal exfoliation and reduction of graphite oxide. J Mater Chem. 2011;21(14):5392–7. [Google Scholar]
- 26.Spyrou K, Kang L, Diamanti EK, Gengler RY, Gournis D, Prato M, et al. A novel route towards high quality fullerene-pillared graphene. Carbon. 2013;61(0):313–20. [Google Scholar]
- 27.Dimitrakakis GK, Tylianakis E, Froudakis GE. Pillared Graphene: A New 3-D Network Nanostructure for Enhanced Hydrogen Storage. Nano Lett. 2008;8(10):3166–70. doi: 10.1021/nl801417w. [DOI] [PubMed] [Google Scholar]
- 28.Wesolowski RP, Terzyk AP. Pillared graphene as a gas separation membrane. Physical Chemistry Chemical Physics. 2011;13(38):17027–9. doi: 10.1039/c1cp21590f. [DOI] [PubMed] [Google Scholar]
- 29.Zhang D-D, Zu S-Z, Han B-H. Inorganic–organic hybrid porous materials based on graphite oxide sheets. Carbon. 2009;47(13):2993–3000. [Google Scholar]
- 30.Hummers WS, Offeman RE. Preparation of Graphitic Oxide. Journal of the American Chemical Society. 1958;80(6):1339. [Google Scholar]
- 31.Kim F, Luo JY, Cruz-Silva R, Cote LJ, Sohn K, Huang JX. Self-Propagating Domino-like Reactions in Oxidized Graphite. Adv Funct Mater. 2010;20(17):2867–73. [Google Scholar]
- 32.Lastoskie C, Gubbins KE, Quirke N. Pore-Size Heterogeneity and the Carbon Slit Pore - a Density-Functional Theory Model. Langmuir. 1993;9(10):2693–702. [Google Scholar]
- 33.Ravikovitch PI, Vishnyakov A, Russo R, Neimark AV. Unified Approach to Pore Size Characterization of Microporous Carbonaceous Materials from N2, Ar, and CO2 Adsorption Isotherms. Langmuir. 2000;16(5):2311–20. [Google Scholar]
- 34.Malard LM, Pimenta MA, Dresselhaus G, Dresselhaus MS. Raman spectroscopy in graphene. Phys Rep. 2009;473(5–6):51–87. [Google Scholar]
- 35.Luo J, Jang HD, Sun T, Xiao L, He Z, Katsoulidis AP, et al. Compression and Aggregation-Resistant Particles of Crumpled Soft Sheets. Acs Nano. 2011;5(11):8943–9. doi: 10.1021/nn203115u. [DOI] [PubMed] [Google Scholar]
- 36.Ma X, Zachariah MR, Zangmeister CD. Crumpled Nanopaper from Graphene Oxide. Nano Lett. 2011;12(1):486–9. doi: 10.1021/nl203964z. [DOI] [PubMed] [Google Scholar]
- 37.Wang W-N, Jiang Y, Biswas P. Evaporation-Induced Crumpling of Graphene Oxide Nanosheets in Aerosolized Droplets: Confinement Force Relationship. The Journal of Physical Chemistry Letters. 2012;3(21):3228–33. doi: 10.1021/jz3015869. [DOI] [PubMed] [Google Scholar]