

Abstract
Key points
At the end of an incremental exercise to exhaustion a large functional reserve remains in the muscles to generate power, even at levels far above the power output at which task failure occurs, regardless of the inspiratory O2 pressure during the incremental exercise.
Exhaustion (task failure) is not due to lactate accumulation and the associated muscle acidification; neither the aerobic energy pathways nor the glycolysis are blocked at exhaustion.
Muscle lactate accumulation may actually facilitate early recovery after exhaustive exercise even under ischaemic conditions.
Although the maximal rate of ATP provision is markedly reduced at task failure, the resynthesis capacity remaining exceeds the rate of ATP consumption, indicating that task failure during an incremental exercise to exhaustion depends more on central than peripheral mechanisms.
Abstract
To determine the mechanisms causing task failure during incremental exercise to exhaustion (IE), sprint performance (10 s all‐out isokinetic) and muscle metabolites were measured before (control) and immediately after IE in normoxia (: 143 mmHg) and hypoxia (: 73 mmHg) in 22 men (22 ± 3 years). After IE, subjects recovered for either 10 or 60 s, with open circulation or bilateral leg occlusion (300 mmHg) in random order. This was followed by a 10 s sprint with open circulation. Post‐IE peak power output (W peak) was higher than the power output reached at exhaustion during IE (P < 0.05). After 10 and 60 s recovery in normoxia, W peak was reduced by 38 ± 9 and 22 ± 10% without occlusion, and 61 ± 8 and 47 ± 10% with occlusion (P < 0.05). Following 10 s occlusion, W peak was 20% higher in hypoxia than normoxia (P < 0.05), despite similar muscle lactate accumulation ([La]) and phosphocreatine and ATP reduction. Sprint performance and anaerobic ATP resynthesis were greater after 60 s compared with 10 s occlusions, despite the higher [La] and [H+] after 60 s compared with 10 s occlusion recovery (P < 0.05). The mean rate of ATP turnover during the 60 s occlusion was 0.180 ± 0.133 mmol (kg wet wt)−1 s−1, i.e. equivalent to 32% of leg peak O2 uptake (the energy expended by the ion pumps). A greater degree of recovery is achieved, however, without occlusion. In conclusion, during incremental exercise task failure is not due to metabolite accumulation or lack of energy resources. Anaerobic metabolism, despite the accumulation of lactate and H+, facilitates early recovery even in anoxia. This points to central mechanisms as the principal determinants of task failure both in normoxia and hypoxia, with lower peripheral contribution in hypoxia.
Abbreviations
- Cr
creatine
- d.w.
dry weight
inspired oxygen fraction
- HR
heart rate
- HRpeak
peak heart rate
- Hyp
hypoxia
- IE
incremental exercise to exhaustion
- La
lactate
- Mb
myoglobin
- Nx
normoxia
- PCr
phosphocreatine
end‐tidal CO2 pressure
end‐tidal O2 pressure
partial pressure of inspired O2
- RER
respiratory exchange ratio
haemoglobin oxygen saturation measured by pulse‐oximetry
- TOI
tissue oxygenation index
CO2 production
peak CO2 production
minute ventilation
O2 consumption
maximal O2 uptake
peak O2 uptake
- WBIE
whole‐body incremental exercise
- Wpeak‐i
instantaneous peak power output
- Wpeak‐1
peak power output using 1 s averages
- Wmax
peak power output at exhaustion during the incremental exercise test
- Wmean
mean power output during the 10 s sprints
- w.w.
wet weight
Introduction
The whole‐body incremental exercise (WBIE) test to exhaustion is probably one of the most used tests to examine the locomotor and cardiorespiratory functional capacities, and is the accepted ‘gold standard’ to determine the maximal oxygen uptake () in humans (Mitchell et al. 1958; Mitchell & Saltin, 2003). Little is known, however, about the mechanisms that lead to exhaustion during the WBIE test. The degree of fatigue increases as exercise intensity progresses and exacerbates when O2 demand exceeds O2 delivery (Koike et al. 1990; Amann & Calbet, 2008). From this point on, a progressively greater supply of energy from the glycolysis and phosphagens is required (Constantin‐Teodosiu et al. 1991), causing partial energy depletion, accumulation of metabolites, electrolyte disturbances, and increased free radical production (Westerblad & Allen, 2011; Morales‐Alamo et al. 2012, 2013), which may elicit fatigue by predominantly peripheral mechanisms (Chwalbinska‐Moneta et al. 1989; Fitts, 1994).
Information on the level of metabolic disturbances at exhaustion during WBIE is scarce (Constantin‐Teodosiu et al. 1991; van Hall et al. 2009), but the fact that muscle lactate concentration may reach 83 mmol [kg dry weight (d.w.)]−1, after 3–4 min at 90% of (Constantin‐Teodosiu et al. 1991), could indicate that even higher values may be reached during incremental exercise to exhaustion. If this is the case, then muscle lactate accumulation and the subsequent acidification could be the primary mechanisms determining task failure during WBIE (Fletcher & Hopkins, 1907; Spriet et al. 1985; Fitts, 1994).
Neurophysiological assessments (potentiated quadriceps twitches) indicate that during exercise to exhaustion in normoxia or moderate hypoxia, task failure occurs with a similar degree of peripheral muscle fatigue (Amann et al. 2007). Based on this, it has been postulated that exercise fatigue is regulated to avoid surpassing a critical threshold of peripheral muscle fatigue (Amann & Dempsey, 2008; Hureau et al. 2014), to protect organ systems from damage (Noakes et al. 2004). These observations support the concept that during WBIE to exhaustion, at least in normoxia, task failure is ultimately due to peripheral mechanisms (Amann et al. 2007). Nevertheless, the fact that the level of peripheral fatigue assessed by potentiated quadriceps twitches is greater during normoxic exercise with a small muscle mass than during whole‐body exercise (Rossman et al. 2012) could indicate that at task failure during WBIE in normoxia the level of peripheral fatigue is not maximal and that substantial contractile functional reserve remains. In fact, the contribution of lactate and H+ accumulation to muscle fatigue has been challenged (Allen & Westerblad, 2004; Pedersen et al. 2004), but conclusive data in humans is lacking.
Therefore, this investigation had three aims. First, to determine whether task failure at the end of a WBIE is due to the accumulation of muscle lactate and H+, and/or reduced availability of energy resources; second, to determine if partial recovery of power output is possible without muscle oxygenation and without resynthesis of phosphocreatine (PCr); and finally, to quantify the magnitude of functional energy reserve remaining at exhaustion.
In this study, muscle biopsies from the vastus lateralis were taken before and at the end of whole‐body incremental exercise in normoxia and severe hypoxia (partial pressure of inspired O2, ∼73 mmHg). To avoid recovery of energy substrates and resynthesis of phosphocreatine (Harris et al. 1976; Blei et al. 1993; Quistorff et al. 1993), a cuff was inflated instantaneously at 300 mmHg around the thighs to completely occlude the circulation at task failure, i.e. at exhaustion during the incremental exercise. Ten seconds after the end of the test a muscle biopsy was obtained from the occluded leg, which was followed by another biopsy 50 s later. In separate experiments, the same protocol was repeated by the same volunteers, but rather than obtaining a muscle biopsy the subjects were requested to sprint maximally to determine the amount of peak and mean power output remaining from that measured under rested conditions with a similar sprint. The effect of open versus occluded recovery on performance was also examined in another group of volunteers.
We aimed to test the hypotheses: (i) that the primary mechanism leading to task failure during incremental exercise to exhaustion is predominantly peripheral, i.e. due to inability of the muscles to generate enough power to sustain the target exercise intensity; (ii) that the anaerobic capacity is not exhausted, i.e. glycolysis is not blocked at the end of an incremental exercise to exhaustion; (iii) that exercise capacity will be further deteriorated due to ischaemia at the end of an incremental exercise to exhaustion, indicating that the main mechanisms causing fatigue are peripheral.
Methods
Subjects
Eleven healthy male physical education students (means ± SD; age: 21.5 ± 2.0 years, height: 174 ± 8 cm, body mass: 72.3 ± 9.3 kg, body fat: 16.1 ± 4.9%) agreed to participate in the invasive experiments described below. Another 11 men (age: 23.2 ± 2.8 years, height: 176 ± 6 cm, body mass: 73.8 ± 7.7 kg, body fat: 17.3 ± 4%) agreed to participate in non‐invasive tests to determine the influence of open versus occluded circulation on performance recovery. Before volunteering, subjects received full oral and written information about the experiments and possible risks associated with participation. Written consent was obtained from each subject. The study was performed in accordance with the Declaration of Helsinki and was approved by the Ethical Committee of the University of Las Palmas de Gran Canaria (CEIH‐2010‐01 and CEIH‐2009‐01).
General overview
This study was part of a larger project including several experiments designed to address the mechanisms limiting whole‐body exercise performance in humans (Torres‐Peralta et al., 2014; Calbet et al., 2015; González‐Henriquez et al., 2015; Losa‐Reyna et al., 2015). Detailed information on the general procedures can be found in our companion article (Calbet et al. 2015). Briefly, the subjects participated in an invasive study including incremental exercise to exhaustion in normoxia ( = ∼143 mmHg) and severe acute hypoxia ( = ∼73 mmHg) and two Wingate tests (a 30 s all‐out sprint), one in normoxia and the other in severe hypoxia ( = ∼73 mmHg), performed on an isokinetic ergometer (Excalibur Sport 925900, Lode, Groningen, The Netherlands), in random order. The first 10 s of the Wingate tests were used to calculate the leg O2 consumption () by the Fick method, and to establish the individual relationships between pulmonary and leg during 10 s sprint exercise in normoxia, which was used to estimate the leg during the sprints performed without catheters. The invasive experiments were complemented by a series of additional experiments in the same subjects (called here: ‘main experiments’). This was followed by another set of non‐invasive experiments (called here: ‘verification tests’), carried out in different subjects, to verify the impact of open versus occluded recovery on sprint performance measured either 10 or 60 s after task failure during WBIE in normoxia.
Main experiments
Figure 1 reproduces a schema of the experimental protocol. The main experiments were carried out between 4 and 6 weeks after the invasive experiments and extended over 6–8 weeks, including four different experimental sessions. On each experimental day, subjects reported to the laboratory at 08.00 h, after an overnight fast from 22.00 h. The first two experimental sessions were used to determine the level of fatigue reached at exhaustion during an incremental exercise test, carried out in normoxia (: ∼143 mmHg) or acute hypoxia (: ∼73 mmHg; AltiTrainer200, SMTEC, Nyon, Switzerland), in random order and separated by a 120 min rest. Before the exercise test, bilateral cuffs (SCD10, Hokanson, Bellevue, WA, USA) were placed around the thighs, taped as close as possible to the inguinal crease, and connected to a rapid cuff inflator (Hokanson, E20 AG101). Then the subjects moved to the bike, were connected to the ECG and the metabolic cart, and after 2 min recording at rest, a warm‐up (2 min at 50 W + 2 min at 100 W + 1 min at 160 W) was started. This was followed by 4.5 min of slow unloaded pedalling. Thereafter, the subjects stopped pedalling and became ready to sprint at the 5th minute after the end of the warm‐up. Subjects were requested to sprint as hard and as fast as possible while the ergometer was on isokinetic mode and set at 80 rpm. This sprint was used as a control sprint and was always performed in normoxia. Five minutes later, i.e. after full recovery from the control sprint (Ratel et al. 2002), the incremental exercise started with an initial load of 80 W, which after 2 min was increased by 30 W every 2 min until exhaustion for the test in normoxia. The initial load for the test in hypoxia was set at 60 W, which after 2 min was increased by 20 W every 2 min until exhaustion. Exhaustion was defined by the subject stopping pedalling or dropping pedalling rate below 50 rpm despite strong verbal encouragement. At exhaustion the cuffs were inflated at maximal speed and pressure (i.e. 300 mmHg) to completely and instantaneously occlude the circulation (ischaemia). In one session the period of ischaemia was set to 10 s for the normoxic and hypoxic incremental exercise test (session i10s), while in the other session it was set to 60 s (i60s), also for the normoxic and hypoxic incremental exercise test. Following a countdown the subjects performed a 10 s isokinetic sprint as hard and as fast as possible while the ergometer was set at 80 rpm. At the start of the sprint the cuffs were always instantaneously deflated, and hence, all the sprints were carried out with an open circulation. One of the two control sprints in the i10s and i60s sessions was preceded by ischaemia (10 s ischaemia for i10s and 60 s ischaemia for the i60s). During all recovery periods the subjects were breathing room air (normoxia).
Figure 1. Experimental protocol .
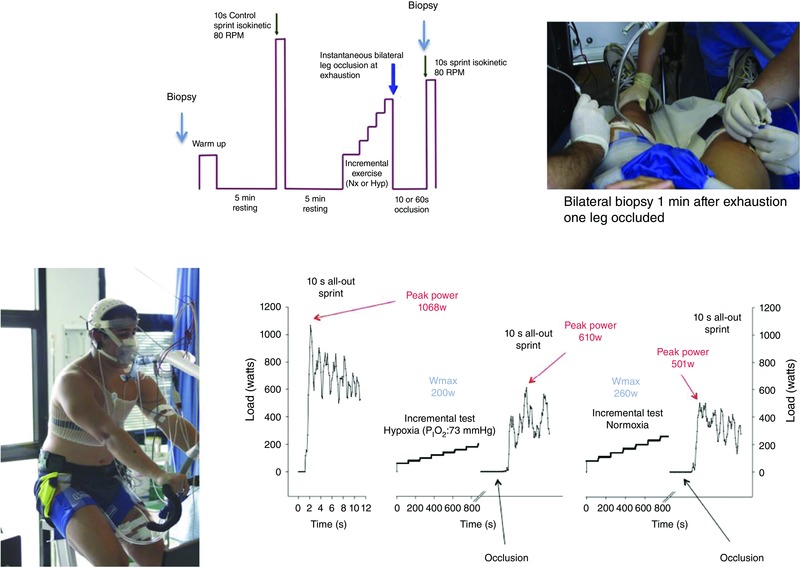
Following a standardized warm‐up subjects performed a control sprint, which was followed by an incremental exercise to exhaustion either in normoxia ( = ∼143 mmHg) or hypoxia ( = ∼73 mmHg) performed in random order. At exhaustion, a cuff was instantaneously inflated at 300 mmHg to impede recovery. After either 10 or 60 s of occlusion the cuff was released and the subjects requested to sprint maximally. In another set of experiments, the same protocol was repeated but only one leg was cuffed. Prior to warm‐up a muscle biopsy was obtained in resting conditions. From the cuffed leg additional muscle biopsies were obtained after 10 and 60 s of occlusion, while from the non‐cuffed leg only one biopsy was obtained at 60 s. The sprints were always performed in isokinetic mode at 80 rpm and in normoxia.
The additional two experimental sessions included only one incremental exercise to exhaustion; 1 day in normoxia (Nxb, : ∼143 mmHg) and the other in hypoxia (Hypb, : ∼73 mmHg; ‘b’ indicates biopsy session). In the Nxb session, after 10 min rest in the supine position, a muscle biopsy was obtained from the m. vastus lateralis with local anaesthesia (lidocaine (lignocaine) 2%, 2 ml), using the Bergstrom technique with suction (Bergstrom, 1962). This biopsy was obtained with the needle pointing distally with 45° inclination (Guerra et al. 2011). An additional incision was performed before the start of the exercise in the contralateral leg. Afterwards, the incisions were covered with a temporary plaster and a cuff placed around the left leg. Then the subjects sat on the cycle ergometer and resting measurements were performed. Two minutes later, the exercise test in normoxia was started with an initial load of 80 W, which after 2 min, was increased by 30 W every 2 min until exhaustion. At exhaustion, the cuff was inflated instantaneously at 300 mmHg and a biopsy was taken at exactly 10 s from the end of the incremental exercise test, i.e. after 10 s of ischaemia. The biopsy needle was introduced perpendicular to the thigh. This biopsy was followed by a final biopsy at 60 s. This permitted the assessment of the ATP turnover rate in the absence of oxygen (as verified by near‐infrared spectroscopy, see below), that is, the energy supplied by phosphagens and the glycolysis from 10 to 60 s during the ischaemic recovery. For the third biopsy the needle was directed proximally (45° inclination). In the Hypb session, similar procedures were applied except that the 60 s biopsy was bilateral, one from the occluded and another one from the non‐cuffed leg, to compare the changes observed during the recovery period with and without occlusion 60 s after the end of the incremental exercise test. The hypoxic test started with 2 min collection at rest (: ∼73 mmHg; AltiTrainer200), followed by 2 min at 60 W, and thereafter increments of 20 W every 2 min until exhaustion. At exhaustion the cuff was inflated and the 10 s biopsy obtained, followed by another biopsy at the 60th second. These two biopsies were obtained under ischaemia, while the subjects were breathing room air (normoxia). All biopsies were immediately frozen in liquid nitrogen and stored at −80°C. Hypb and Nxb sessions were performed in random order.
Body composition and leg muscle mass
Body composition was determined by dual‐energy x‐ray absorptiometry (DEXA) (Hologic QDR‐1500, software version 7.10, Hologic Corp., Waltham, MA, USA) as described elsewhere (Calbet et al. 1997). From the DEXA scans the leg muscle mass was calculated using the model of Wang et al. (1999).
Power output, oxygen uptake, haemoglobin oxygen saturation and supramaximal exercise O2 demand
Power output during the sprint was reported as instantaneous peak power output (W peak‐i), peak power using 1 s averages (W peak‐1), and mean power output (W mean) during the 10 s duration of the sprint. Oxygen uptake () was measured with a metabolic cart (Vmax N29; Sensormedics, Yorba Linda, CA, USA), calibrated prior to each test according to the manufacturer's instructions, with high‐grade calibration gases (Carburos Metálicos, Las Palmas de Gran Canaria, Spain). Respiratory variables were analysed breath‐by‐breath and averaged every 5 s during the sprints and every 20 s during the incremental exercise tests. The highest 20 s averaged recorded in normoxia was taken as the . The same criterion was applied to determine the in hypoxia. Haemoglobin oxygen saturation () was determined with a finger pulse oxymeter (OEM III module, 4549‐000, Plymouth, MN, USA) during the non‐invasive tests.
The O2 demand during the sprints was calculated from the linear relationship between the last 20 s averaged of each load, from 80 W up to 80–90% of , using the data collected in normoxia, while subjects were pedalling at 80 rpm. The accumulated oxygen deficit (AOD), representing the difference between O2 demand and , was determined as previously reported (Calbet et al. 1997; Dorado et al. 2004), after accounting for the contribution of myoglobin‐bound O2. The AOD was converted into ATP equivalents by assuming a phosphate‐to‐O2 ratio of 2.5 (Hinkle et al. 1991).
Muscle metabolites
From each muscle biopsy, 30 mg of wet tissue was freeze‐dried, cleaned and powdered with a manual mortar on ice. Subsequently the samples were suspended in 0.5 m HClO4 and centrifuged at 15,000 g for 15 min at 4°C. The supernatant was neutralized with 2.1 m KHCO3. ATP, phosphocreatine (PCr), creatine (Cr), pyruvate (Pyr) and lactate (Lac) were enzymatically determined in neutralized extracts by fluorometric analysis (Lowry & Passonneau, 1972; Morales‐Alamo et al. 2013).
Muscle metabolite calculations
Anaerobic (phosphagens and glycolysis) ATP resynthesis rate (expressed as mmol (kg dry tissue)−1 s−1) during occlusion was calculated assuming no contribution from O2 stores since, as discussed below, O2 was completely depleted within 3 s after the end of incremental exercise, and there was no release of lactate during the first 10 s of all‐out sprint:
Adenosine diphosphate (ADP) concentration was estimated from the creatine kinase apparent equilibrium constant (K CK) for fatiguing isometric exercise (Sahlin et al. 1975), i.e. a K CK of 127 was applied.
The glycolytic rate during the occlusions was calculated as:
Muscle pH values were calculated from lactate and pyruvate concentrations (expressed as μmol (g dry tissue)−1 assuming a water content of 77%) using the equations proposed by Sahlin et al. (1976) and validated by Spriet et al. (1987):
The leg and pulmonary (l min−1) was converted to millimoles of ATP assuming a volume of 22.4 litres per mole of oxygen (standard temperature and pressure, dry (STPD)) and a phosphate‐to‐O2 ratio of 2.5 (Hinkle et al. 1991; Clanton et al. 2013). To this value the contribution from myoglobin (Mb) desaturation was added, assuming a Mb concentration of 5 g (kg wet muscle)−1 (Jansson et al. 1982) which binds 0.282 mmol O2 at 100% Mb O2 saturation () per kilogram of muscle. Mean Mb desaturation during the sprints was calculated from the linear relationship between femoral vein and constructed from published data (Richardson et al. 1995). For this purpose the averaged femoral vein during the 10 s sprint was used. The total ATP turnover was computed as: aerobic + anaerobic ATP production.
Verification tests
Subjects performed four incremental exercise tests in normoxia distributed in two different experimental sessions, that is, two IEs per session separated by a 120 min resting period. Before the exercise tests bilateral cuffs were placed around their thighs as described above. Afterwards, near‐infrared spectroscopy optodes (NIRO‐200NX, Hamamatsu, Hamamatsu City, Japan) were placed on the middle portion of the musculus vastus lateralis. The subjects then moved to the bike and the recording instruments were connected. After 2 min recording at rest, a warm‐up (2 min at 60 W + 2 min at 100 W + 1 min at 160 W) was started. This was followed by 4.5 min of slow unloaded pedalling. During the subsequent 30 s subjects stopped pedalling and prepared for the start of the sprint after a short countdown. Subjects were requested to sprint during 10 s as hard and as fast as possible while the ergometer was on isokinetic mode and set at 80 rpm. This sprint was used as a control sprint. Five minutes later the incremental exercise started with an initial load of 80 W, which after 2 min, was increased by 30 W every 2 min until exhaustion, as described above for the IEs in normoxia. All subjects performed one session with 10 s recovery periods post‐IE, one recovery period with and another without post‐IE occlusion. During the other experimental session, the recovery period was set to 60 s, again one test with and another without occlusion. The 10 and 60 s recovery sessions were applied in random order.
Statistics
Variables were checked for normal distribution by using the Shapiro–Wilk test. When necessary, the analysis was carried out on logarithmically transformed data. A repeated‐measures ANOVA over inspired O2 fraction () condition (normoxia vs. hypoxia) and occlusion duration (10 vs. 60 s) was used to analyse the responses observed during the sprints. Pairwise comparisons at specific time points were performed with Student's t test, and adjusted for multiple comparisons with the Holm–Bonferroni method. The relationship between variables was determined using linear regression analysis. Values are reported as the mean ± standard deviation (unless otherwise stated). P ≤ 0.05 was considered significant. All statistical analyses were performed using SPSS v.15.0 for Windows (SPSS Inc., Chicago, IL, USA).
Results
Incremental exercise to exhaustion
Similar ergometric indices were obtained in the two tests performed under similar conditions. Exercise performance was reduced in hypoxia (Table 1). Peak power output at exhaustion during the incremental exercise test (W max) and were reduced by ∼34%, while peak heart rate (HRpeak), peak carbon dioxide production (), peak minute ventilation (), respiratory rate, end‐tidal O2 pressure (), end‐tidal CO2 pressure () and haemoglobin oxygen saturation measured by pulse‐oximetry () were, 6, 23, 14, 7, 54, 15 and 32% lower at exhaustion in hypoxia than in normoxia, respectively. The respiratory exchange ratio (RER) was 18% higher in hypoxia than in normoxia (Table 1).
Table 1.
Cardiorespiratory responses to incremental exercise to exhaustion in normoxia ( = ∼143 mmHg) and severe hypoxia ( = ∼73 mmHg) (n = 11)
| Nx 10 s | Nx 60 s | Hyp 10 s | Hyp 60s | P: Nx vs. Hyp | ||
|---|---|---|---|---|---|---|
| (%) | Mean | 20.79 | 20.74 | 10.95 | 10.81 | <0.001 |
| SD | 0.14 | 0.15 | 0.46 | 0.07 | ||
| W max (W) | Mean | 290.4 | 290.9 | 191.5 | 190.6 | <0.001 |
| SD | 35.5 | 31.7 | 24.3 | 22.5 | ||
| HRpeak (beats min−1) | Mean | 185.5 | 185.9 | 176.3 | 174.0 | <0.001 |
| SD | 7.0 | 6.6 | 9.1 | 9.2 | ||
| (l min−1) | Mean | 3.602 | 3.740 | 2.412 | 2.411 | <0.001 |
| SD | 0.405 | 0.335 | 0.351 | 0.236 | ||
| (l min−1) | Mean | 4.130 | 4.217 | 3.221 | 3.209 | <0.001 |
| SD | 0.525 | 0.465 | 0.427 | 0.371 | ||
| RER | Mean | 1.15 | 1.13 | 1.36 | 1.34 | <0.001 |
| SD | 0.05 | 0.04 | 0.14 | 0.13 | ||
| (l min−1) | Mean | 144.6 | 144.8 | 125.0 | 122.7 | <0.001 |
| SD | 22.9 | 18.8 | 25.0 | 20.7 | ||
| RR (breaths min−1) | Mean | 59.8 | 58.4 | 56.6 | 53.0 | =0.005 |
| SD | 9.0 | 6.9 | 8.8 | 8.4 | ||
| (mmHg) | Mean | 113.3 | 112.8 | 53.0 | 52.0 | <0.001 |
| SD | 2.6 | 2.7 | 3.8 | 2.6 | ||
| (mmHg) | Mean | 32.0 | 32.5 | 27.3 | 27.7 | <0.001 |
| SD | 3.4 | 2.6 | 2.8 | 1.9 | ||
| (%) | Mean | 94.2 | 94.1 | 64.3 | 64.0 | <0.001 |
| SD | 1.7 | 2.5 | 6.1 | 5.4 |
Nx: normoxia; Hyp: hypoxia; 10 s and 60 s indicates test followed by 10 s and 60 s occlusions, respectively. : inspired oxygen fraction; W max: peak power output at exhaustion; HRpeak: heart rate at exhaustion; : O2 uptake at exhaustion; : CO2 production at exhaustion; RER: respiratory exchange ratio; : pulmonary ventilation at exhaustion; RR: respiratory rate; : end‐tidal O2 pressure; : end‐tidal CO2 pressure; : haemoglobin O2 saturation (pulse‐oxymetry).
Sprint performance
Four control sprints were performed in this study 5 min before the incremental exercise test, always preceded by a standardized warm‐up. On two occasions the sprints were not preceded by vascular occlusion. No statistically significant differences were observed between these two tests in any of the variables assessed. The other two tests were preceded by either 10 or 60 s occlusions. Since there were no statistical differences in W peak‐i or W mean between the two tests preceded by 10 and 60 s occlusions, these two were also averaged.
Compared with the control sprints, sprint performance was reduced at the end of the incremental exercise tests (Table 2). Compared with the control sprint W peak‐i was reduced by 46% after the incremental exercise in normoxia, when the occlusion was 10 s. This reduction in performance was significantly greater than the 32–35% reduction observed in the rest of the sprints (P < 0.05). Compared with control sprints, W mean was reduced by 43% after the incremental exercise. However, the reduction was greatest (52%) following the incremental exercise in normoxia when preceded by a 10 s occlusion (Table 2). Although the sprint's W mean was slightly lower after the incremental exercise performed in normoxia than in hypoxia, this difference was not statistically different (main effect P = 0.29).
Table 2.
Performance during 10 s sprints carried out after a standardized warm‐up (Control), and at the end of an incremental exercise to exhaustion in normoxia ( = ∼143 mmHg) and severe hypoxia ( = ∼73 mmHg), following recovery periods of either 10 or 60 s with vascular occlusion (n = 11)
| Main | Main | Interaction | ||||||
|---|---|---|---|---|---|---|---|---|
| Control | Nx 10s | Nx 60s | Hyp 10s | Hyp 60s | (P) | Occ (P) | × Occ (P) | |
| W peak‐i (W) | 978.7 ± 98.8a | 529.5 ± 93.5a | 633.9 ± 113.4 | 637.0 ± 124.1 | 663.8 ± 131.7 | 0.020 | 0.040 | 0.098 |
| W peak‐1 (W) | 762.9 ± 79.1a | 412.1 ± 65.6a | 497.0 ± 63.9 | 479.1 ± 82.4 | 530.5 ± 114.4 | 0.030 | 0.010 | 0.240 |
| W mean (W) | 667.6 ± 65.7a | 318.4 ± 55.3 | 417.0 ± 57.5b | 359.6 ± 77.3c | 424.3 ± 110.1b | 0.29 | 0.002 | 0.30 |
P < 0.05 compared with the other conditions;
b P < 0.05 compared with Nx 10 s;
c P < 0.05 compared with Nx 60 s; RM ANOVA (2 × 2) Main : main oxygenation effect due to the conditions in which the incremental exercise test was performed (Nx: normoxia; Hyp: hypoxia); RM ANOVA (2 × 2) Main Occ: main occlusion effect due to the duration of the occlusion (10 vs. 60 s); W peak‐i: instantaneous peak power in the sprint; W peak‐1: peak power in the sprint using 1 s averages; W mean: mean power in the 10 s.
There was a significant improvement in performance after 60 s of occlusion compared with the values observed after 10 s of occlusion, regardless of the during the incremental exercise test (Table 2). Compared with the sprint performed after 10 s occlusions, W peak‐i, W peak‐1 and W mean were 11, 15 and 24% higher, respectively, following 60 s of occlusion (P < 0.05). Compared with the control sprints, W mean was reduced by 52 and 39% after the incremental exercise test in normoxia when the occlusion lasted 10 and 60 s, respectively (P < 0.05).
Cardiorespiratory responses to the sprints
Cardiorespiratory responses are summarized in Table 3. Compared with the control sprints, pulmonary ventilation was higher in the sprints performed right after incremental exercise. was 30% higher in the sprints preceded by a normoxic incremental exercise compared with sprints preceded by hypoxic incremental exercise, and 50% higher with 10 compared with 60 s recovery. This was due to a combination of both higher respiratory rate and tidal volume. Respiratory rate was close to 60 breaths min−1 in the sprints carried out after the incremental exercise test, representing almost twice the value observed in the control sprints. Tidal volume was almost doubled during the sprint performed following an incremental exercise test in normoxia with 10 s ischaemic recovery. Tidal volume was lower with longer ischaemic recovery, and higher after normoxic than hypoxic incremental exercise tests.
Table 3.
Cardiorespiratory response to 10 s sprints performed at the end of an incremental exercise to exhaustion in normoxia ( = ∼143 mmHg) and severe hypoxia ( = ∼73 mmHg), following recovery periods of either 10 or 60 s with vascular occlusion (n = 11)
| Control | Nx 10s | Nx 60s | Hyp 10s | Hyp 60s | Main (P) | Main Occ (P) | Interaction × Occ (P) | |
|---|---|---|---|---|---|---|---|---|
| (l min−1) | 28.9 ± 10.0a | 130.5 ± 28.7 | 83.6 ± 23.8b | 96.6 ± 37.2b | 67.9 ± 26.1b,c,d | 0.001 | 0.002 | 0.133 |
| RR (breaths min−1) | 32.1 ± 10.9a | 64.6 ± 11.1 | 61.6 ± 15.0 | 58.6 ± 20.3 | 56.7 ± 19.5 | 0.090 | 0.444 | 0.876 |
| V t (l) | 0.914 ± 0.211a | 2.039 ± 0.415 | 1.358 ± 0.296b | 1.661 ± 0.312b,c | 1.191 ± 0.220b,d | 0.001 | 0.001 | 0.111 |
| (l min−1) | 0.905 ± 0.298a | 2.656 ± 0.443 | 1.604 ± 0.525b | 3.322 ± 0.677b | 1.308 ± 0.431b,d | 0.920 | 0.001 | 0.004 |
| (l min−1) | 0.875 ± 0.255a | 3.396 ± 0.582 | 2.043 ± 0.593b | 2.374 ± 0.659b | 1.400 ± 0.435b,c,d | 0.001 | 0.001 | 0.094 |
| RER | 1.03 ± 0.10b,c,d | 1.33 ± 0.09 | 1.37 ± 0.17 | 0.74 ± 0.11b,c | 1.16 ± 0.18b,c,d | 0.001 | 0.001 | 0.001 |
| / | 31.6 ± 4.8b,c,e | 48.0 ± 6.3 | 52.6 ± 11.6 | 28.1 ± 6.9b,c | 51.1 ± 14.1d | 0.001 | 0.004 | 0.001 |
| / | 32.2 ± 3.3a | 37.5 ± 4.4 | 40.7 ± 4.7b | 39.5 ± 6.0 | 46.7 ± 8.8b,c,d | 0.002 | 0.035 | 0.096 |
| (mmHg) | 105.4 ± 3.8b,c,e | 117.2 ± 2.6 | 118.5 ± 4.3 | 95.2 ± 17.5b,c | 118.8 ± 8.4d | 0.002 | 0.001 | 0.002 |
| (mmHg) | 35.0 ± 2.6a | 30.2 ± 3.1 | 28.9 ± 3.3 | 28.8 ± 4.6 | 25.0 ± 5.0b,c,d | 0.002 | 0.510 | 0.096 |
| HR (beats min−1) | 134.0 ± 11.9a | 186.8 ± 8.9 | 177.7 ± 10.3b | 179.6 ± 8.1b | 169.1 ± 13.0b,c,d | 0.001 | 0.001 | 0.477 |
P < 0.05 compared with the other conditions;
b P < 0.05 compared with Nx 10 s;
c P < 0.05 compared with Nx 60 s;
d P < 0.05 compared with Hyp 10 s;
e P < 0.05 compared with Hyp 60 s; RM ANOVA (2 × 2) Main : main oxygenation effect due to the conditions in which the incremental exercise test was performed (Nx: normoxia; Hyp: hypoxia); RM ANOVA (2 × 2) Main Occ: main occlusion effect due to the duration of the occlusion (10 vs. 60 s); : pulmonary ventilation; RR: respiratory rate; V t: tidal volume; : oxygen uptake; : CO2 production; RER: respiratory exchange ratio (/);: end‐tidal O2 pressure; : end‐tidal CO2 pressure; HR: heart rate.
Oxygen uptake during the sprints was higher after the incremental exercise test than in the control sprints. This effect was accentuated in hypoxia and attenuated by the duration of the ischaemic recovery. Likewise CO2 production () was more elevated after the incremental exercise test than after the control sprints, with a more marked response after the normoxic incremental exercise test. Consequently the RER, /, / and were much higher during the sprints that followed an incremental exercise than in the control sprints. In general, these effects were more marked for the sprints performed with longer ischaemic recovery. Due to the high hyperventilation induced by the incremental exercise test, was more reduced in the sprints that followed the incremental exercise test than after the control sprints, with a more marked response after the hypoxic incremental exercise test, especially if followed by a longer ischaemic recovery (P = 0.051).
Compared with the control sprints, the mean heart rate (HR) response was higher after the incremental exercise test, the difference being more marked with normoxia than hypoxia. The mean HR response was lower with longer ischaemic recovery.
Muscle metabolites
By combining this study with invasive data obtained in the same subjects during Wingate tests performed in normoxia and severe acute hypoxia (see companion paper, Calbet et al. 2015) we have calculated the mean rate of ATP turnover from oxidative phosphorylation (aerobic ATP turnover) of the legs during the control sprints. In addition, we have also calculated the theoretical maximal rate of ATP turnover from oxidative phosphorylation by assuming maximal oxygen uptake in the legs.
During incremental exercise to exhaustion in normoxia, two‐legged peaked at 2.50 ± 0.42 l min−1; this permits a maximal aerobic ATP turnover of 0.560 ± 0.076 mmol ATP (kg wet weight (w.w.))−1 s−1. With this ATP turnover the highest power output sustainable aerobically would be 213 W for a contraction coupling efficiency of 50% (Gaesser & Brooks, 1975; Smith et al. 2005), assuming an ATP change of standard Gibbs free energy (ΔG°) of 52 kJ mol−1 (Nelson et al. 2011). Using the submaximal –power relationship, the power output eliciting an O2 demand equal to the measured was 258 ± 30 W. These two estimations (213 and 258 W) of the maximal aerobically sustainable load were significantly lower than the W mean reached during the sprints.
At the end of the incremental exercise ATP concentration was similarly reduced by 20.7 ± 6.4% and 20.3 ± 5.0% in normoxia and hypoxia, respectively (ANOVA time effect P < 0.001), without significant differences due to during the IE (occlusion × interaction P = 0.66). No significant differences were observed in ATP concentration between the 10th and the 60th second of recovery with occlusion (Fig. 2 A). Immediately after exercise (‘POST’), PCr concentration was reduced by 91.1 ± 4.0 and 80.2 ± 7.6% in normoxia and hypoxia, respectively (ANOVA time effect P < 0.001), and after 1 min of occlusion the corresponding values were further reduced by an additional ∼5% (P < 0.05 compared with POST and P < 0.001, compared with before exercise (‘PRE’)). There was no occlusion × interaction (P = 0.54) (Fig. 2 B). The estimated ADP concentration was non‐significantly increased from 4.0 ± 3.1 to 4.6 ± 2.8 and from 3.0 ± 3.3 to 3.6 ± 2.0 mmol (kg d.w.)−1, in normoxia (P = 0.31) and hypoxia (P = 0.86), respectively.
Figure 2. Muscle metabolites .
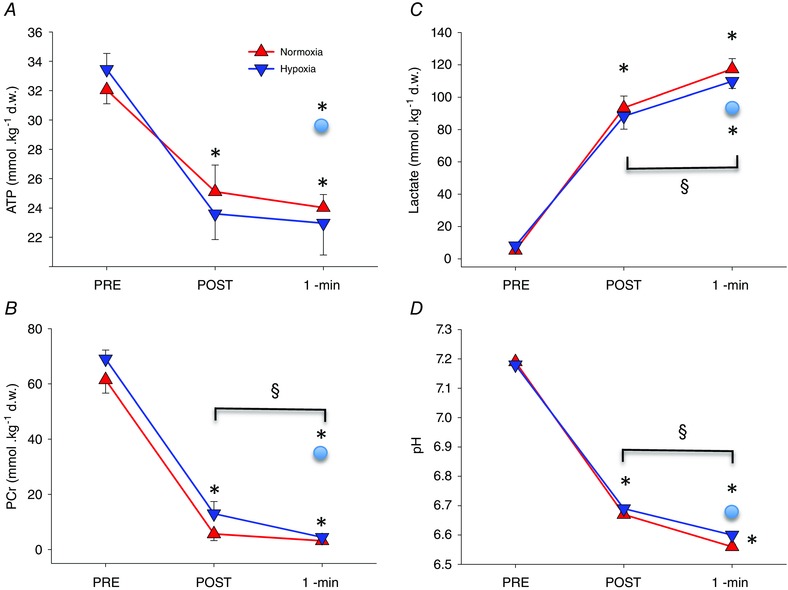
Muscle ATP (A), phosphocreatine (PCr) (B), lactate (C) and pH (D) under resting conditions before (PRE) exercise, and 10 s (POST) and 60 s (1‐min) after the end of an incremental exercise to exhaustion either in normoxia ( = ∼143 mmHg) or hypoxia ( = ∼73 mmHg) performed in random order. At exhaustion, a cuff was instantaneously inflated at 300 mmHg around the thigh of one leg to impede recovery. A muscle biopsy was obtained 10 and 60 s after the end of the sprint, while the occlusion was maintained, from the musculus vastus lateralis of the occluded leg. A 60 s biopsy was also obtained simultaneously from the non‐cuffed leg (circles in the graphs). *P < 0.05, compared with PRE; §ANOVA time effect POST vs. 1‐min occlusion P < 0.05.
Muscle lactate concentration was increased to similar values 10 s after both incremental exercise tests (93.5 ± 24.3 and 88.3 ± 26.6 mmol (kg d.w.)−1, in normoxia and hypoxia, respectively (ANOVA time effect P < 0.001), without significant occlusion × interaction (P = 0.79). From the end of the exercise to the 1 min recovery period, muscle lactate increased further by 24.0 ± 20.7 and 21.6 ± 24.5 mmol (kg d.w.)−1, in normoxia and hypoxia, respectively (P < 0.01) (Fig. 2 C). Accordingly, the pyruvate concentration was also increased immediately after the exercise 6.7 ± 2.9 and 2.3 ± 0.6‐fold, in normoxia and hypoxia, respectively (ANOVA time effect P < 0.05), remaining elevated at the 1 min recovery time point with occlusion when compared with pre‐exercise values (P < 0.05).
Compared with before exercise, muscle pH was reduced at the end of exercise by 0.526 ± 0.033 and 0.487 ± 0.033 units in normoxia and hypoxia, respectively (ANOVA time effect P < 0.001) (Fig. 2 D). Fifty seconds later, muscle pH was further reduced by 0.103 ± 0.027 and 0.092 ± 0.032 units, respectively (ANOVA time effect P < 0.01). There was no occlusion × interaction (P = 0.9).
Without occlusion, ATP levels were fully recovered 1 min after the end of exercise, while PCr levels had recovered to 47.5 ± 3.7% of the PCr pre‐exercise levels. Muscle lactate concentration remained at the same level attained at the end of exercise without further increases during the 1 min recovery period. Consequently, muscle pH remained almost at the same level during the first minute of recovery with free circulation (6.666 ± 0.033 and 6.671 ± 0.040 units, immediately after exercise and 1 min later, P = 0.69) (Fig. 2 A–D).
There was a linear inverse relationship between the accumulation of muscle lactate in the 10 s post‐normoxic incremental sprint and the percentage of W peak‐i, W peak‐1 and W mean remaining from values achieved during the control sprints (r = −0.80, −0.70, −0.77, respectively, P < 0.05, n = 10), which was not observed after incremental exercise in hypoxia (r = −0.42, P = 0.22). Likewise, no significant relationships were observed between the relative accumulation of muscle lactate from the pre‐exercise values and the W peak‐i, W peak‐1 and W mean remaining following 60 s of recovery, regardless of oxygenation during the incremental exercise.
Energy sources during the sprints
From the arteriovenous differences and blood flow measurements we determined the leg during the first 10 s of the Wingate test. The 2‐leg was 0.78 ± 0.19 l min−1, representing 59.6 ± 13.1% of pulmonary (n = 10). By using the individual relationship between pulmonary and 2‐leg , the 2‐leg during the post‐incremental exercise sprints was calculated. Compared with the control sprints, leg was 2.4‐fold higher when the sprints were performed after the incremental exercise. Leg was 2.1‐fold higher after 10 s compared with after 60 s occlusions (Table 4). The mean rate of ATP turnover from oxidative phosphorylation followed a similar pattern, even after accounting for the use of myoglobin‐bound O2. Using the submaximal –intensity relationship we have estimated the total ATP demand during sprints, which was determined mainly by the W mean developed during the sprints. The energy demand of the sprints was higher for the control sprints, while it was almost halved during the sprints performed after 10 s of occlusion, but was higher after 60 s than after 10 s of occlusion. The mean rate of ATP turnover due to the anaerobic energy sources (ATP, PCr and glycolysis) was 65% lower in the post‐IE sprints compared with the control sprints, mostly due to the reduced availability of phosphagens. The mean rate of anaerobic ATP resynthesis was about twice as high after 60 s compared with after 10 s occlusions, despite greater lactate and H+ concentration at 60 s than 10 s. The fractional contribution of anaerobic energy sources was the highest during the control sprints and the lowest during the sprints performed 10 s after exhaustion.
Table 4.
Muscle metabolism during 10 s sprints performed after a standardized warm‐up (Control), and at the end of an incremental exercise to exhaustion in normoxia ( = ∼143 mmHg) and severe hypoxia ( = ∼73 mmHg), following recovery periods of either 10 or 60 s with vascular occlusion (n = 11)
| Control | Nx 10 s | Nx 60 s | Hyp 10s | Hyp 60s | Main (P) | Main Occ (P) | Interaction × Occ (P) | |
|---|---|---|---|---|---|---|---|---|
| Legs (l min−1) | 0.542 ± 0.229a | 1.562 ± 0.325 | 0.937 ± 0.313b | 1.958 ± 0.488b,c | 0.775 ± 0.287b,d | 0.09 | 0.001 | 0.003 |
| Legs (ml kg−1 min−1) | 75.9 ± 36.7a | 216.5 ± 56.0 | 129.8 ± 46.4b | 272.7 ± 82.3b,c | 108.9 ± 45.5b,d | 0.09 | 0.001 | 0.003 |
| ATP turnover (mmol kg−1 s−1) | 0.106 ± 0.045a | 0.306 ± 0.064 | 0.184 ± 0.061b | 0.384 ± 0.096b,c | 0.152 ± 0.056b,d | 0.09 | 0.001 | 0.003 |
| ATP turnover total O2 (mmol kg−1 s−1) | 0.205 ± 0.058a | 0.434 ± 0.091 | 0.293 ± 0.077b | 0.526 ± 0.135b,c | 0.258 ± 0.076b,d | 0.09 | 0.001 | 0.002 |
| Total ATP demand (mmol kg−1 s−1) | 1.184 ± 0.250a | 0.625 ± 0.123 | 0.785 ± 0.173b | 0.698 ± 0.187 | 0.792 ± 0.220b | 0.294 | 0.003 | 0.251 |
| Anaerobic ATP turnover (mmol kg−1 s−1) | 0.980 ± 0.213a | 0.191 ± 0.058 | 0.492 ± 0.164b | 0.172 ± 0.161c | 0.534 ± 0.219b,d | 0.779 | 0.001 | 0.358 |
| %Anaerobic | 82.7 ± 3.2a | 30.4 ± 6.9 | 61.7 ± 10.8 | 22.3 ± 16.8 | 65.8 ± 11.3 | 0.530 | 0.001 | 0.051 |
| ATP turnover occlusion (mmol kg−1 s−1) | 0.176 ± 0.142 | 0.185 ± 0.234 | ||||||
| Anaerobic reserve (mmol kg−1) | 17.3 ± 9.8 | 17.8 ± 16.2 |
P < 0.05 compared with the other conditions;
b P < 0.05 compared with Nx 10 s;
c P < 0.05 compared with Nx 60 s;
d P < 0.05 compared with Hyp 10 s;
RM ANOVA (2 × 2) Main : main oxygenation effect due to the conditions in which the incremental exercise test was performed (Nx: normoxia; Hyp: hypoxia); RM ANOVA (2 × 2) Main Occ: main occlusion effect due to the duration of the occlusion (10 s vs. 60 s); assuming a wet‐to‐dry weight muscle ratio of 4.5:1 (Putman et al. 1998); ATP turnover total O2 = aerobic ATP turnover from leg + ATP turnover from O2 stores; Anaerobic ATP turnover: energy supplied by phosphagens and glycolysis (the energy supplied by lactate oxidation is computed as aerobic ATP turnover).
Mean rate of ATP turnover during the occlusions and glycolytic rate
Near‐infrared spectroscopy (NIRS) measurements indicated that any O2 trapped in the leg by the occlusion at exhaustion or remaining bound to myoglobin was depleted (or unavailable) within 2–3 s of occlusion. Thus, from 10 to 60 s of occlusion the only energy sources were the small amount of PCr and ATP remaining at 10 s combined with the energy provided by the glycolysis. Assuming no contribution by O2, the mean rate of ATP turnover during the occlusions was 0.180 ± 0.133 mmol (kg w.w.)−1 s−1, without significant differences between the incremental exercise test performed in normoxia and hypoxia (P = 0.99). This is approximately 5‐fold less than the peak rate of anaerobic ATP resynthesis that was achieved during the control sprints.
The glycolytic rate during the occlusions after the incremental exercise in normoxia and hypoxia was not significantly different (241 ± 207 and 216 ± 246 μmol glycosyl units (kg d.w.)−1 s−1, respectively, P = 0.78).
Influence of oxygenation in the recovery of performance
We recruited 11 additional subjects who performed 10 s isokinetic sprints 10 s and 60 s after an incremental exercise to exhaustion in normoxia (Figs 3 and 4). Compared with the control sprints, post‐IE sprint W peak‐i was reduced by 60.8 ± 7.5 and 46.9 ± 10.4% after 10 and 60 s vascular occlusions, respectively (P < 0.05). After recovery with open circulation, W peak‐i was reduced by 38.3 ± 8.5 and 21.6 ± 9.5%, 10 and 60 s after the end of the IE, respectively (P < 0.05). Globally, W peak‐i was reduced by 53.8 ± 5.9 and 29.9 ± 7.7% after recovery with and without vascular occlusion, respectively (P < 0.05). No changes in oxygenation were observed with NIRS between the 10th and the 60th second after the onset of the vascular occlusion (Fig. 4) .
Figure 3. Muscle oxygenation during 10 s sprints .
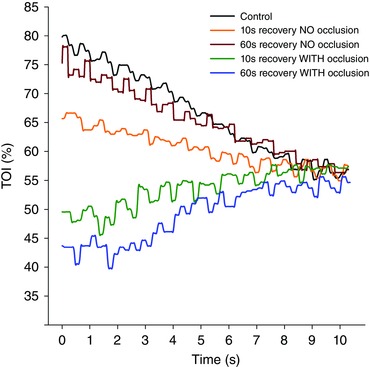
The muscle oxygenation index (TOI) was determined in the musculus vastus lateralis during 10 s isokinetic sprints (80 rpm) after a standardized warm‐up (Control) and 10 or 60 s after an incremental exercise to exhaustion with free or occluded circulation during the recovery periods. TOI followed an increasing pattern for sprints preceded by vascular occlusion, while the pattern was always decreasing for the sprints that were not preceded by vascular occlusion. After 8 s, TOI values converge, indicating similar fractional O2 extraction values, which indirectly imply that the marked differences in pulmonary observed between sprints are probably due to differences in O2 delivery.
Figure 4. Muscle oxygenation .
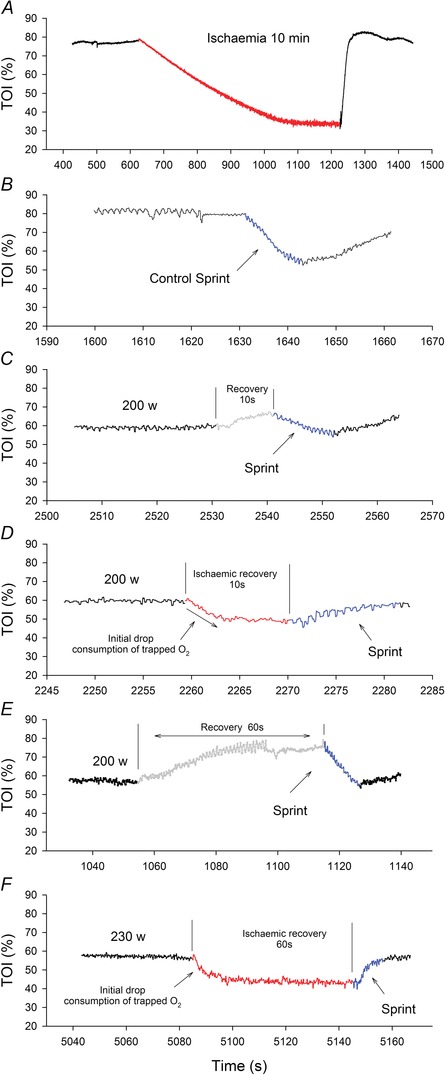
The tissue oxygenation index (TOI) was determined in the musculus vastus lateralis during incremental exercise to exhaustion continued by 10 or 60 s recovery periods with free circulation or ischaemia, which were followed by 10 s isokinetic sprints. Vastus lateralis TOI responses to 10 min of ischaemia (red line, A); a control sprint preceded by a standardized warm‐up (B); sprint performed 10 s after exhaustion (blue line) with open circulation during recovery (grey line) (C); sprint performed 10 s after exhaustion (blue line) with vascular occlusion during recovery (red line) (D); sprint performed 60 s after exhaustion (blue line) with open circulation during recovery (grey line) (E); sprint performed 60 s after exhaustion (blue line) with vascular occlusion during recovery (red line) (F). All graphs are from data obtained in a single representative subject.
Discussion
The present investigation shows that at the end of an incremental exercise to exhaustion a large functional reserve remains in the muscles to generate power, even at levels far above the power output at which task failure occurred, regardless of the level of during the incremental exercise. This implies that task failure during an incremental exercise to exhaustion depends more on central than peripheral mechanisms. Moreover, our results indicate that strong activation of anaerobic metabolism occurs in the last stages of an incremental exercise test to exhaustion resulting in phosphagen hydrolysis and muscle lactate accumulation to levels close to those observed after 30 s all‐out tests (Medbo & Tabata, 1993; Bogdanis et al. 1995; Parolin et al. 2000), which are commonly used to evaluate the anaerobic capacity (Bar‐Or, 1987; Morales‐Alamo et al. 2012). Although it is known that acidification has an inhibitory influence on the glycolytic rate by slowing glycogenolysis at the level of the glycogen phosphorylase a, and glycolysis at the level of phosphofructokinase (Hollidge‐Horvat et al. 1999), the present findings show that glycolysis was far from being blocked at exhaustion both in normoxia and hypoxia. This is supported by two facts. Firstly, blood lactate accumulated during occlusion at a rate of ∼0.45 mmol (kg d.w.)−1 s−1, i.e. about 11% of the maximal lactate production rate reported during sprint exercise in man (Parolin et al. 1999). Secondly, after 60 s of occlusion our subjects were requested to sprint maximally during 10 s and, despite the hypothetically worse metabolic conditions after 60 than 10 s of ischaemia (at 60 s PCr was lower and muscle lactate higher than at 10 s), mean power output was higher after 60 than 10 s of ischaemia. Moreover, in both post‐incremental exercise sprints W mean was higher than that reached in the last step of the incremental exercise. Therefore, our experiments show that the main mechanism causing task failure during an incremental exercise to exhaustion is not the accumulation of lactate and H+, or PCr and ATP depletion. In other words, although the maximal rate of ATP provision is markedly reduced at task failure, the resynthesis capacity remaining exceeds the rate of ATP consumption.
Muscle metabolism during occlusion
A uniqueness of the present investigation was the almost instantaneous application of arterial occlusion at exhaustion to impede muscle oxygenation. The system used applied 300 mmHg of pressure around both thighs in less than 2 s. Actually, NIRS data indicated occlusion in less than a second. In the moment of occlusion, due to the low levels of PCr and increased levels of ADP, mitochondrial respiration is stimulated to achieve peak (Sahlin & Harris, 2011). Under these circumstances, occlusion is expected to deplete the small amount of O2 remaining bound to the myoglobin (Richardson et al. 1995) and the O2 present in the capillary bed (Harris et al. 1975; Blei et al. 1993) in less than 3–5 s (see Fig. 4 D and F). Using published data for the relationship between femoral vein and myoglobin saturation (Richardson et al. 1995) we have estimated that at exhaustion in normoxia the amount of O2 remaining bound to the myoglobin was ∼0.16 mmol (kg w.w.)−1 (equivalent to 0.81 mmol ATP kg−1). The amount of O2 in blood trapped in the capillaries can be estimated as ∼0.05 mmol kg−1 (Blei et al. 1993), which is enough to provide ∼0.25 mmol ATP kg−1, with both O2 sources summing 1.06 mmol ATP (kg w.w.)−1. Since the calculated aerobic ATP turnover at in normoxia was ∼0.5 mmol (kg w.w.)−1 s−1, this implies that in about 3 s the almost already exhausted O2 deposits will be completely depleted. This agrees with a fast reduction of the vastus lateralis tissue oxygenation index (TOI) measured with NIRS that stabilized at minimal values after 3 s of occlusion. Thus, from 3 to 60 s of occlusion all energy supply depended almost exclusively on the glycolysis with a minor (∼5–10%) contribution of phosphagens.
By zeroing O2 availability, occlusion prevented the recovery of PCr and ATP (Harris et al. 1976; Blei et al. 1993; Quistorff et al. 1993). In addition, from 10 s to 60 s of occlusion the total amount of phosphagen pool was slightly reduced, while lactate concentration was increased by 25% and pH reduced by 0.1 units, at the same time the calculated ADP concentrations remained similarly elevated. Thus, in our experimental conditions, from 10 to 60 s of occlusion fast energy resources were further reduced and the increase of blood lactate combined with the acidification of the internal milieu should have reduced muscle performance to a greater extent after 60 compared with 10 s of occlusion (Fitts, 1994). However, despite theoretically worsened metabolic conditions, W mean was 24% higher after 60 than after 10 s of occlusion. This indicates that muscle lactate and H+ accumulation have a minor role in muscle fatigue (Allen et al. 2008). Moreover, during ischaemia ATP was resynthesized at a mean rate of 0.180 mmol (kg w.w.)−1 s−1, which represents 20 times the muscle basal ATPase rate, which is 0.008–0.01 mmol (kg w.w.)−1 s−1 (Harris et al. 1976; Blei et al. 1993) or ∼32% the measured maximal aerobic ATP resynthesis rate determined by the Fick method across the legs, in the present investigation. Since there was no O2 consumption, as indicated by the NIRS data, and PCr was almost depleted, ATP resynthesis had to rely on glycolysis (anaerobic). However, with open circulation W mean was 48% higher after 60 than 10 s recovery, indicating that during the first 60 s of recovery the glycolysis may contribute at most 50% of the potential recovery achievable with normal oxygenation.
This increased activation of glycolysis during post‐exercise ischaemia could have facilitated recovery by progressively rising muscle temperature (Westerblad et al. 1997) due to the high metabolic rate (32% of ) observed during occlusion and the very limited capacity for heat dissipation during occlusion, combined with the positive effect of lactate and H+ in the recovery of sarcolemmal excitability (Pedersen et al. 2003; Allen & Westerblad, 2004).
The anaerobic capacity does not limit exercise performance during incremental exercise to exhaustion
By calculating the ATP resynthesis rate necessary to achieve the level of mean power output observed during each sprint and by estimating the level of aerobic ATP resynthesis based on direct measurements of leg (companion article, Calbet et al. 2015) we have determined the total amount of energy provided by anaerobic metabolism. In the control sprints the average anaerobic ATP turnover rate was 0.98 mmol (kg w.w.)−1 s−1, which is a little more than the 0.82 mmol (kg w.w.)−1 s−1 measured also in the vastus lateralis during an isometric knee extension at 65% of the maximal voluntary contraction until exhaustion (Katz et al. 1986). Compared with the control sprints, the contribution of the aerobic metabolism to ATP turnover was much higher during the post‐incremental exercise sprints, particularly those that followed 10 s occlusions. At the end of incremental exercise, when the muscles are consuming O2 maximally, mitochondrial respiration is expected to be highly stimulated (Boushel et al. 2011). Since ADP is the main regulator of mitochondrial respiratory rate (Gnaiger, 2001), and since ADP concentration remained at similar levels after 10 and 60 s of occlusion, then it is likely that mitochondrial activation persisted after 60 s of occlusion, but without respiration due to the lack of O2. Nevertheless, the occluded muscles were capable of increasing as soon as the cuff was released, as revealed by the NIRS signal and pulmonary .
Sprint exercise was lower after 60 than 10 s of occlusion and the most plausible explanation is a lower O2 delivery for two main reasons. On the one hand, cardiac output declines exponentially with the cessation of muscle contractions (Davies et al. 1972), and so does leg blood flow (Hermansen & Vaage, 1977), which depends on cardiac output (Calbet & Joyner, 2010; Calbet & Lundby, 2012). This is supported by the 10 beats min−1 lower heart rate in the sprints that followed a longer compared with a shorter ischaemic recovery, in our experiments. On the other hand, prolonged ischaemia may alter the microvascular regulation of the circulation during exercise, which depends on an efficient sympathetic drive directing the blood specifically to active muscle fibres (Calbet et al. 2006; Calbet & Joyner, 2010). In agreement, we observed an increase in vastus lateralis TOI during the sprints that were preceded by ischaemia (this is compatible with microvascular mismatch between O2 demand and delivery), while TOI was always reduced during the sprints that were preceded by recovery with open circulation. Thus, reduced O2 delivery combined with an altered distribution of blood flow caused by post‐ischaemic reactive hyperaemia, are the most likely explanations for a lower leg after 60 compared with 10 s ischaemia, despite high activation of mitochondrial respiration.
The fact that the during the control sprints was much lower than during the sprints at exhaustion is due to insufficient stimulation of mitochondrial respiration, and not due to insufficient O2 delivery (companion article, Calbet et al. 2015), as previously suggested by Hogan and co‐workers (Clanton et al. 2013). In reality, during the initial 5–10 s of the sprint we detected excess O2 delivery (Calbet et al. 2015). Thus, it is likely that an increase in mitochondrial ADP is needed to achieve high levels of (Gnaiger, 2001; Sahlin & Harris, 2011), and this only occurs at the expense of a reduction in PCr and ATP, as actually observed in the present investigation in the biopsies obtained at 10 s post‐exhaustion.
After 10 s of ischaemia less lactate and H+ had accumulated and some more phosphagens were available than at 60 s, thus anaerobic pathways should have been less inhibited at 10 s than at 60 s of ischaemia. Nevertheless, glycolytic (anaerobic) ATP resynthesis rate was lower during the sprints performed after short recovery, suggesting three ideas. Firstly, that metabolism prioritizes using O2 when available, even in situations of extreme fatigue and marked metabolic acidosis. This is supported by the decreasing TOI values during the first 3–5 s of ischaemia, as well as by the low TOI values recorded during the sprints, indicating that most of the O2 supplied to the muscles was actually extracted, as reflected by the high pulmonary values during sprints performed after incremental exercise. Second, at exhaustion oxidative phosphorylation is not blocked due to acidosis since NIRS data indicate O2 consumption during the first 3–5 s of ischaemic recovery and increased quickly at the onset of post‐ischaemia sprints. In support of this, Hollidge‐Horvat et al. (1999) observed that muscle acidification stimulated pyruvate oxidation during exercise. Likewise, during fatiguing isometric contractions the rate of glycolysis remains constant despite a decreasing muscle pH (Chasiotis et al. 1982). Moreover, as shown in this investigation, a marked level of muscular acidosis is present at exhaustion during incremental exercise in severe acute hypoxia. Nevertheless, the subjects are able to continue the exercise if the of the breathing gas is swiftly changed to normoxia at exhaustion, while at the same time a remarkable fast increase of is observed (Calbet et al. 2003). This is not compatible with acid‐induced inhibition of oxidative phosphorylation as a mechanism of fatigue at the end of an incremental exercise to exhaustion in severe hypoxia. Consistent with this interpretation, during the sprints performed after 60 s of ischaemic recovery pulmonary and leg almost doubled the values achieved during the control sprints, also indicating strong stimulation of mitochondrial respiration despite the low muscle pH (∼6.5).
During the sprints after 60 s ischaemia, the ATP resynthesis rate by glycolysis (anaerobic) and phosphagens was close to 50% of the rate observed during the control sprints. Given the fact that during a 10 s sprint about half of the energy is provided by the phosphagens and the other half by the glycolysis (Bogdanis et al. 1998), it can be deduced that our subjects must have reached rather high glycolytic rates even during the last sprint (i.e. after 60 s of ischaemia). This further indicates that during incremental exercise, exhaustion is not due to reduced glycolytic power. It is important to emphasize that, even with low availability of utilizable phosphagens, the mean power achieved during the sprint was 421 W, far above the 256 W achieved at exhaustion during the incremental exercise test in normoxia.
Magnitude of the anaerobic energy reserve still available at exhaustion
By adding the amount of ATP resynthesized by glycolysis (anaerobic) during the 60 s occlusion and that produced during the subsequent sprint we have estimated that at least 17–18 mmol ATP (kg w.w.)−1 were available when the subjects stopped pedalling due to exhaustion during the incremental exercise. Theoretically, this amount of energy would suffice for ∼30 additional seconds even without using any oxygen. Had the oxidative phosphorylation been working at 100% of its power, then this amount of anaerobic energy would permit 7–8 extra minutes of exercise at the same intensity at which exhaustion occurred during the incremental exercise in normoxia.
Is fatigue during incremental exercise occurring to prevent catastrophic damage to the muscles?
It has been suggested that fatigue occurs to avoid a catastrophic failure of homoeostasis in the exercising muscles (Noakes et al. 2004), although the mechanisms that could cause catastrophic damage during exhausting muscle contraction in healthy humans have not been defined. Our results indicate that, during an incremental exercise to exhaustion, task failure occurs without signs of muscle functional impairment beyond that explained by the reduction of high‐power energy substrates. Nevertheless, we cannot rule out a potential contribution by reduced sarcolemmal excitability.
Limitations
The ATP turnover due to glycolysis and phosphagens during the sprints following 10 and 60 s ischaemic recovery was indirectly assessed by calculating the O2 deficit. Although this method has been validated (Bangsbo et al. 1990), it is less accurate than a direct assessment of metabolic fluxes using muscle biopsies. While the glycolytic flux was directly determined during the occlusions, this was not the case during the sprints after ischaemia. However, given the fact that ischaemia prevents ATP and PCr recovery, the sprints post‐ischaemia started with low levels of PCr (5–10% of value at rest) and reduced ATP concentration, with almost no margin for further reduction (Sahlin et al. 1975; Harris et al. 1976; Cheetham et al. 1986; Greenhaff et al. 1993; Bogdanis et al. 1996). Thus, at least 90% of the anaerobic ATP turnover during the post‐ischaemic sprints is explained by the energy supplied by the glycolysis (anaerobic).
Our invasive data indicate (see companion article, Calbet et al. 2015) that there is no lactate release from the muscles during the first 10 s of the control sprints. However, some lactate could have been released during the sprints preceded by ischaemia due to the high sarcoplasmic lactate concentration leading to an underestimation of the true glycolytic rate. Nevertheless, even assuming a lactate arteriovenous difference of 3 mmol, only a small fraction of the lactate produced (less than 10%) could have left the legs during the sprints. Thus, our calculations are conservative, and the reserve in glycolytic capacity at task failure may be even greater than reported in this investigation.
In summary, we have shown that strong activation of the glycolytic and phosphagen metabolism occurs in the last stages of an incremental exercise test to exhaustion resulting in muscle lactate levels similar to those reported after 30 s all‐out tests. Nevertheless, exhaustion is not due to the accumulation of lactate and the associated muscle acidification. We have also demonstrated that neither the aerobic energy pathways nor the glycolysis are blocked at exhaustion. Moreover, the glycolysis may contribute up to 50% of the ATP resynthesis during the first minute after exhaustion. Finally, in agreement with previous animal studies in vitro, we have demonstrated that lactate accumulation may actually facilitate early recovery after exhaustive exercise in humans.
Additional information
Competing interests
None of the authors has any conflicts of interests.
Author contributions
Experiments were carried out at the Human Performance Laboratory of the University of Las Palmas de Gran Canaria. Conception and design of the experiments: J.A.L.C. Pre‐testing and experimental preparation: D.M.‐A., J.L.‐R., R.T.‐P., M.M.‐R., M.P.‐V., D.C., J.G.P.‐G. and J.A.L.C. Data collection during the main experiments: D.M.‐A., J.L.‐R., R.T.‐P., M.M.‐R., M.P.‐V., D.C., J.G.P.‐G. and J.A.L.C. Data assembly and analysis: D.M.‐A., J.L.‐R., R.T.‐P., M.M.‐R., M.P.‐V., A.S. and J.A.L.C. The first version of the manuscript was written by D.M.‐A. and J.A.L.C. All co‐authors read, contributed with comments and approved the final version of the manuscript.
Funding
This study was supported by a grant from the Ministerio de Educación y Ciencia of Spain (DEP2009‐11638 and FEDER) and VII Convocatoria de Ayudas a la Investigación Cátedra Real Madrid‐Universidad Europea de Madrid (2015/04RM).
Acknowledgements
Special thanks are given to José Navarro de Tuero and Ismael Perez‐Suarez for their excellent technical assistance.
References
- Allen D & Westerblad H (2004). Physiology. Lactic acid–the latest performance‐enhancing drug. Science 305, 1112–1113. [DOI] [PubMed] [Google Scholar]
- Allen DG, Lamb GD & Westerblad H (2008). Skeletal muscle fatigue: cellular mechanisms. Physiol Rev 88, 287–332. [DOI] [PubMed] [Google Scholar]
- Amann M & Calbet JA (2008). Convective oxygen transport and fatigue. J Appl Physiol (1985) 104, 861–870. [DOI] [PubMed] [Google Scholar]
- Amann M & Dempsey JA (2008). Locomotor muscle fatigue modifies central motor drive in healthy humans and imposes a limitation to exercise performance. J Physiol 586, 161–173. [DOI] [PMC free article] [PubMed] [Google Scholar]
- Amann M, Romer LM, Subudhi AW, Pegelow DF & Dempsey JA (2007). Severity of arterial hypoxaemia affects the relative contributions of peripheral muscle fatigue to exercise performance in healthy humans. J Physiol 581, 389–403. [DOI] [PMC free article] [PubMed] [Google Scholar]
- Bangsbo J, Gollnick PD, Graham TE, Juel C, Kiens B, Mizuno M & Saltin B (1990). Anaerobic energy production and O2 deficit‐debt relationship during exhaustive exercise in humans. J Physiol 422, 539–559. [DOI] [PMC free article] [PubMed] [Google Scholar]
- Bar‐Or O (1987). The Wingate anaerobic test. An update on methodology, reliability and validity. Sports Med 4, 381–394. [DOI] [PubMed] [Google Scholar]
- Bergstrom J (1962). Muscle electrolytes in man. Scand J Clin Lab Invest Suppl 68, 1–110. [Google Scholar]
- Blei ML, Conley KE & Kushmerick MJ (1993). Separate measures of ATP utilization and recovery in human skeletal muscle. J Physiol 465, 203–222. [DOI] [PMC free article] [PubMed] [Google Scholar]
- Bogdanis GC, Nevill ME, Boobis LH & Lakomy HK (1996). Contribution of phosphocreatine and aerobic metabolism to energy supply during repeated sprint exercise. J Appl Physiol (1985) 80, 876–884. [DOI] [PubMed] [Google Scholar]
- Bogdanis GC, Nevill ME, Boobis LH, Lakomy HK & Nevill AM (1995). Recovery of power output and muscle metabolites following 30 s of maximal sprint cycling in man. J Physiol 482, 467–480. [DOI] [PMC free article] [PubMed] [Google Scholar]
- Bogdanis GC, Nevill ME, Lakomy HK & Boobis LH (1998). Power output and muscle metabolism during and following recovery from 10 and 20 s of maximal sprint exercise in humans. Acta Physiol Scand 163, 261–272. [DOI] [PubMed] [Google Scholar]
- Boushel R, Gnaiger E, Calbet JA, Gonzalez‐Alonso J, Wright‐Paradis C, Sondergaard H, Ara I, Helge JW & Saltin B (2011). Muscle mitochondrial capacity exceeds maximal oxygen delivery in humans. Mitochondrion 11, 303–307. [DOI] [PubMed] [Google Scholar]
- Calbet JA, Boushel R, Radegran G, Sondergaard H, Wagner PD & Saltin B (2003). Determinants of maximal oxygen uptake in severe acute hypoxia. Am J Physiol Regul Integr Comp Physiol 284, R291–R303. [DOI] [PubMed] [Google Scholar]
- Calbet JA, Chavarren J & Dorado C (1997). Fractional use of anaerobic capacity during a 30‐ and a 45‐s Wingate test. Eur J Appl Physiol Occup Physiol 76, 308–313. [DOI] [PubMed] [Google Scholar]
- Calbet JA & Joyner MJ (2010). Disparity in regional and systemic circulatory capacities: do they affect the regulation of the circulation? Acta Physiol (Oxf) 199, 393–406. [DOI] [PMC free article] [PubMed] [Google Scholar]
- Calbet JAL, Losa‐Reyna J, Torres‐Peralta R, Rasmussen P, Ponce‐González JG, Sheel AW, de la Calle‐Herrero J, Guadalupe‐Grau A, Morales‐Alamo D, Fuentes T, Rodríguez‐García L, Siebenmann C, Boushel R & Lundby C (2015). Limitations to oxygen transport and utilisation during sprint exercise in humans: evidence for a functional reserve in muscle O2 diffusing capacity. J Physiol 593, 4649–4664. [DOI] [PMC free article] [PubMed] [Google Scholar]
- Calbet JA & Lundby C (2012). Skeletal muscle vasodilatation during maximal exercise in health and disease. J Physiol 590, 6285–6296. [DOI] [PMC free article] [PubMed] [Google Scholar]
- Calbet JA, Lundby C, Sander M, Robach P, Saltin B & Boushel R (2006). Effects of ATP‐induced leg vasodilation on VO2peak and leg O2 extraction during maximal exercise in humans. Am J Physiol Regul Integr Comp Physiol 291, R447–R453. [DOI] [PubMed] [Google Scholar]
- Chasiotis D, Sahlin K & Hultman E (1982). Regulation of glycogenolysis in human muscle at rest and during exercise. J Appl Physiol Respir Environ Exerc Physiol 53, 708–715. [DOI] [PubMed] [Google Scholar]
- Cheetham ME, Boobis LH, Brooks S & Williams C (1986). Human muscle metabolism during sprint running. J Appl Physiol (1985) 61, 54–60. [DOI] [PubMed] [Google Scholar]
- Chwalbinska‐Moneta J, Robergs RA, Costill DL & Fink WJ (1989). Threshold for muscle lactate accumulation during progressive exercise. J Appl Physiol (1985) 66, 2710–2716. [DOI] [PubMed] [Google Scholar]
- Clanton TL, Hogan MC & Gladden LB (2013). Regulation of cellular gas exchange, oxygen sensing, and metabolic control. Compr Physiol 3, 1135–1190. [DOI] [PubMed] [Google Scholar]
- Constantin‐Teodosiu D, Carlin JI, Cederblad G, Harris RC & Hultman E (1991). Acetyl group accumulation and pyruvate dehydrogenase activity in human muscle during incremental exercise. Acta Physiol Scand 143, 367–372. [DOI] [PubMed] [Google Scholar]
- Davies CT, Di Prampero PE & Cerretelli P (1972). Kinetics of cardiac output and respiratory gas exchange during exercise and recovery. J Appl Physiol (1985) 32, 618–625. [DOI] [PubMed] [Google Scholar]
- Dorado C, Sanchis‐Moysi J & Calbet JA (2004). Effects of recovery mode on performance, O2 uptake, and O2 deficit during high‐intensity intermittent exercise. Can J Appl Physiol 29, 227–244. [DOI] [PubMed] [Google Scholar]
- Fitts RH (1994). Cellular mechanisms of muscle fatigue. Physiol Rev 74, 49–94. [DOI] [PubMed] [Google Scholar]
- Fletcher WM & Hopkins FG (1907). Lactic acid in amphibian muscle. J Physiol 35, 247–309. [DOI] [PMC free article] [PubMed] [Google Scholar]
- Gaesser GA & Brooks GA (1975). Muscular efficiency during steady‐rate exercise: effects of speed and work rate. J Appl Physiol 38, 1132–1139. [DOI] [PubMed] [Google Scholar]
- Gnaiger E (2001). Bioenergetics at low oxygen: dependence of respiration and phosphorylation on oxygen and adenosine diphosphate supply. Respir Physiol 128, 277–297. [DOI] [PubMed] [Google Scholar]
- González Henríquez JJ, Losa‐Reyna J, Torres‐Peralta R, Göran R, Koskolou M & Calbet JAL (2015). A new equation to estimate temperature‐corrected PaCO2 from PETCO2 during exercise in normoxia and hypoxia. Scand J Med Sci Sports. DOI: 10.1111/sms.12545 [DOI] [PubMed] [Google Scholar]
- Greenhaff PL, Soderlund K, Ren JM & Hultman E (1993). Energy metabolism in single human muscle fibres during intermittent contraction with occluded circulation. J Physiol 460, 443–453. [DOI] [PMC free article] [PubMed] [Google Scholar]
- Guerra B, Gomez‐Cabrera MC, Ponce‐Gonzalez JG, Martinez‐Bello VE, Guadalupe‐Grau A, Santana A, Sebastia V, Vina J & Calbet JA (2011). Repeated muscle biopsies through a single skin incision do not elicit muscle signaling, but IL‐6 mRNA and STAT3 phosphorylation increase in injured muscle. J Appl Physiol (1985) 110, 1708–1715. [DOI] [PubMed] [Google Scholar]
- Harris RC, Edwards RH, Hultman E, Nordesjö LO, Nylind B & Sahlin K (1976). The time course of phosphorylcreatine resynthesis during recovery of the quadriceps muscle in man. Pflugers Arch 367, 137–142. [DOI] [PubMed] [Google Scholar]
- Harris RC, Hultman E, Kaijser L & Nordesjö LO (1975). The effect of circulatory occlusion on isometric exercise capacity and energy metabolism of the quadriceps muscle in man. Scand J Clin Lab Invest 35, 87–95. [PubMed] [Google Scholar]
- Hermansen L & Vaage O (1977). Lactate disappearance and glycogen synthesis in human muscle after maximal exercise. Am J Physiol 233, E422–E429. [DOI] [PubMed] [Google Scholar]
- Hinkle PC, Kumar MA, Resetar A & Harris DL (1991). Mechanistic stoichiometry of mitochondrial oxidative phosphorylation. Biochemistry 30, 3576–3582. [DOI] [PubMed] [Google Scholar]
- Hollidge‐Horvat MG, Parolin ML, Wong D, Jones NL & Heigenhauser GJ (1999). Effect of induced metabolic acidosis on human skeletal muscle metabolism during exercise. Am J Physiol 277, E647–E658. [DOI] [PubMed] [Google Scholar]
- Hureau TJ, Olivier N, Millet GY, Meste O & Blain GM (2014). Exercise performance is regulated during repeated sprints to limit the development of peripheral fatigue beyond a critical threshold. Exp Physiol 99, 951–963. [DOI] [PubMed] [Google Scholar]
- Jansson E, Sylven C & Nordevang E (1982). Myoglobin in the quadriceps femoris muscle of competitive cyclists and untrained men. Acta Physiol Scand 114, 627–629. [DOI] [PubMed] [Google Scholar]
- Katz A, Sahlin K & Henriksson J (1986). Muscle ATP turnover rate during isometric contraction in humans. J Appl Physiol (1985) 60, 1839–1842. [DOI] [PubMed] [Google Scholar]
- Koike A, Wasserman K, McKenzie DK, Zanconato S & Weiler‐Ravell D (1990). Evidence that diffusion limitation determines oxygen uptake kinetics during exercise in humans. J Clin Invest 86, 1698–1706. [DOI] [PMC free article] [PubMed] [Google Scholar]
- Losa‐Reyna J, Torres‐Peralta R, González‐Henriquez JJ & Calbet JAL (2015). Arterial to end‐tidal PCO2 difference during exercise in normoxia and severe acute hypoxia: importance of blood temperature correction. Physiol Rep. DOI: 10.14814/phy2.12512 [DOI] [PMC free article] [PubMed] [Google Scholar]
- Lowry OH & Passonneau JV (1972). A Flexible System of Enzymatic Analysis. Academic Press, New York. [Google Scholar]
- Medbo JI & Tabata I (1993). Anaerobic energy release in working muscle during 30 s to 3 min of exhausting bicycling. J Appl Physiol (1985) 75, 1654–1660. [DOI] [PubMed] [Google Scholar]
- Mitchell JH & Saltin B (2003). The oxygen transport system and maximal oxygen uptake In Exercise Physiology, ed. Tipton CM, pp. 255–291. Oxford University Press, Oxford. [Google Scholar]
- Mitchell JH, Sproule BJ & Chapman CB (1958). The physiological meaning of the maximal oxygen intake test. J Clin Invest 37, 538–547. [DOI] [PMC free article] [PubMed] [Google Scholar]
- Morales‐Alamo D, Ponce‐González JG, Guadalupe‐Grau A, Rodríguez‐García L, Santana A, Cusso R, Guerrero M, Dorado C, Guerra B & Calbet JA (2013). Critical role for free radicals on sprint exercise‐induced CaMKII and AMPKα phosphorylation in human skeletal muscle. J Appl Physiol (1985) 114, 566–577. [DOI] [PubMed] [Google Scholar]
- Morales‐Alamo D, Ponce‐González JG, Guadalupe‐Grau A, Rodríguez‐García L, Santana A, Cusso MR, Guerrero M, Guerra B, Dorado C & Calbet JAL (2012). Increased oxidative stress and anaerobic energy release, but blunted Thr172‐AMPKα phosphorylation, in response to sprint exercise in severe acute hypoxia in humans. J Appl Physiol (1985) 113, 917–928. [DOI] [PubMed] [Google Scholar]
- Nelson FE, Ortega JD, Jubrias SA, Conley KE & Kushmerick MJ (2011). High efficiency in human muscle: an anomaly and an opportunity? J Exp Biol 214, 2649–2653. [DOI] [PMC free article] [PubMed] [Google Scholar]
- Noakes TD, St Clair Gibson A & Lambert EV (2004). From catastrophe to complexity: a novel model of integrative central neural regulation of effort and fatigue during exercise in humans. Br J Sports Med 38, 511–514. [DOI] [PMC free article] [PubMed] [Google Scholar]
- Parolin ML, Chesley A, Matsos MP, Spriet LL, Jones NL & Heigenhauser GJ (1999). Regulation of skeletal muscle glycogen phosphorylase and PDH during maximal intermittent exercise. Am J Physiol 277, E890–E900. [DOI] [PubMed] [Google Scholar]
- Parolin ML, Spriet LL, Hultman E, Hollidge‐Horvat MG, Jones NL & Heigenhauser GJ (2000). Regulation of glycogen phosphorylase and PDH during exercise in human skeletal muscle during hypoxia. Am J Physiol Endocrinol Metab 278, E522–E534. [DOI] [PubMed] [Google Scholar]
- Pedersen TH, Clausen T & Nielsen OB (2003). Loss of force induced by high extracellular [K+] in rat muscle: effect of temperature, lactic acid and β2‐agonist. J Physiol 551, 277–286. [DOI] [PMC free article] [PubMed] [Google Scholar]
- Pedersen TH, Nielsen OB, Lamb GD & Stephenson DG (2004). Intracellular acidosis enhances the excitability of working muscle. Science 305, 1144–1147. [DOI] [PubMed] [Google Scholar]
- Putman CT, Jones NL, Hultman E, Hollidge‐Horvat MG, Bonen A, McConachie DR & Heigenhauser GJ (1998). Effects of short‐term submaximal training in humans on muscle metabolism in exercise. Am J Physiol 275, E132–E139. [DOI] [PubMed] [Google Scholar]
- Quistorff B, Johansen L & Sahlin K (1993). Absence of phosphocreatine resynthesis in human calf muscle during ischaemic recovery. Biochem J 291, 681–686. [DOI] [PMC free article] [PubMed] [Google Scholar]
- Ratel S, Bedu M, Hennegrave A, Dore E & Duche P (2002). Effects of age and recovery duration on peak power output during repeated cycling sprints. Int J Sports Med 23, 397–402. [DOI] [PubMed] [Google Scholar]
- Richardson RS, Noyszewski EA, Kendrick KF, Leigh JS & Wagner PD (1995). Myoglobin O2 desaturation during exercise. Evidence of limited O2 transport. J Clin Invest 96, 1916–1926. [DOI] [PMC free article] [PubMed] [Google Scholar]
- Rossman MJ, Venturelli M, McDaniel J, Amann M & Richardson RS (2012). Muscle mass and peripheral fatigue: a potential role for afferent feedback? Acta Physiol (Oxf) 206, 242–250. [DOI] [PMC free article] [PubMed] [Google Scholar]
- Sahlin K & Harris RC (2011). The creatine kinase reaction: a simple reaction with functional complexity. Amino Acids 40, 1363–1367. [DOI] [PubMed] [Google Scholar]
- Sahlin K, Harris RC & Hultman E (1975). Creatine kinase equilibrium and lactate content compared with muscle pH in tissue samples obtained after isometric exercise. Biochem J 152, 173–180. [DOI] [PMC free article] [PubMed] [Google Scholar]
- Sahlin K, Harris RC, Nylind B & Hultman E (1976). Lactate content and pH in muscle obtained after dynamic exercise. Pflugers Arch 367, 143–149. [DOI] [PubMed] [Google Scholar]
- Smith NP, Barclay CJ & Loiselle DS (2005). The efficiency of muscle contraction. Prog Biophys Mol Biol 88, 1–58. [DOI] [PubMed] [Google Scholar]
- Spriet LL, Matsos CG, Peters SJ, Heigenhauser GJ & Jones NL (1985). Effects of acidosis on rat muscle metabolism and performance during heavy exercise. Am J Physiol 248, C337–C347. [DOI] [PubMed] [Google Scholar]
- Spriet LL, Soderlund K, Bergstrom M & Hultman E (1987). Skeletal muscle glycogenolysis, glycolysis, and pH during electrical stimulation in men. J Appl Physiol (1985) 62, 616–621. [DOI] [PubMed] [Google Scholar]
- Torres‐Peralta R, Losa‐Reyna J, Gonzalez‐Izal M, Perez‐Suarez I, Calle‐Herrero J, Izquierdo M & Calbet JA (2014). Muscle activation during exercise in severe acute hypoxia: role of absolute and relative intensity. High Alt Med Biol 15, 472–482. [DOI] [PMC free article] [PubMed] [Google Scholar]
- van Hall G, Lundby C, Araoz M, Calbet JA, Sander M & Saltin B (2009). The lactate paradox revisited in lowlanders during acclimatization to 4100 m and in high‐altitude natives. J Physiol 587, 1117–1129. [DOI] [PMC free article] [PubMed] [Google Scholar]
- Wang W, Wang Z, Faith MS, Kotler D, Shih R & Heymsfield SB (1999). Regional skeletal muscle measurement: evaluation of new dual‐energy X‐ray absorptiometry model. J Appl Physiol (1985) 87, 1163–1171. [DOI] [PubMed] [Google Scholar]
- Westerblad H & Allen DG (2011). Emerging roles of ROS/RNS in muscle function and fatigue. Antioxid Redox Signal 15, 2487–2499. [DOI] [PubMed] [Google Scholar]
- Westerblad H, Bruton JD & Lannergren J (1997). The effect of intracellular pH on contractile function of intact, single fibres of mouse muscle declines with increasing temperature. J Physiol 500, 193–204. [DOI] [PMC free article] [PubMed] [Google Scholar]