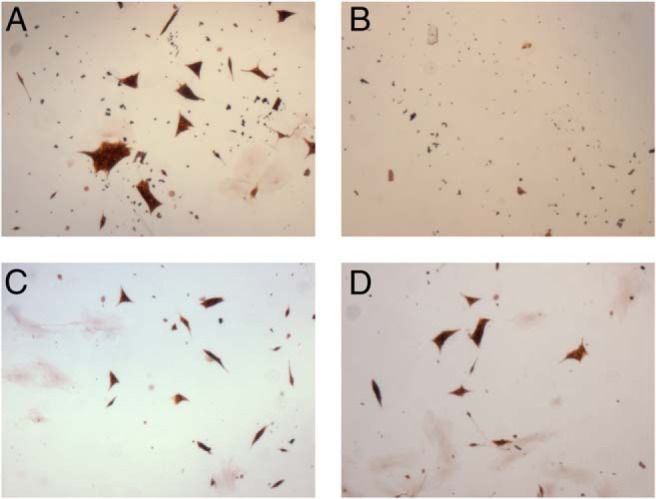
Figure 2.

Primary cell culture growth inhibition by LMP-400. The figure shows the effect of LMP-400 on a primary cell culture, with decreasing concentrations of the drug: control (A), 1 μM (B), 0.1 μM (C), and 0.01 μM (D). The primary culture was derived from a 10- × 9- × 8-cm PHEO in a 53-year-old patient of Greek descent with typical clinical symptoms. Genetic testing for succinate dehydrogenase subunits B, C, and D was negative; other testing was not performed.
