

Summary
Modern flow cytometers can make optical measurements of 10 or more parameters per cell at tens-of-thousands of cells per second and over five orders of magnitude dynamic range. Although flow cytometry is used in most drug discovery stages, “sip-and-spit” sampling technology has restricted it to low sample throughput applications. The advent of HyperCyt sampling technology has recently made possible primary screening applications in which tens-of-thousands of compounds are analyzed per day. Target-multiplexing methodologies in combination with extended multi-parameter analyses enable profiling of lead candidates early in the discovery process, when the greatest numbers of candidates are available for evaluation. The ability to sample small volumes with negligible waste reduces reagent costs, compound usage and consumption of cells. Improved compound library formatting strategies can further extend primary screening opportunities when samples are scarce. Dozens of targets have been screened in 384- and 1536-well assay formats, predominantly in academic screening lab settings. In concert with commercial platform evolution and trending drug discovery strategies, HyperCyt-based systems are now finding their way into mainstream screening labs. Recent advances in flow-based imaging, mass spectrometry and parallel sample processing promise dramatically expanded single cell profiling capabilities to bolster systems level approaches to drug discovery.
Keywords: Flow cytometry, Phenotypic drug discovery, Protein-protein interactions, multiplex assays and technology, High content screening, Review
Introduction
At the time of its development in the latter part of the last century, flow cytometry represented an unparalleled advance in the speed with which it was possible to make quantitative, multi-parameter measurements on single cells 1–3. Large populations (thousands) of cells could be routinely evaluated in seconds as compared to the hundreds in minutes feasible by conventional microscopy of the time. Today, even the most modestly priced modern flow cytometers can distinguish and make quantitatively precise measurements from cells in a single sample that may differ by as many as five orders of magnitude in fluorescence intensity, ranging from as few as 50 fluorophores per cell to 5 million or more 4, 5. Many flow cytometers use hydrodynamic focusing, a technique that encloses the sample stream within a more rapidly flowing sheath stream, to narrow the sample stream diameter to approximate that of a typical cell. A cell thus displaces most of the sample stream liquid in its immediate vicinity so that when it passes through the spot of the laser beam (also of diameter similar to the cell), it is predominantly cell-associated fluorophores that are excited and detected. This configuration geometry dramatically diminishes the contribution of unbound fluorophores to the fluorescence signal and enables the flow cytometer to make biologically significant optical measurements without wash steps 6–8. To a first approximation, the data acquisition capabilities of modern flow cytometers are relatively insensitive to the number of optical parameters that are detected. The ability to accurately measure each parameter is primarily limited by the properties of the fluorescent probes (e.g., quantum yield, spectral overlap) and features of the targeted particles (e.g., autofluorescence and number of determinants available for probe binding). Currently capable of detecting 20 or more discrete optical parameters per cell at tens of thousands of cells per second 1, flow cytometry remains unequaled in sensitivity, dynamic range and information content, for applications requiring high-speed analysis of single cells or particles in suspensions.
The flow cytometer has been used both in pharma and biotech companies at every stage of the drug discovery cycle, including target identification and validation, hit identification, lead and candidate selection and safety studies 9. However, its use has typically been restricted to applications tolerant of relatively low rates of sample throughput. This has reflected limitations of the conventional flow cytometer “sip-and-spit” sample processing approach in which each sample aspiration cycle is followed by a back-flush cycle to clean the sample uptake line. The back-flush cycle significantly lengthens sample processing time. It also results in loss of the unanalyzed volume of sample that remains in the uptake line, often a significant fraction of the total aspirated sample, sending it to waste. Slowing the sampling process further is the necessity to save data acquired from each sample to a data file before beginning data acquisition for the next sample. Automated systems using this sampling approach have typically required up to an hour or more to read a 96-well plate. The sample processing speed of this approach has been boosted several-fold with the commercialization of the High Throughput Sampler system by Becton Dickinson as an accessory for certain of their flow cytometers. While this has better enabled screening of small, focused libraries containing hundreds to thousands of compounds 10, it has still been inadequate to accommodate the scale and size of assays run in many drug screening laboratories.
Exploiting time and air
The concept of collecting data from multiple samples into a single temporally resolved data file was first advanced in 1991 as a solution for speeding multi-sample analysis by eliminating the time demands imposed by saving data from each sample as a separate file 11. During a single extended round of data acquisition sample tubes were introduced one at a time into the sample uptake pathway. Between samples a coded voltage pulse was manually applied to one of the data acquisition channels. The pulse served as a time stamp by which the time domain boundaries for each sample’s data could be distinguished in subsequent analysis of the extended data file, a process designated as time interval gating 11, 12.
A faster and more automated approach, called plug flow cytometry, was subsequently developed that used a reciprocating, multiport flow injection valve with two 5 μL sample loops to serially process samples 13. A sample would be aspirated into loop 1 while a second sample in loop 2 was being simultaneously delivered to the flow cytometer for analysis. A switch of the valve to its alternate position allowed filling of loop 2 with a third sample while the loop 1 sample was analyzed. Continuous reciprocation of the valve and acquisition of data in a single, time-resolved data file enabled processing of up to 10 endpoint assay samples per min, 4 online sample mixing experiments per min and a 15-point concentration gradient dose-response experiment in less than 2 min 14, 15
Introducing air bubbles into the sample stream of a flow cytometer was (and still is) considered to be undesirable for many types of analysis due to disruption resulting from passage of a bubble through the laser beam. However, in time-resolved data acquisition, bubble passage events could easily be distinguished and used as an efficient means for segregating a data stream into discrete, unperturbed segments 16. This finding was exploited to implement the more rapid and flexible sample processing approach called HyperCyt; samples and air bubbles were alternately aspirated into a sample line and delivered to the flow cytometer as a segmented sample stream by a continuously rotating peristaltic pump, perhaps more akin to a “sip-and-whiff” approach 17, 18 (Fig. 1). For highest throughput the aspirated samples are typically 1–2 μL in volume to enable, for example, processing of a 384-well plate in 10 min or less. In contrast to the “sip-and-spit” approach, total assay volumes in a well can be as small as 4–5 μL and each aspirated sample is analyzed in its entirety, with little measurable dead volume. Larger sample volumes are also manageable, limited only by the total volume available in the well. Because of the unique use of air bubbles to segment a continuous stream of samples, it has been considered important to characterize performance features of the system in some detail, including determinants for control of fluid and particle carryover between samples 19, effective particle concentration ranges 18, inline mixing of convergent sample streams 20, 21, fluid carryover in association with inline receptor stimulation for delivery to a cell sorter 22, immunophenotyping 18 and compound screening 23.
Figure 1.
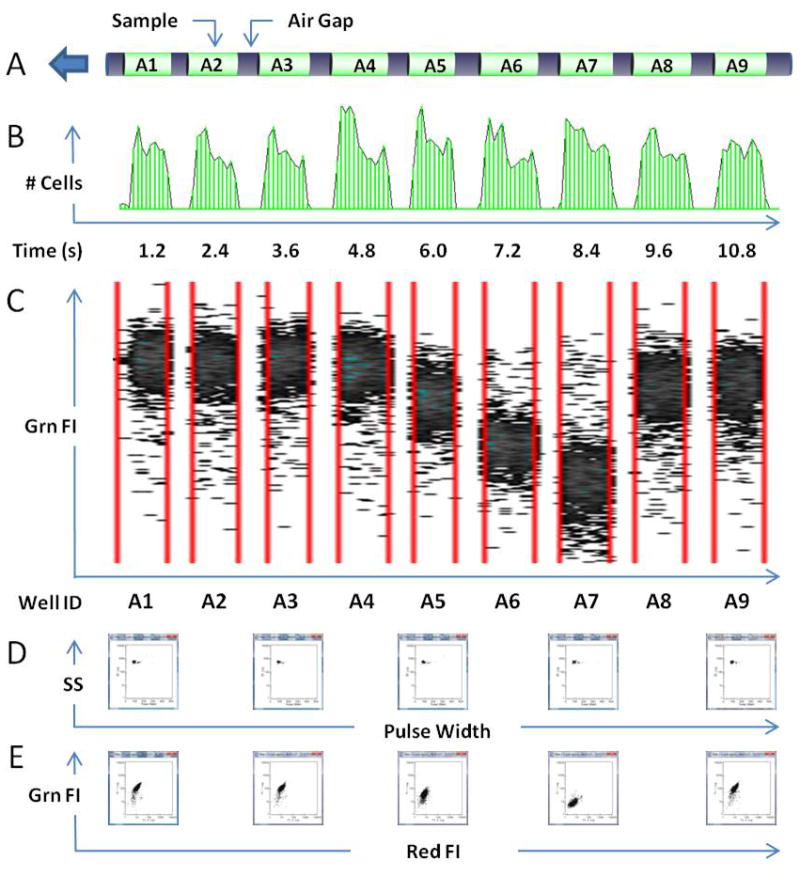
HyperCyt-based high throughput flow cytometry. A. Samples from wells A1 to A9 (green) are delivered to the flow cytometer (arrow) as a series of 2 μL volumes separated by air gaps (black). B. Cells in each sample generate a pulse of events (~2000 cells/sample) as they pass through the point of detection in the flow cytometer. Gaps between peaks represent the passage of air bubbles. Each peak receives a time stamp corresponding to its time of appearance (horizontal axis labels). C. Boundaries are determined for each sample peak (red lines) and well IDs (horizontal axis labels) are assigned on the basis of time stamps. Green fluorescence intensity (Grn FI) of individual cells (dots) is plotted for each well. D. Dot plots of forward scattered light pulse width vs. side scattered light intensity (SS) for cells in 5 of the wells. E. Dot plots of red fluorescence intensity (Red FI) vs. Grn FI for cells in the same 5 wells.
Since 2005, when the University of New Mexico Center for Molecular Discovery (UNMCMD, originally the New Mexico Molecular Libraries Screening Center) first joined the USA national Molecular Libraries Screening Center Network, the platform has been used to screen, predominantly in 384-well format, more than 60 biological targets to produce more than 13 million data values that are publically accessible on the PubChem website 24. IntelliCyt Corporation (Albuquerque, NM) was founded in 2006 to commercialize the HyperCyt platform. Compatibility of the HyperCyt platform with high-density, 1536-well screening format was first introduced at the UNMCMD in 2012 25, and is now in routine use 26–30. Two fully integrated HyperCyt-based systems enabled for high density, 1536-well screening were subsequently introduced in 2014, one a commercial platform from IntelliCyt (iQue Screener HD, http://www.intellicyt.com/ique-screener.html) and another by a group at the Genomics Institute of the Novartis Research Foundation 31. Thus, there is now a wealth of data to support the validity of this approach for compound screening as well as commercial systems capable of HTS in low- to high-density plate formats.
The intent of this review is to 1) highlight selected screening projects at the UNMCMD and elsewhere that exemplify platform features of importance in high throughput screening, 2) discuss evolution of the platform and trends that have influenced its adoption, and 3) review recent technological advances and industry trends likely to impact flow cytometry applications in drug discovery now and in coming years.
Target-based screening
A frequent screening objective is to identify compounds that disrupt or augment binding interactions between specified molecules. This is commonly referred to as target-based screening as the identities of the molecules with which compounds may interact are known and directly targeted. Typical examples are receptor-ligand interactions such as proteins binding to other proteins, peptides, or polynucleotides.
Target Multiplexing With Beads
A particularly attractive feature of flow cytometry is the high-dimensionality of the data that can be obtained. Not only is it easily possible to discriminate from 6 to as many as 20 optical parameters in parallel, but the broad intensity response range of modern instruments (5 orders of magnitude or more) can be exploited for intensity encoding of cells and beads within one or more optical parameter detection channels to produce even higher levels of dimensionality. While such encoding occurs naturally (for example, large and small particles or cells discriminated on the basis of forward light scatter intensity), it can be artificially implemented as a means for discriminating multiple distinct biological targets in a single sample.
An extreme example is illustrated by the bead-based xMAP system from Luminex Corporation (Austin, TX) in which intensity encoding with 10 concentrations each of red and orange fluorescent dyes produces 100 sets of beads that can be distinguished in a correlated plot of two optical parameter channels 32(Fig. 2A). Each bead set can be engineered to express or capture a different target analyte (protein, DNA, etc.) and a green fluorescent reporter molecule, detected in a third optical parameter channel, is used to quantify the analyte. In this fashion, only 3 fluorescence channels are required for quantifying 100 analyte targets in a single well.
Figure 2.
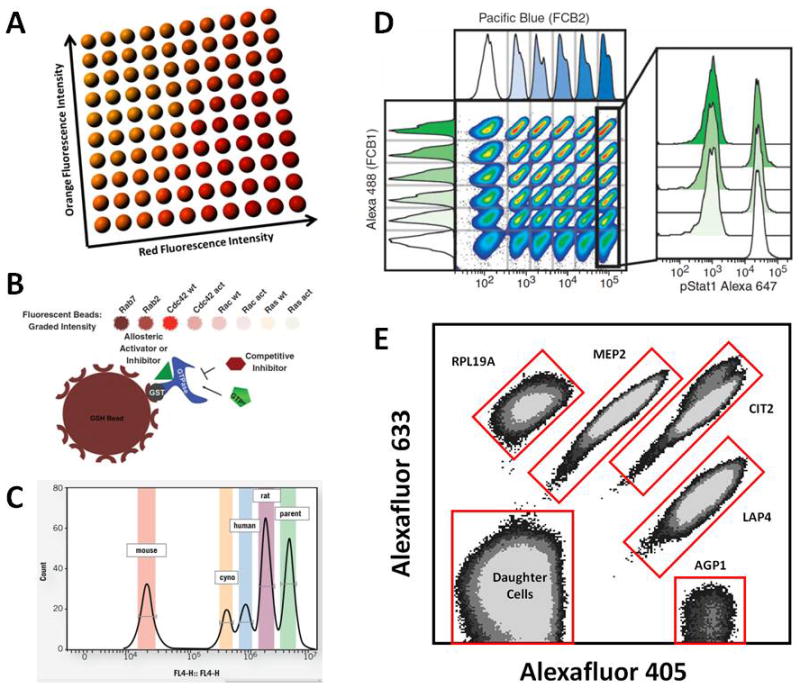
Configurations for multiplexed flow cytometry analysis in target-based and phenotypic screening. A. Cartoon illustrating a Luminex xMap bead suspension array (www.luminex.com). Beads are barcoded with 10 concentrations each of red and orange fluorescent dyes and resolved as 100 distinct sets in a correlated plot of red vs orange fluorescence intensity. Each bead set is engineered to capture a different target analyte and a green fluorescent reporter molecule is used to quantify the analyte (not shown). B. Fluorescent barcoding of beads with 8 concentrations of a red fluorescent dye for use in a high throughput screen to detect GTPase inhibitors. To each bead set was bound a different glutathione-S-transferase (GST)–tagged GTPase. Displacement of green fluorescent GTP from individual bead sets by compound represented inhibition via competitive (hexagon) or allosteric (triangle) mechanisms. Reproduced with permission from Z. Surviladze et al., J Biomol Screening 15:10, 2010. Copyright 2010, Society for Laboratory Automation and Screening. C. Five concentrations of red fluorescent dye were used to barcode cells expressing orthologs of a targeted protein from mouse, cynomolgus monkey (cyno), human, and rat, and the non-expressing parental cell line (parent). Hybridoma supernatants were screened to assess binding potency and specificity of antibodies as assessed with a green fluorescent antibody reporter (not shown). Reproduced with permission from www.intellicyt.com Application Notes: Multiplexed Antibody Characterization (S.R. Watson, XOMA Corp). D. Fluorescent barcoding of cells for Phosflow analysis. Thirty-six samples of myeloid cells were barcoded with 6 concentrations each of green (Alexa 488) and blue (Pacific Blue) fluorescent dyes. Alternating samples were stimulated with interferon-γ and assessed for intracellular levels of phosphorylated Stat1 (pStat1) as quantified with red fluorescent anti-pStat1 antibodies (pStat1 Alexa 647). Reproduced with permission from P.O. Krutzik and G.P. Nolan, Nature Methods 3:361, 2006. Copyright 2006, Nature Publishing Group. E. Screening for small molecule modulators of Target of Rapamycin (TOR) signaling pathways. Five yeast clones were barcoded with 3 concentrations each of a blue (Alexafluor 405) and red (Alexafluor 633) fluorescent dye. During the 3 hour course of the assay the barcoded cells produced a sixth, non-barcoded population of daughter cells. Each clone had a green fluorescent protein (GFP) reporter for 1 of 4 branches of the TORC1 pathway so that effects of compounds upon 4 pathways could be measured simultaneously during the primary screen (not shown). Two reporters represented different sites of the same branch (AGP1 and MEP2). Reproduced with permission from J. Chen, et al., ACS Chem. Biol. 7:715, 2012. Copyright 2012, American Chemical Society.
Bead-based platforms have been extensively used for high throughput, multiplexed target-based screening flow cytometry. For practical purposes related to complexities of assay design and reagent costs, these assays have typically been limited to multiplexes of less than 10 targets (see “Balancing throughput and content” below). In a recent, representative example, such an approach was used to identify small molecule inhibitors and activators of small GTPases, intracellular signaling proteins of 20 to 40 kDa that control diverse cellular functions. Rho family GTPases that were evaluated included wild type versions of Rab7, Rab2, Ras, Rac and Cdc42, plus mutant, constitutively activated forms of Ras, Rac and Cdc42 (Fig. 2B). All were glutathione-S-transferase (GST)–tagged, attached to red fluorescence intensity-encoded glutathione bead sets and assessed for binding of green fluorescent GTP in the presence and absence of ~200,000 compounds from the Molecular Libraries Small Molecule Repository (MLSMR) 33. This screening approach has identified a pan-inhibitor of Ras superfamily GTPases 34, inhibitors of Rho family GTPases 35, 36, a selective inhibitor of Cdc42 GTPase 37, 38. and several activators that selectively promote increased binding of GTP to Rho family GTPases 39. An attractive feature of this approach was that it enabled assessment of compound selectivity at the primary screening stage, streamlining compound prioritization for later stages in the pipeline. Immobilizing GTPases on the beads (2,000 beads/well, 106 binding sites/bead) reduced total enzyme requirements as compared to solution-based assays compatible with other screening platforms. This highlights a general rule of thumb for assembling flow cytometry binding interaction assays: it is most efficient and cost-effective to attach the most expensive or quantity-limited binding partners to the beads. Additional examples of molecular binding interactions screened with bead-based, high throughput flow cytometry applications include: the binding of 5 regulators of G-protein signaling (RGS) proteins to the G-protein Gαo 40–42, binding of 6 anti-apoptotic members of the human Bcl2 family to a common pro-apoptotic family member (Bim) 43–46, binding of an RNA aptamer to GRK2 Ser/Thr protein kinase outside of its active site 25, 47, binding to 3 MEK kinase targets (MEKK2, MEKK2 mutant and MEKK3) of the PB1 domain of MEK5 48, binding of pathogenic antibodies to a pemphigus-associated desmoglein epitope 49, binding interactions governing the catalytic cycle of the proteasome 50, and multiplexed analysis of fluorescent substrate cleavage by proteases, including lethal factor, factor Xa, and botulinum neurotoxin light chains A and F 26–28, 51–53.
Target multiplexing with cells
Target-based assays in cells are most practical when it is important that the target be displayed in a physiologically relevant context. Flow cytometric analysis of receptor-ligand interactions in intact cells may minimize ligand depletion issues associated with solution-based assays that use cell lysates 54. A more important advantage of cell-based flow cytometry assays is the ability to evaluate multiple targets in parallel by assay multiplexing.
Fluorescence intensity-based multiplexing methods in cells, popularized in nomenclature as cell fluorescent barcoding 55, have been used for discriminating collections of cells with different innate biological characteristics (e.g., clonal origin) or environmental history (e.g., previous exposure to stimulants). Cell barcoding methods have incorporated the use of varying concentrations of fluorescent dyes 56 (Fig. 2D), antibodies pre-coupled with varying ratios of fluorescence amplifying reagents 57, and varying cellular expression levels of fluorescent proteins 58. To a large extent flow cytometry screening applications using cell barcoding schemes have been for unknown target molecules where the screening assay endpoint is a cell-associated phenotype (phenotypic screening, discussed below). One target-based screen in cells, targeting a pair of G-protein coupled receptors belonging to the formylpeptide receptor family, is referenced in a separate section below. Others, highlighted here, reflect the utility recognized for target multiplexing in hybridoma screening.
Screening for biologics, in particular antibody drugs, has evolved significantly over the last 20 years 59. Screening hybridoma supernatants for specific antibodies that bind cell-based antigen is a critical component of monoclonal antibody generation and often a bottleneck in the process. Also, even when an antibody is identified that binds a human target antigen with high specificity, it may have limited ability to bind the orthologous antigen in other species, an impediment to pre-clinical testing. A recent, illustrative solution to address this issue is a flow cytometry-based hybridoma antibody screening application used at GlaxoSmithKline 9. The objective was to assess each of thousands of hybridoma supernatants for antibodies binding to 1) cells expressing a human protein of interest, 2) negative control cells expressing a related but different protein, and 3) cells expressing the orthologous protein from two different animal species of interest (cynomolgus monkey and mouse). Rather than testing supernatants against each cell line separately, the four different cell populations were barcoded by incubation with four different concentrations of a fluorescent dye (calcein-AM), then combined in wells together with hybridoma supernatants and reporter antibodies that had a fluorescence signature distinct from the barcoding dye. In subsequent analysis in a HyperCyt flow cytometry-based platform, each cell population was distinguished on the basis of barcode fluorescence and the binding profile of antibodies in each hybridoma supernatant was quantified for all four simultaneously. A similar hybridoma screening approach has been used at XOMA Corporation, an antibody therapeutics biotech in Berkeley, CA, to streamline the determination of hybridoma antibody binding profiles to orthologous antigens from four different species 60 (Fig. 2C). Such target-multiplexing methodologies enable identification of lead candidates with cross reactivity against multiple species early in the discovery process, when the greatest numbers of candidates are available for evaluation.
Phenotypic Screening
There is an ongoing paradigm shift in drug discovery from a target-centric focus to one in which pathway driven functional responses are the object of equal if not paramount interest 61. Reflecting this shift is an increasing emphasis on cell-based assays in which the objective is to identify compounds that disrupt, augment or restore a cellular phenotype such as output from a targeted signal transduction pathway or expression of a physiological profile. Cell-based phenotypic screening is attractive because it allows interrogation of entire signaling pathway networks. Even though the molecular basis of compound activity may be poorly understood, the expression of such activity in a cellular context is evidence of physiological relevance not available in a cell-free biochemical assay. Cell-based assays are also more likely to detect undesirable or toxic side effects of compounds, another impetus for their inclusion at early stages of the drug discovery pipeline. A complexity of cell-based phenotypic screening is that one or more molecules may be targeted by active compounds, so that follow up experiments are required to elucidate molecular mechanisms of action. On the other hand, since the molecular targets are unknown, this screening approach avoids the potential pitfall of poor target validation that has been advanced as a contributing cause of late stage clinical failures of drugs developed using target-centric screening approaches 62–65. Limited assumptions about target identity decrease the probability of committing resources to an invalid target.
There has been much recent debate about the relative efficacy of target-based and phenotypic drug discovery approaches in discovery of first-in-class small molecule drugs approved by the FDA. While evidence for superior success rates of phenotypic screening approaches has been documented for the period of 1999 to 2008 66, 67, a more restricted definition of phenotypic screening as entirely target agnostic together with data from a more extended time period (1999–2013) have been used and interpreted to suggest otherwise 68. Since a case can be made that many phenotypically driven screening projects are not strictly target agnostic, perhaps a more useful concept that has recently been advanced is that of “mechanism-informed phenotypic drug discovery”.69 In this approach, phenotypic assays incorporate knowledge about molecular pathways or processes that are implicated in clinically relevant responses irrespective of which molecular component(s) may be targeted. The guiding design objective of successful in vitro phenotypic assays is to capture key aspects of the relevant in vivo biology.
One approach for achieving high throughput phenotypic screening uses conventional flow cytometry in combination with complex fluorescent cell barcoding schemes 55, 70 (Fig. 2D). For example, by using 3 fluorescent dyes (4 different concentrations of two dyes and 6 of the third), a unique fluorescence signature can be conferred upon cells in each well of a 96 well plate. At the end of an assay, cells from all wells can be pooled together and analyzed in 5–7 minutes as a single sample using 3 fluorescence channels to decode source well identity and additional fluorescence channels for purposes such as phosphoprotein pathway analysis (Phosflow) or cell type identification 55. Pathway profiling analyses of very high content have been achieved with variations of this approach, with as many as 27 different cell type-pathway combinations assessed per test compound in one example 70. In these types of experiments, fluorescent barcoding is performed after the assay endpoint, with barcoding dyes applied in the wells to fixed and permeabilized cells. In general, this approach trades the number of compounds tested with the number of parameters assessed.
Simpler multiplexing approaches that minimize requirements for cell numbers, reagents, sample volumes and time consuming assay preparation steps are preferred when working with larger compound libraries of tens- to hundreds-of-thousands of compounds (see “Balancing throughput and content” below). They can have a significant cost benefit impact irrespective of library size (for example, by minimizing amounts of compound consumed). Exemplifying such an approach was a screening project designed to discover small molecules targeting Target of Rapamycin (TOR) proteins71, 72, Ser/Thr protein kinases phylogenetically conserved from yeast to human, which are fundamental controllers of cell growth73–75. The impetus for this project was a need for new TOR inhibitors to improve upon the moderate clinical benefit of rapamycin in mTOR-based therapy of many cancers. Five GFP-tagged yeast clones representing the readouts of four branches of the TORC1 signaling pathway were first selected by screening the Yeast GFP Clone Collection (76, Life Technologies) for clones with high responsiveness to rapamycin. The 5 clones were barcoded with two dyes that had fluorescence emission spectra distinct from GFP. Importantly, barcoding was performed on separate bulk preparations of live cells which were then combined and distributed into wells of 384-well plates so that all 5 clones were present in each well during exposure to compounds for induction of GFP response and subsequent analysis (Fig. 2E). In a primary screen of ~320,000 compounds from the MLSMR, multiplexed analysis of the 5 clones allowed evaluation of compound activity on the four pathway branches simultaneously71, 72. This fostered rapid prioritization of molecules that functionally mimicked rapamycin as well as molecules selective for individual branches that could target effectors in the TORC1 pathway or interfere with other non-TOR, cross-talk signaling mechanisms. It is noteworthy that both the Phosflow and TOR pathway screening approaches illustrated above represent examples of mechanism informed phenotypic screening.
Numerous cell-based phenotypic screening projects have been performed in recent years, most using HyperCyt platform technology (Table 1). Reporters used in such assays have included endogenously expressed fluorescent proteins in bacteria 77, 78, yeast71, 72, 79, 80, and acute myeloid leukemia cells 81; fluorescent antibodies (homogeneous, no-wash format) to detect surface proteins in primary murine T cells 10, 82 and human cytotoxic T cell 29, 30, 83 and myeloid 81, 84 cell lines; and fluorescent substrates used to monitor activity of cell membrane efflux pump transporters in fungal cells 85 as well as human cell lines 86–88. A group at the National Center for Advancing Translational Sciences (NCATS) recently validated the HyperCyt platform for use in their dose-response-based method of screening, called quantitative high throughput screening (qHTS), using a multiplexed apoptosis assay with a human lymphoma cell line 89. Also, a new class of biosensor has been recently employed that enables flow cytometry for detection of receptor transit from cell surface to cell interior 90. This reporter system is comprised of a fluorogen-activating protein (FAP) and a small molecule (fluorogen) whose fluorescence increases dramatically when noncovalently bound by the FAP 91. Cells that expressed an external N-terminal FAP fused to the β2-adrenergic receptor (β2AR) were screened against ~350,000 compounds from the MLSMR to detect novel agonists 92. The assay used a membrane-impermeant fluorogen to detect loss of signal resulting from agonist-induced β2AR internalization. A group at Pfizer has recently implemented FAP technology for a GPCR project using integrated HyperCyt flow cytometry and imaging platforms 93. It is anticipated that this reporter system will be a useful tool for identifying ligands for orphan GPCRs.
Table 1.
Examples of cell-based phenotypic screening of small molecule libraries with flow cytometry
| Plate Well Format | Screening Model | Cells | Reporter | Platform | # Compounds Screened | References |
|---|---|---|---|---|---|---|
| 96 | Leukocyte signaling pathway inhibitors | Human myeloid cell line, primary mouse spleen cells | Fluorescent antibodies | BD HTS | 235 | 70 |
| 96 | Reactivators of latent HIV | Bcl-2-transduced primary human CD4 T cells | EGFP | BD HTS | 4,400 | 151 |
| 96 | Reactivators of latent HIV | Human T cell line | GFP | HyperCyt | not specified | 152 |
| 96 | Modulators of T cell antigen presenting cell interactions | Primary mouse CD8 T cells from spleen | Fluorescent antibodies | BD HTS | 2,000 | 10 |
| 384 | Quorum sensing pathway inhibitors | Bacteria (S. aureus) | GFP | HyperCyt | 24,000 | 77, 78 |
| 384 | Prostate cell differentiation activators | Human prostate cell line | Label-free side light scatter | HyperCyt | 25,000 | 153, 154 |
| 384 | ABC B1 G2 efflux pump inhibitors | Human cell lines expressing individual pumps | Fluorescent pump substrates | HyperCyt | 880 200,000 |
86 88 |
| 384 | ABC B6 efflux pump inhibitors | Human cell line expressing pump | Fluorescent pump substrate | HyperCyt | 350,000 | 87 |
| 384 | Anti-Fungal efflux pump inhibitors | Yeast cells expressing pumps from pathogenic strains | Fluorescent pump substrates | HyperCyt | 325,000 | 85 |
| 384 | TOR pathway regulators | Yeast (S. Cerivisiae) | GFP | HyperCyt | 320,000 | 71, 80 |
| 384 | VLA-4 integrin Allosteric Modulators | Human myeloid cell line | Fluorescent antibodies | HyperCyt | 350,000 | 84 |
| 384 | Modulators of T cell antigen presenting cell interactions | Primary mouse CD8 T cells from spleen | Fluorescent antibodies | HyperCyt | 325,000 | 82 |
| 384 | Regulators of V-ATPase proton transport | Yeast (S. Cerivisiae) | pH-sensitive GFP | HyperCyt | 350,000 | 79 |
| 384 | Myeloid differentiation promoters | Human acute myeloid leukemia cell line | GFP and fluorescent antibodies | HyperCyt | 350,000 | 81 |
| 384 | Non-canonical ligands inducing receptor internalization | Human fibroblast cell line | Fluorogen activating protein (FAP) plus fluorogen | HyperCyt | 350,000 | 92 |
| 384 | Caloric restriction mimetics inhibiting age-related superoxide | Yeast (S. Cerivisiae) | Fluorescent superoxide-sensitive reporter | HyperCyt | 325,000 | 155 |
| 384 | Lytic granule exocytosis inhibitors | Human cytotoxic T cell line | Fluorescent antibodies | HyperCyt | 1,200 | 83 |
| 1536 | Lytic granule exocytosis inhibitors | Human cytotoxic T cell line | Fluorescent antibodies | HyperCyt | 350,000 | 29, 30 |
Unique value added and impact on early drug discovery progress by high throughput flow cytometry
Almost all the examples of phenotypic screening listed above involved analysis of suspension adapted cells, predominantly mammalian leukocytes but also including a diversity of single cell organisms used as experimental models. Automated high content imaging (HCI) is an established, alternative single cell analysis technology common in many screening laboratories where it has been the workhorse technology for phenotypic screening for many years. HCI is a planar technology that is well suited for analysis of cells with adherent morphology but requires potentially assay compromising cell immobilization procedures to accommodate analysis of cells that do not naturally attach to surfaces. This has led to an apparent bias in the types of cells subject to HCI analysis, a trend highlighted in a recent compendium of research articles and reviews focused on phenotypic screening (December, 2013 and January, 2014 issues of Journal of Biomolecular Screening). In eighteen articles that featured HCI screening approaches 94–111, suspension adapted cells were notably absent. Surface adherent cells were the focus of sixteen of the articles. The other two described HCI analysis of multicellular zebrafish embryos96 and 3-D colony formation by carcinoma cells immobilized in soft agar101. Thus, high throughput flow cytometery complements HCI by offering a facile approach for early phase, single cell phenotypic screening of otherwise underrepresented cellular phenotypes. Other high throughput screening technologies that rely on bulk fluorescence measurements of cells in suspension are incapable of the high degree of multiplexing used in many of the flow cytometry screening applications referenced above. Such multiplexing can impact early drug discovery by enabling identification of lead candidates that simultaneously satisfy multiple important phenotypic criteria at the stage when the greatest number of candidates are being evaluated. Just as in target-based screening, this minimizes the risk that an inappropriately prioritized single criterion might lead to early rejection of promising candidates. The benefits of such multiplexing were highlighted above for target-based projects to identify antibodies with cross-species reactivity (Fig. 2C) and a phenotypic screening project to identify “rapalogs”, compounds that mimic Rapamycin with respect to their parallel impact on four different mTOR associated pathways (Fig. 2E). Thus, high throughput flow cytometry offers a capability for highly multiplexed, single cell analysis of suspension adapted cells, an important approach to cell-based screening that appears to be inadequately addressed by other screening technologies in current use for early phase drug discovery.
Multiplexing squared with combinatorial, mixture-based libraries
Phosflow flow cytometry, with the ability to characterize elements of multiple signaling pathways in parallel, represents a powerful and potentially lucrative approach for pathway focused phenotypic screening 70. As currently implemented the assay protocol requires multiple wash steps, a bottleneck for automation processes compatible with screening of sizable compound libraries. Other types of useful phenotypic screens may, for example, involve parallel analysis of complex collections of cell subsets. To obtain statistically meaningful numbers of cells from each subset, especially when one or more is low in frequency, the sample acquisition time may need to be significantly extended to enable analysis of an appropriately large number of cells. Assay formats such as these and others may be practically best suited for screening of smaller, focused libraries in the range of 10,000 compounds or less 70. An alternative approach would be to use mixture-based libraries in which cells are screened against a series of mixtures, each containing multiple compounds, rather than one compound at a time.
The utility of such an approach was recently demonstrated by a screening project 112 to identify small molecule ligands that selectively bound two members of the formylpeptide receptor family, FPR1 and FPR2, G-protein coupled receptors associated with host defense and inflammation 113. The screen used a target-based assay in cells in which compounds were assessed for the ability to displace a green fluorescent ligand from FPR1 or FPR2, each expressed on a separate set of red fluorescently barcoded cells. The compound collection was constructed at the Torrey Pines Institute for Molecular Studies (TPIMS) by synthetic, combinatorial methods 114, 115 and contained over five million small molecules representing 37 unique chemical scaffolds. These were arrayed as mixtures in 5,261 wells with 48 to 216,000 compounds in each mixture. Fig. 3 illustrates an example of one of the chemical scaffolds (Fig. 3A), the mixture-based library generated from it (Fig. 3B) and results of screening it for activity against FPR1 (Fig. 3C). A first round of screening that identified several active scaffolds was followed by three rounds of confirmatory screening to confirm and rank activity in several hundred wells representing two of the most active scaffolds. At that point, positional scanning deconvolution of the activity profile identified 106 candidate molecules from one scaffold library and 8 from the other. When purified and tested 15 and 12 of these 114 compounds had inhibitory constants (Ki) of <100nM for FPR1 and FPR2, respectively, all with >100-fold selectivity for the targeted receptor. This result, obtained by screening of fewer than 10,000 total wells, was a remarkable improvement over two previous projects using the same assay in which screening of ~5,000 small molecules from two focused libraries 54, 116 and of ~24,000 from a diversity library 117 yielded only 1 compound of similar potency and selectivity. Selective antagonists and agonists for both receptors were represented, two (an FPR1 agonist and FPR2 antagonist) with unprecedented potencies 112.
Figure 3.

Screening with combinatorial, mixture-based small molecule libraries. A. A chemical scaffold used in 1 of 37 combinatorial small molecule libraries from Torrey Pines Institute for Molecular Studies (TPIMS). R1, R2, R3 and R4 represent positions at which chemical functional groups are substituted. B. Schema for library construction. In the first well, the R1 position is substituted with 1 of a set of 26 functional groups. The R2 and R3 positions are randomly substituted with all 26 functionalities (equimolar representation) and the R4 group with all of a different set of 42 functionalities. In the next 25 wells, R1 is substituted with 1 of the 25 remaining functionalities in the first set, a different functionality for each well, while positions R2–R4 are randomly substituted as in the first well. In the next 26 wells (wells 27–52), the R2 position is substituted in the same way as was the R1 position in the first 26 wells, a different R2 substitution in each well with random substitutions at R1, R3 and R4. R3 and R4 positions are substituted in a similar defined fashion in the next 26 and 42 wells (wells 53–78 and 79–120), respectively. At the end, each of the first 72 wells contains an equimolar mixture of 26×26×42 = 28,392 compounds (Cpds) and in each of the last 42 is a mixture of 26×26×26 = 17,576 compounds. C. Inhibition of fluorescent ligand binding to formylpeptide receptor, FPR1, by each of the 120 mixtures in a high throughput flow cytometry screen. Each graph represents the positional scanning pattern of inhibition resulting from sequential substitutions at position R1 (top), R2 (second down), R3 (third down) and R4 (bottom). Dashed lines represent an inhibition threshold above which a mixture was considered to be active. Four substitutions at R1, 6 at R2, 3 at R3 and 2 at R4 resulted in activity. Potent FPR1 inhibitors would be expected in a set of 4×6×3×2 = 184 compounds representing all possible combinations of active substitutions. Unpublished data and reproduced with permission from C. Pinilla, et al., Mol. Pharm. 84:314, 2013. Copyright 2013, American Society for Pharmacology and Experimental Therapeutics.
Evolution of HyperCyt platform
HyperCyt sampling technology has been available as a commercial product since 2006. Early adopters of the platform were companies that had already targeted flow cytometry as a preferred approach for accomplishing goals such as SiRNA-based functional genomics screens of plasmacytoma cells, hybridoma screens for therapeutic antibodies, and screens of immune cells from primary tissues. Attractive to these companies was not only the faster sample processing speed but also the ability to process smaller sample volumes and to avoid loss of cells as dead volume in sample backflushing operations. For example, a group at GSK had for many years been using an automated system with conventional flow cytometry sampling for drug concentration profiling of target-based assays in 96-well plates, a task requiring an hour or more for each plate depending on the assay. Implementation of HyperCyt technology enabled screening of 10 μL samples of whole blood arrayed in a 96-well plate in less than 10 min 9. This would have been impractical if not impossible with the original system. More than 200 HyperCyt platforms are currently in laboratories worldwide, but only recently are they being placed with increasing frequency in mainstream screening labs. This is likely attributable to capabilities associated with evolution of the platform as wells as recent trends in strategies for drug discovery.
Hardware
Initially the platform was only available as an autosampler that could be used as a front end for a variety of commercial flow cytometers. While this was (and still is) an attractive approach for expanding capabilities of an existing flow cytometer, most flow cytometer manufacturers were reluctant to provide a non-proprietary automation interface to coordinate operation with external devices from other instrument vendors. System installation often required that holes be drilled in the flow cytometer casing or that built-in mechanical and electronic control systems be bypassed to enable a working physical interface. Such installation issues raised concerns about invalidating instrument warranties. Also, two computers were required to operate in parallel, one to run the flow cytometer and the other to run the autosampler, and the handshake between the two was sometimes awkward in its implementation. These concerns were first addressed by creation of the HTFC platform option with its dedicated flow cytometer and fully integrated operation of flow cytometer and autosampler. More popular has been the recently introduced, next-generation iQue Screener System, a fully integrated solution in which sampling and reader functions are combined in a single benchtop unit, controlled by a single operating system, and provided with an automation interface to facilitate integration into screening laboratory work flows. An advanced HD option enables the platform for analysis of assays in 1536 well format. As with the HTFC platform, it is a turnkey system that requires little user intervention or esoteric knowledge to operate.
Software
Early versions of software for analyzing flow cytometry data were adequate for basic needs of plate-based analysis, but lacked some of the more specialized features to which practitioners of flow cytometry had become accustomed. Users would feel compelled to export the data from each well to a separate file for analysis with their favorite third party analysis package, a procedure which defeated advantages of data organization, manipulation and storage efficiency associated with one-plate one-file methodology. The current ForeCyt control and analysis software represents a significant advance that provides most of the capabilities expected of modern flow cytometry analysis packages. It also enables a range of sophisticated multi-well data operations such as custom intra-plate data normalization capabilities and dose-response plots with curve-fit statistics. Particularly useful is a PlateView function that displays histograms, 2D plots or overlay plots for each well in a consolidated view of all plate wells or selected well groups. Together with heat map display functions that profile assay response data over multi-well regions and well scanning features for selectively viewing data in individual wells, there is remarkable built-in versatility to streamline hit detection as well as identify anomalous response distribution patterns (e.g., edge effects) that can skew screening data. Further bolstering the utility of flow cytometry HTS is software developed by third parties to accommodate analysis of plate-centric flow cytometry data files 118, 119.
Drug discovery trends
Two recent trends in drug discovery are also likely to have benefitted high throughput flow cytometry platforms. One is the ongoing shift in emphasis from target-centric screening to target-agnostic or mechanism-informed phenotypic screening approaches discussed above 61, 66–69. The other is the increasing interest and investment of major pharma companies in developing biologic drugs, especially novel antibodies 120. As discussed above, automated HCI has been the predominant workhorse technology for phenotypic screening for many years, but its use has been heavily biased towards analysis of cells with adherent morphology. With the advent of high throughput capabilities flow cytometry is achieving recognition as a complementary technology ideally adapted for high content phenotypic analysis of suspension adapted cells such as leukemias and lymphomas as well as leukocytes responsible for immune system regulation and inflammation associated disease processes. Also, in contrast to imaging-based systems, the amount of time required for flow cytometry data acquisition is largely insensitive to the number of optical parameters that are detected. The advantages of high throughput flow cytometry for multiplexed screening of antibody producing cells have been outlined above in the section on target-based screening. An alternative technology for this is Mirrorball, a laser scanning instrument that has been recently introduced to replace the aging FMAT (Fluorimetric Microvolume Assay Technology) platform, for many years an established platform for antibody screening with whole cells 59, 121. The Mirrorball platform can detect up to 5 colors of fluorescence simultaneously, along with a single light scatter parameter from beads but not from cells (http://ttplabtech.com/cell-imaging/mirrorball/). It is more versatile than FMAT for analysis of intact cells, but relies like HCI platforms on cells immobilized and displayed in a planar format at the bottom of wells. Thus, flow cytometry offers unique advantages for addressing both emerging drug discovery trends, on the one hand by enabling multiplexed, phenotype-driven primary screening of suspension cells and on the other by providing more efficient and versatile approaches for screening cellular sources of biological drugs such as antibodies.
Impact on drug discovery
Recent advances in flow cytometry are likely to impact drug discovery now and in coming years in several ways. One area of impact is the emerging appreciation of how sample sparing approaches such as HyperCyt may make high throughput screening of primary tissues more accessible. Advances in single cell throughput are also on the near horizon that promise to significantly reduce sample analysis times when massive numbers of cells must be scrutinized for access to rare cell subsets. The number and types of parameters that can be measured in parallel on single cells is also on the increase to bolster systems approaches to drug discovery.
Screening of Primary Cells
Primary cells have been widely used in screening laboratories, predominantly in throughput-limited secondary assessments such as concentration-response, metabolism and toxicity profiling of compounds 9, 122. The attraction of primary cells is the premise that they more closely resemble cells in vivo than immortalized cell lines with respect to endogenous protein levels and the physiology of signaling pathways and receptors. Also, because many types of primary cells exhibit minimal proliferation unless stimulated to do so, off-target effects of compounds on cell division are less likely than with cell lines to obfuscate screening results 122. Since most high throughput technologies require large numbers of cells, a major feature limiting primary cell use in high throughput compound screening is low abundance. Another confounding factor is the innate heterogeneity of primary cell cultures. This provides an element of uncertainty as to which subset of cells within a culture might be the basis of observed compound activity. The multiparameter analysis capabilities of flow cytometry are well suited for discriminating cell subsets in a sample to resolve differential targeting by compounds 55. Sample sparing characteristics of HyperCyt sampling technology allow efficient quantitative analysis of as few as hundreds to thousands of cells in a well with minimal loss to waste. Thus, high throughput flow cytometry may be of immediate use for intermediate to large scale primary cell screening applications using suspension cells from animal model systems as well as humans. Such considerations are the basis of a precision medicine concept currently in development at UNMCMD 24. Primary tissues from leukemia patients are to be screened for responsiveness in vitro to both old and new oncology drugs and their combinations. Single cell analysis capabilities of flow cytometry are ideal for assessing the degree to which heterogeneity of the original tumor is retained in such an in vitro therapy model and how different subpopulations of cancer cells are affected by the treatment regimen. This effort, an expansion upon an approach reported by a group in Finland 123, is expected to ultimately lead to an understanding of the basis of durable responses and translation to clinical therapy. A recently introduced alternative to using primary cells is a “disease-in-a-dish” approach in which a patient’s somatic cells can be reprogrammed into an embryonic pluripotent state by the forced expression of a defined set of transcription factors. The resulting induced pluripotent stem cells (IPSCs) recapitulate the disease phenotype and can be expanded for in vitro disease modelling and drug discovery 124, 125.
Increasing volumetric and single cell throughput to assess low frequency subpopulations
There is great interest in improving methods for screening of rare cells such as circulating tumor cells (CTC), cancer stem cells implicated in metastases and acquisition of resistance to therapy 126–129. Current procedures for detection and analysis of CTC, at estimated levels of 100 or fewer per milliliter of blood 130, involve capture or enrichment procedures that are lengthy and conducive to cell loss 131, 132. How much better it would be if all cells in a blood sample could be efficiently examined to detect and potentially isolate rare cells like CTC without such preliminary manipulations. A similar argument can be made for other rare cell populations such as fetal cells in maternal blood or endothelial progenitor cells. At current maximal analysis rates of modern flow cytometers it would require hours to analyze all cells in one milliliter of whole blood. A cluster of flow cytometers might be used in parallel to divide the workload and speed the process as has been previously done with four flow cytometers to enhance processing of 1536-well plates 25. However, the number of instruments required would greatly exceed anything remotely practical with respect to cost, space requirements and complexity of operation. An alternative approach has been to implement chip-based systems whereby tens to potentially as many as hundreds of tightly focused, parallel streams of cells can be generated in the presence of an appropriately modulated acoustic field 133, 134(Fig. 4A). Acoustic focusing techniques such as this can position biological cells and other particles over a wide range of sizes and support high volumetric flow rates for flow cytometry 135, 136. Creation of simple methods to analyze the multiple flow streams will be critical and are currently in early stages of development. With the potential to analyze millions of cells per second, such methods, in combination with high throughput sampling systems, promise to bring efficient screening of low frequency cells in heterogeneous cell populations closer to reality.
Figure 4.
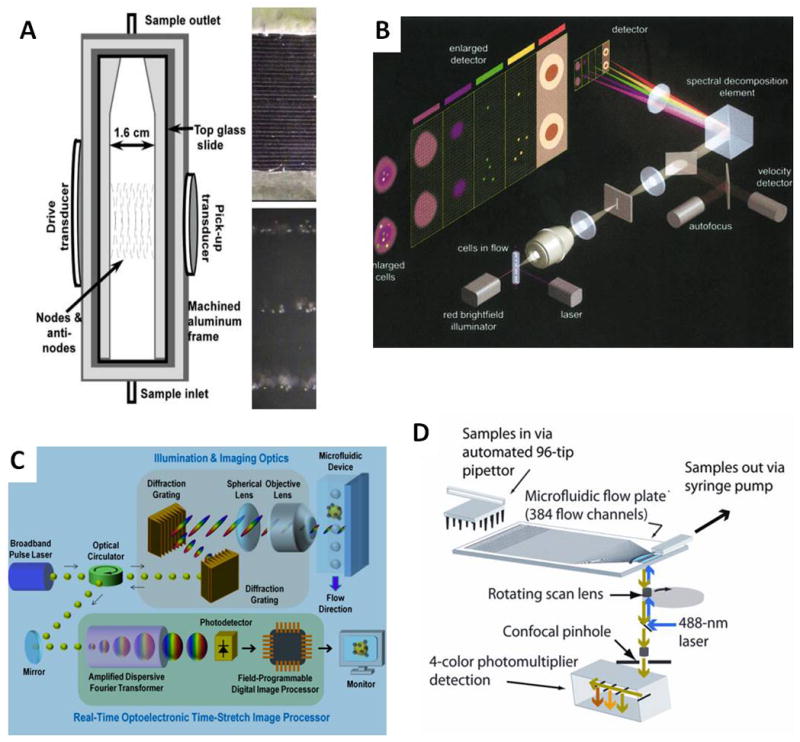
Technologies for rare cell detection and imaging in flow-based systems. A. Acoustic focusing system to generate multiple streams of cells from a single sample (left). Thirty-three parallel flowing streams of cell-sized particles (top right) and a zoomed image of 3 of the streams (bottom right). Reproduced with permission from M.E. Piyasena, et al., Anal. Chem. 84:1831, 2012. Copyright 2012, American Chemical Society. B. Flow based imaging with the ImageStream 100 Multispectral Imaging Cytometer. Reproduced with permission from T.C. George, et al., Cytometry 59A:237, 2004. Copyright 2004, John Wiley and Sons. C. The serial time-encoded amplified microscopy (STEAM) platform for blur-free imaging of particles in high speed flow. Reproduced with permission from K. Goda, et al., PNAS 109:11630, 2012. Copyright 2012, National Academy of Sciences USA. D. Scanning of 384 parallel microchannels to capture 6-pixel 1-D images of cells by the Parallel Microfluidic Cytometer (PMC). Reproduced with permission from B.K. McKenna, et al., Nature Methods 8:401, 2011. Copyright 2011. Nature Publishing Group.
Expanding the content of suspension cell and particle analysis
Flow-based imaging systems are commercially available that can record images of hydrodynamically focused cells in suspension at rates as high as 5,000 cells/second. Simultaneous image modes include brightfield (transmitted light), darkfield (side scatter), and four channels of fluorescence 137, 138. These systems offer the advantage of spatial resolution in addition to optical parameters available in conventional flow cytometers (Fig. 4B). Recently documented has been an even faster imaging flow cytometry platform capable of imaging rates as high as 100,000 cells/second 139. This platform uses an ultrafast optical imaging modality known as serial time-encoded amplified microscopy (STEAM) 140 for blur-free imaging of particles in high speed flow (Fig. 4C). It also uses hybrid optoelectronic image processing circuitry to enable fully automated real-time image-recording and classification of a large number of cells or particles through their morphological and biochemical features. A different flow-based imaging approach, embodied in an instrument called the Parallel Microfluidic Cytometer (PMC), uses a high-speed scanning photomultiplier-based detector to combine low-pixel-count 1-D imaging with flow cytometry 141 (Fig. 4D). A confocal scanner records fluorescence values of cells at 1 μm intervals as they cross the detection window and up to 384 separate streams of cells can be measured in parallel. At up several thousand cells per second, 6-pixel 1-D images captured by the PMC were adequate to quantify protein localization in a yeast model and nuclear translocation in Chinese hamster ovary cells 141. A wide range of microfluidics-based systems have been integrated with flow cytometry technology as recently reviewed in some detail 134.
New instrument and reporter technologies are also increasing the numbers of cell-associated parameters that can be measured in parallel. One approach uses surface enhanced Raman scattering (SERS) from metal nanoparticles to produce signal intensities that rival fluorescence, but with narrower spectral features that allow a greater degree of multiplexing 142. Raman resonant compounds are adsorbed on the nanoparticles to confer a unique spectral fingerprint on each SERS tag. Tags are then encapsulated in a polymer coating for conjugation to antibodies or other targeting molecules. SERS spectral measurements are made with a high resolution spectral flow cytometer that is also capable of making conventional flow cytometry measurements on thousands of individual cells per minute. The narrow spectral features of the SERS signal enable more distinct probes to be measured in a smaller region of the optical spectrum with a single laser and detector, allowing for higher levels of multiplexing and multiparameter analysis.
Another rapidly evolving high-content technology is mass cytometry, a mating of flow cytometry and mass spectrometry that, even its current state of infancy, is revolutionizing single cell profiling capabilities. Using stable isotopes of rare earth metals as reporters rather than fluorophores, mass cytometry is currently capable of multiplexing up to 40 cellular measurements. Importantly, it does so with little measurable background signal and negligible (~0.1%) signal spillover between measurement channels, eliminating the need for inter-channel signal compensation that can add significant complexity to highly multiplexed fluorescence measurements 143. Just as in fluorescence-based flow cytometry, cell barcoding can be performed to enable assessment of the signaling state of cells at one or more time points or pooling of cells from multiple wells to speed analysis of multiple samples. At present mass cytometry is limited to analyzing only dead (fixed) cells at analysis rates of ~1000 cells/second and only ~30% of the cells in a sample are analyzed due to sampling inefficiencies 143, 144. Nonetheless, recent profiling studies of hematopoietic cells 145, virus-specific T cells 146 and NK cells 147, each involving simultaneous measurements of up to 37 features, have led to unprecedented understanding of these cellular biological systems. Mass cytometry was developed by a group in Toronto in 2009 148 and the commercial product, called CyTOF for Cytometry by Time Of Flight (www.dvssciences.com), is likely to improve over time with respect to sensitivity, cell analysis rates, sampling efficiencies and even greater numbers of simultaneously measurable parameters. Its primary role in drug discovery is anticipated to be in deep profiling studies to elucidate compound mechanism of action and off-target effects. Complementing this can be the role of fluorescence-based flow cytometry in studies of living cells and targeted screening of compound libraries 144. Table 2 summarizes a number of the salient features of the CyTOF platform as compared to conventional and imaging flow cytometry platforms that are currently available from commercial sources.
Table 2.
Comparison commercially available types of flow-based cytometry platforms
| Feature | Conventional Flow Cytometry | Mass Cytometry (CyTOF) | Imaging Flow Cytometry |
|---|---|---|---|
| Number of Reporters Detected in Parallel | Up to 18 | Up to 40 | Up to 4 |
| Compensation for Signal Spillover Between Detection Channels | Increasing complexity and loss of sensitivity with increasing number of reporters | Negligible (<1% spillover) with little loss of sensitivity at maximum number of reporters | Increasing complexity and loss of sensitivity with increasing number of reporters |
| Signal Background | Autofluorescence background can be significant | Negligible background | Autofluorescence background can be significant |
| Analysis of Live Cells | Yes | No | Yes |
| Percent of Sampled Cells Successfully Analyzed | >95 | ~30 | >95 |
| Analysis Rates (cells/s) | Tens of thousands | Maximum ~1000 | Thousands |
| Maximum Sample Processing Rates (samples/h) | Thousands | <10 | Tens |
| Parameter For Distinguishing Cell Size, Granularity, Aggregation | Light scatter (forward, side) | No | Brightfield and darkfield images |
Improving high throughput flow cytometry
While some of the above technologies are unlikely to be applicable to high throughput flow cytometry platforms such as HyperCyt in the near future (e.g., mass cytometry), there are others that may be of more imminent promise for improvement. Key areas of most immediate potential impact on early phase drug discovery include 1) increased single cell and sample throughput, 2) expanded range of particle sizes amenable to analysis, 3) ability to analyze cells with unperturbed adherent morphology, and 4) addition of high throughput imaging capability. Many of these areas of improvement have been demonstrated or are in early proof-of-principle stages in conjunction with chip-based systems described above that are in current development 133, 134, 141. For example, acoustic focusing methods represent one approach by which multiple, tightly focused parallel streams of cells can be generated from one or more input sources (e.g., microplate wells) to dramatically increase throughput of cells, samples or both depending on platform configuration. Acoustic focusing methods are also applicable to particles of larger size than conventional hydrodynamic focusing methods. For example, multi-cell spheroids of 100 μm or more in diameter can be aligned in a focal plane for optical analysis without the danger of clogging encountered in conventional flow cytometers (unpublished results). The ability to analyze spheroids or cells attached to large diameter microspheres at hundreds to thousands per second would represent a novel capability for facile flow cytometry analysis of cells with unperturbed adherent morphology. Cells growing in a 3-D spheroid configuration would be of particular interest because of their better representation of in vivo cell physiology as compared to cells grown in monolayers149, 150. Systems by which to achieve simultaneous optical analysis of multiple parallel streams have been demonstrated (141 and manuscript in preparation). High speed camera technologies and imaging methods are available141 and rapidly advancing to allow ever improved ability to capture images of cells in parallel streams.
Balancing throughput and content
As discussed above, the opportunities for cytometric analysis range from high throughput to multi-parameter or high content analysis and/or rare event analysis. In general there is a trade-off in sampling rates and data complexity which can involve not only sample preparation or analysis times but also the costs per well. Although there is not a single answer to optimizing workflow in a discovery campaign, one should take into account the number of samples to be tested, the number of parameters to be evaluated and the number of events in the target population. Typically, a primary screen for a high throughput screening campaign would involve a cost-effective number of parameters with a large number of compounds (upwards of tens-of-thousands). While dose-response is possible at the primary screening phase (qHTS), the secondary screening campaigns for active compounds would allow increasingly detailed analysis. Here time and costs would dictate the preference for extremes of multi-parametric analysis as compared to rapidly executed sequential analyses of lesser complexity.
In concert with throughput considerations is a misperception that persists even among many flow cytometry practitioners that an excessively large number of cells need be evaluated by a flow cytometer to obtain statistically valid results (10,000 is the number most frequently espoused). In reality, the relationship between cell counting statistics and data quality are no different for flow cytometry than for any other single cell analysis technologies. High quality flow cytometry screening results have frequently been obtained with as few as one or two hundred cells analyzed per well, although higher numbers are preferred when practical. For high throughput screening, the flow cytometer typically samples only a fraction of the cells in a well, the objective being to achieve maximum processing speed by sampling the minimum volume required for evaluating a statistically adequate number of cells. With HyperCyt it is also possible to aspirate and analyze the entire volume contained in a well. In this way, a few hundreds of cells in a well could all be analyzed with a sampling time that is a function of total volume (i.e., cell concentration). Thus, trade-offs between sampling time and cell concentration apply in a similar way to flow cytometry as to other screening technologies such as HCI.
Conclusions
The advent of HyperCyt sampling technology has moved flow cytometry from a platform restricted to secondary, low throughput drug profiling applications to one suitable for primary screening applications in which tens of thousands of compounds are analyzed per day. The high multiplexing capabilities of flow cytometry make it possible to analyze multiple targets in parallel without appreciably impacting sample analysis time. Together, these capabilities facilitate high content compound profiling at the earliest screening stages, streamlining compound prioritization with respect to features such as target specificity and off-target effects. The ability to sample small volumes with negligible waste reduces reagent costs and compound usage, and makes quantity-limited sources of cells more accessible to testing against a broad array of compounds. Improved combinatorial approaches to formatting of compound libraries promise to further extend opportunities for flow cytometry-based primary screening when samples are scarce or when sample throughput is limited. Recent advances in flow-based imaging and mass spectrometry have dramatically expanded the numbers and types of measurements that can be made simultaneously on single cells. Such technological innovations offer opportunities for pathway-based compound profiling applications of unprecedented depth and complexity to help usher in systems level approaches to drug discovery. Novel microfluidics-based approaches for parallel sample processing and analysis promise to boost single cell analysis rates by orders of magnitude. A resulting improved ability to efficiently detect and characterize low frequency cells such as CTC in heterogeneous cell mixtures will likely be of most immediate utility for drug efficacy evaluation in animal models and clinical trials as well as precision medicine applications. Flow cytometry will inevitably continue to play an important role in drug discovery. Although recent trends are promising, it remains to be seen how successfully new high throughput flow cytometry platforms will contend with established and emerging instrument technologies for space on the high throughput screening lab bench.
References
- 1.Chattopadhyay PK, Hogerkorp CM, Roederer M. A chromatic explosion: the development and future of multiparameter flow cytometry. Immunology. 2008;125:441–9. doi: 10.1111/j.1365-2567.2008.02989.x. [DOI] [PMC free article] [PubMed] [Google Scholar]
- 2.Macey M. Flow Cytometry: Principles and Applications. Humana Press; Totowa, NJ: 2007. [Google Scholar]
- 3.Shapiro HM. Practical Flow Cytometry. John Wiley & Sons, Inc; Hoboken, NJ: 2003. [Google Scholar]
- 4.Chase ES, Hoffman RA. Resolution of dimly fluorescent particles: a practical measure of fluorescence sensitivity. Cytometry. 1998;33:267–79. [PubMed] [Google Scholar]
- 5.Picot J, Guerin CL, Le Van Kim C, et al. Flow cytometry: retrospective, fundamentals and recent instrumentation. Cytotechnology. 2012;64:109–30. doi: 10.1007/s10616-011-9415-0. [DOI] [PMC free article] [PubMed] [Google Scholar]
- 6.Sklar LA, Finney DA. Analysis of ligand-receptor interactions with the fluorescence activated cell sorter. Cytometry. 1982;3:161–5. doi: 10.1002/cyto.990030304. [DOI] [PubMed] [Google Scholar]
- 7.Murphy RF. Ligand Binding, Endocytosis, and Processing. In: Melamed MR, et al., editors. Flow Cytometry and Sorting. 2. Wiley-Liss, Inc; New York, NY: 1990. pp. 355–366. [Google Scholar]
- 8.Sklar LA, Edwards BS, Graves SW, et al. Flow cytometric analysis of ligand-receptor interactions and molecular assemblies. Annu Rev Biophys Biomol Struct. 2002;31:97–119. doi: 10.1146/annurev.biophys.31.082901.134406. [DOI] [PubMed] [Google Scholar]
- 9.Jepras R, Ludbrook S. Evolution of flow cytometry as a drug screening platform. Drug Discovery World. 2013 Spring;:43–50. [Google Scholar]
- 10.Kim K, Wang L, Hwang I. A novel flow cytometric high throughput assay for a systematic study on molecular mechanisms underlying T cell receptor-mediated integrin activation. PLoS One. 2009;4:e6044. doi: 10.1371/journal.pone.0006044. [DOI] [PMC free article] [PubMed] [Google Scholar]
- 11.Durack G, Lawler G, Kelley S, et al. Time interval gating for analysis of cell function using flow cytometry. Cytometry. 1991;12:701–6. doi: 10.1002/cyto.990120803. [DOI] [PubMed] [Google Scholar]
- 12.Robinson JP, Durack G, Kelley S. An innovation in flow cytometry data collection and analysis producing a correlated multiple sample analysis in a single file. Cytometry. 1991;12:82–90. doi: 10.1002/cyto.990120112. [DOI] [PubMed] [Google Scholar]
- 13.Edwards BS, Kuckuck F, Sklar LA. Plug flow cytometry: An automated coupling device for rapid sequential flow cytometric sample analysis. Cytometry. 1999;37:156–9. [PubMed] [Google Scholar]
- 14.Edwards BS, Kuckuck FW, Prossnitz ER, et al. Plug flow cytometry extends analytical capabilities in cell adhesion and receptor pharmacology. Cytometry. 2001;43:211–6. doi: 10.1002/1097-0320(20010301)43:3<211::aid-cyto1052>3.0.co;2-3. [DOI] [PubMed] [Google Scholar]
- 15.Edwards BS, Kuckuck FW, Prossnitz ER, et al. HTPS flow cytometry: a novel platform for automated high throughput drug discovery and characterization. J Biomol Screen. 2001;6:83–90. doi: 10.1177/108705710100600204. [DOI] [PubMed] [Google Scholar]
- 16.Kuckuck FW, Edwards BS, Sklar LA. High throughput flow cytometry. Cytometry. 2001;44:83–90. [PubMed] [Google Scholar]
- 17.Edwards BS, Oprea T, Prossnitz ER, et al. Flow cytometry for high-throughput, high-content screening. Curr Opin Chem Biol. 2004;8:392–8. doi: 10.1016/j.cbpa.2004.06.007. [DOI] [PubMed] [Google Scholar]
- 18.Ramirez S, Aiken CT, Andrzejewski B, et al. High-throughput flow cytometry: validation in microvolume bioassays. Cytometry A. 2003;53:55–65. doi: 10.1002/cyto.a.10035. [DOI] [PubMed] [Google Scholar]
- 19.Bartsch JW, Tran HD, Waller A, et al. An investigation of liquid carryover and sample residual for a high-throughput flow cytometer sample delivery system. Anal Chem. 2004;76:3810–7. doi: 10.1021/ac049870f. [DOI] [PubMed] [Google Scholar]
- 20.Jackson WC, Bennett TA, Edwards BS, et al. Performance of in-line microfluidic mixers in laminar flow for high-throughput flow cytometry. Biotechniques. 2002;33:220–6. doi: 10.2144/02331dd06. [DOI] [PubMed] [Google Scholar]
- 21.Jackson WC, Kuckuck F, Edwards BS, et al. Mixing small volumes for continuous high-throughput flow cytometry: performance of a mixing Y and peristaltic sample delivery. Cytometry. 2002;47:183–91. doi: 10.1002/cyto.10067. [DOI] [PubMed] [Google Scholar]
- 22.Young SM, Curry MS, Ransom JT, et al. High-throughput microfluidic mixing and multiparametric cell sorting for bioactive compound screening. J Biomol Screen. 2004;9:103–11. doi: 10.1177/1087057103262335. [DOI] [PubMed] [Google Scholar]
- 23.Edwards BS, Young SM, Oprea TI, et al. Biomolecular screening of formylpeptide receptor ligands with a sensitive, quantitative, high-throughput flow cytometry platform. Nat Protoc. 2006;1:59–66. doi: 10.1038/nprot.2006.9. [DOI] [PubMed] [Google Scholar]
- 24.Edwards BS, Gouveia K, Oprea TI, et al. The University of New Mexico Center for Molecular Discovery. Comb Chem High Throughput Screen. 2014 doi: 10.2174/1386207317666140109123908. [DOI] [PMC free article] [PubMed] [Google Scholar]
- 25.Edwards BS, Zhu J, Chen J, et al. Cluster cytometry for high-capacity bioanalysis. Cytometry A. 2012;81:419–29. doi: 10.1002/cyto.a.22039. [DOI] [PMC free article] [PubMed] [Google Scholar]
- 26.Graves SW, Sklar LA. High-throughput multiplex microsphere screening for inhibitors of toxin protease, specifically Botulinum neurotoxin light chain F protease. PubChem Bioassay Screening Summary. 2011 http://pubchem.ncbi.nlm.nih.gov/assay/assay.cgi?aid=588470.
- 27.Graves SW, Sklar LA. High-throughput multiplex microsphere screening for inhibitors of toxin protease, specifically Botulinum neurotoxin light chain A protease. PubChem Bioassay Screening Summary. 2011 http://pubchem.ncbi.nlm.nih.gov/assay/assay.cgi?aid=588467.
- 28.Graves SW, Sklar LA. High-throughput multiplex microsphere screening for inhibitors of toxin protease, specifically Lethal Factor Protease. PubChem Bioassay Screening Summary. 2011 http://pubchem.ncbi.nlm.nih.gov/assay/assay.cgi?aid=588469.
- 29.Zhao Z, Haynes MK, Ursu O, et al. A High-Throughput Phenotypic Screen of Cytotoxic T Lymphocyte Lytic Granule Exocytosis Reveals Candidate Immunosuppressants. J Biomol Screen. 2014 doi: 10.1177/1087057114557620. [DOI] [PMC free article] [PubMed] [Google Scholar]
- 30.Zweifach A, Sklar LA. HTS Screening Project for Inhibitors of Lytic Granule Exocytosis. PubChem Bioassay Screening Summary. 2012 http://pubchem.ncbi.nlm.nih.gov/assay/assay.cgi?aid=651682.
- 31.Joslin J, Ainscow E, Anderson P, et al. SLAS2014. Society for Laboratory Automation and Screening. San Diego: 2014. Development of a Fully Automated Ultra-High-Throughput Flow Cytometry Screening System to Enable Novel Drug Discovery; p. 70. [Google Scholar]
- 32.Braeckmans K, De Smedt SC, Leblans M, et al. Encoding microcarriers: present and future technologies. Nat Rev Drug Discov. 2002;1:447–56. doi: 10.1038/nrd817. [DOI] [PubMed] [Google Scholar]
- 33.Wandinger-Ness A, Sklar LA. Project utilizing multiplex HTS to identify specific small molecule inhibitors of Ras and Ras-related GTPases. PubChem Bioassay Screening Summary. 2009 http://pubchem.ncbi.nlm.nih.gov/assay/assay.cgi?aid=1772.
- 34.Hong L, Simons P, Waller A, et al. A small molecule pan-inhibitor of Ras-superfamily GTPases with high efficacy towards Rab7. Probe Reports From The NIH Molecular Libraries Program. 2010 [PubMed] [Google Scholar]
- 35.Surviladze Z, Waller A, Wu Y, et al. Identification of a small GTPase inhibitor using a high-throughput flow cytometry bead-based multiplex assay. J Biomol Screen. 2010;15:10–20. doi: 10.1177/1087057109352240. [DOI] [PMC free article] [PubMed] [Google Scholar]
- 36.Surviladze Z, Young SM, Sklar LA. High-throughput flow cytometry bead-based multiplex assay for identification of Rho GTPase inhibitors. Methods Mol Biol. 2012;827:253–70. doi: 10.1007/978-1-61779-442-1_17. [DOI] [PMC free article] [PubMed] [Google Scholar]
- 37.Surviladze Z, Waller A, Strouse JJ, et al. A Potent and Selective Inhibitor of Cdc42 GTPase. Probe Reports From The NIH Molecular Libraries Program. 2010 [PubMed] [Google Scholar]
- 38.Hong L, Kenney SR, Phillips GK, et al. Characterization of a Cdc42 protein inhibitor and its use as a molecular probe. J Biol Chem. 2013;288:8531–43. doi: 10.1074/jbc.M112.435941. [DOI] [PMC free article] [PubMed] [Google Scholar]
- 39.Surviladze Z, Ursu O, Miscioscia F, et al. Three small molecule pan activator families of Ras-related GTPases. Probe Reports From The NIH Molecular Libraries Program. 2010 [PubMed] [Google Scholar]
- 40.Roman DL, Ota S, Neubig RR. Polyplexed flow cytometry protein interaction assay: a novel high-throughput screening paradigm for RGS protein inhibitors. J Biomol Screen. 2009;14:610–9. doi: 10.1177/1087057109336590. [DOI] [PMC free article] [PubMed] [Google Scholar]
- 41.Neubig RR, Sklar LA. Multiplexed high-throughput screen for small molecule regulators of RGS family protein interactions. PubChem Bioassay Screening Summary. 2009 http://pubchem.ncbi.nlm.nih.gov/assay/assay.cgi?aid=1504.
- 42.Blazer LL, Roman DL, Muxlow MR, et al. Use of flow cytometric methods to quantify protein-protein interactions. Curr Protoc Cytom. 2010;Chapter 13(Unit 13 11):1–15. doi: 10.1002/0471142956.cy1311s51. [DOI] [PMC free article] [PubMed] [Google Scholar]
- 43.Sklar LA. Multiplexed high-throughput screen for small molecule regulators of Bcl-2 family protein interactions via Bim (BCL2-like 11) PubChem Bioassay Screening Summary. 2009 http://pubchem.ncbi.nlm.nih.gov/assay/assay.cgi?aid=1693.
- 44.Zou J, Ardecky R, Pinkerton AB, et al. Selective Bcl-2 Inhibitor Probes. Probe Reports From The NIH Molecular Libraries Program. 2010 http://www.ncbi.nlm.nih.gov/pubmed/23658956.
- 45.Curpan RF, Simons PC, Zhai D, et al. High-throughput screen for the chemical inhibitors of antiapoptotic bcl-2 family proteins by multiplex flow cytometry. Assay Drug Dev Technol. 2011;9:465–74. doi: 10.1089/adt.2010.0363. [DOI] [PMC free article] [PubMed] [Google Scholar]
- 46.Simons PC, Young SM, Carter MB, et al. Simultaneous in vitro molecular screening of protein-peptide interactions by flow cytometry, using six Bcl-2 family proteins as examples. Nat Protoc. 2011;6:943–52. doi: 10.1038/nprot.2011.339. [DOI] [PMC free article] [PubMed] [Google Scholar]
- 47.Tessmer J. RNA aptamer-based HTS for inhibitors of GRK2. PubChem Bioassay Screening Summary. 2010 http://pubchem.ncbi.nlm.nih.gov/assay/assay.cgi?aid=488855.
- 48.Nakamura K, Sklar LA. Multiplex HTS Assay for modulators of MEK Kinase PB1 Domain interactions via MEK5. PubChem Bioassay Screening Summary. 2009 http://pubchem.ncbi.nlm.nih.gov/assay/assay.cgi?aid=1683.
- 49.Stanley JR, Sklar LA, Aube J. HTS to find inhibitors of pathogenic pemphigus antibodies. PubChem Bioassay Screening Summary. 2011 http://pubchem.ncbi.nlm.nih.gov/assay/assay.cgi?aid=588367.
- 50.Skowyra D, Sklar LA. Disassembly of the 26S proteasome (ATP hydrolysis-dependent) PubChem Bioassay Screening Summary. 2009 http://pubchem.ncbi.nlm.nih.gov/assay/assay.cgi?aid=1824.
- 51.Saunders MJ, Edwards BS, Zhu J, et al. Microsphere-based flow cytometry protease assays for use in protease activity detection and high-throughput screening. Curr Protoc Cytom. 2010;Chapter 13(Unit 13 12):1–17. doi: 10.1002/0471142956.cy1312s54. [DOI] [PMC free article] [PubMed] [Google Scholar]
- 52.Saunders MJ, Graves SW, Sklar LA, et al. High-throughput multiplex flow cytometry screening for botulinum neurotoxin type a light chain protease inhibitors. Assay Drug Dev Technol. 2010;8:37–46. doi: 10.1089/adt.2009.0219. [DOI] [PMC free article] [PubMed] [Google Scholar]
- 53.Saunders MJ, Kim H, Woods TA, et al. Microsphere-based protease assays and screening application for lethal factor and factor Xa. Cytometry A. 2006;69:342–52. doi: 10.1002/cyto.a.20268. [DOI] [PubMed] [Google Scholar]
- 54.Young SM, Bologa C, Prossnitz ER, et al. High-throughput screening with HyperCyt flow cytometry to detect small molecule formylpeptide receptor ligands. J Biomol Screen. 2005;10:374–82. doi: 10.1177/1087057105274532. [DOI] [PubMed] [Google Scholar]
- 55.Krutzik PO, Nolan GP. Fluorescent cell barcoding in flow cytometry allows high-throughput drug screening and signaling profiling. Nat Methods. 2006;3:361–8. doi: 10.1038/nmeth872. [DOI] [PubMed] [Google Scholar]
- 56.Krutzik PO, Nolan GP. Intracellular phospho-protein staining techniques for flow cytometry: monitoring single cell signaling events. Cytometry A. 2003;55:61–70. doi: 10.1002/cyto.a.10072. [DOI] [PubMed] [Google Scholar]
- 57.Bradford JA, Buller G, Suter M, et al. Fluorescence-intensity multiplexing: simultaneous seven-marker, two-color immunophenotyping using flow cytometry. Cytometry A. 2004;61:142–52. doi: 10.1002/cyto.a.20037. [DOI] [PubMed] [Google Scholar]
- 58.Smurthwaite CA, Hilton BJ, O’Hanlon R, et al. Fluorescent genetic barcoding in mammalian cells for enhanced multiplexing capabilities in flow cytometry. Cytometry A. 2014;85:105–13. doi: 10.1002/cyto.a.22406. [DOI] [PubMed] [Google Scholar]
- 59.Cariuk P, Gardener MJ, Vaughan TJ. Evolution of biologics screening technologies. Pharmaceuticals (Basel) 2013;6:681–8. doi: 10.3390/ph6050681. [DOI] [PMC free article] [PubMed] [Google Scholar]
- 60.Watson SR, Kuan HF, Tran C. A simple trick to get more data from initial flow cytometric binding assays when screening for therapeutic antibodies. High Capacity Flow Cytometry Workshop, CYTO2012 Conference; Leipzig. 2012. [Google Scholar]
- 61.Feng Y, Mitchison TJ, Bender A, et al. Multi-parameter phenotypic profiling: using cellular effects to characterize small-molecule compounds. Nat Rev Drug Discov. 2009;8:567–78. doi: 10.1038/nrd2876. [DOI] [PubMed] [Google Scholar]
- 62.Paul SM, Mytelka DS, Dunwiddie CT, et al. How to improve R&D productivity: the pharmaceutical industry’s grand challenge. Nat Rev Drug Discov. 2010;9:203–14. doi: 10.1038/nrd3078. [DOI] [PubMed] [Google Scholar]
- 63.Lee JA, Berg EL. Neoclassic drug discovery: the case for lead generation using phenotypic and functional approaches. J Biomol Screen. 2013;18:1143–55. doi: 10.1177/1087057113506118. [DOI] [PubMed] [Google Scholar]
- 64.Begley CG, Ellis LM. Drug development: Raise standards for preclinical cancer research. Nature. 2012;483:531–3. doi: 10.1038/483531a. [DOI] [PubMed] [Google Scholar]
- 65.Prinz F, Schlange T, Asadullah K. Believe it or not: how much can we rely on published data on potential drug targets? Nat Rev Drug Discov. 2011;10:712. doi: 10.1038/nrd3439-c1. [DOI] [PubMed] [Google Scholar]
- 66.Swinney DC. The contribution of mechanistic understanding to phenotypic screening for first-in-class medicines. J Biomol Screen. 2013;18:1186–92. doi: 10.1177/1087057113501199. [DOI] [PubMed] [Google Scholar]
- 67.Swinney DC, Anthony J. How were new medicines discovered? Nat Rev Drug Discov. 2011;10:507–19. doi: 10.1038/nrd3480. [DOI] [PubMed] [Google Scholar]
- 68.Eder J, Sedrani R, Wiesmann C. The discovery of first-in-class drugs: origins and evolution. Nat Rev Drug Discov. 2014;13:577–87. doi: 10.1038/nrd4336. [DOI] [PubMed] [Google Scholar]
- 69.Moffat JG, Rudolph J, Bailey D. Phenotypic screening in cancer drug discovery - past, present and future. Nat Rev Drug Discov. 2014;13:588–602. doi: 10.1038/nrd4366. [DOI] [PubMed] [Google Scholar]
- 70.Krutzik PO, Crane JM, Clutter MR, et al. High-content single-cell drug screening with phosphospecific flow cytometry. Nat Chem Biol. 2008;4:132–42. doi: 10.1038/nchembio.2007.59. [DOI] [PubMed] [Google Scholar]
- 71.Chen J, Young SM, Allen C, et al. Identification of a Small Molecule Yeast TORC1 Inhibitor with a Multiplex Screen Based on Flow Cytometry. ACS Chem Biol. 2012;7:715–22. doi: 10.1021/cb200452r. [DOI] [PMC free article] [PubMed] [Google Scholar]
- 72.Chen J, Young SM, Allen C, et al. Profiling a Selective Probe for RTG Branch of Yeast TORC1 Signaling Pathway. Probe Reports from the NIH Molecular Libraries Program. 2010 [PubMed] [Google Scholar]
- 73.De Virgilio C, Loewith R. Cell growth control: little eukaryotes make big contributions. Oncogene. 2006;25:6392–415. doi: 10.1038/sj.onc.1209884. [DOI] [PubMed] [Google Scholar]
- 74.De Virgilio C, Loewith R. The TOR signalling network from yeast to man. Int J Biochem Cell Biol. 2006;38:1476–81. doi: 10.1016/j.biocel.2006.02.013. [DOI] [PubMed] [Google Scholar]
- 75.Zoncu R, Efeyan A, Sabatini DM. mTOR: from growth signal integration to cancer, diabetes and ageing. Nat Rev Mol Cell Biol. 2011;12:21–35. doi: 10.1038/nrm3025. [DOI] [PMC free article] [PubMed] [Google Scholar]
- 76.Huh WK, Falvo JV, Gerke LC, et al. Global analysis of protein localization in budding yeast. Nature. 2003;425:686–91. doi: 10.1038/nature02026. [DOI] [PubMed] [Google Scholar]
- 77.Gresham HD, Sklar LA. Inhibitors of bacterial quorum sensing. PubChem Bioassay Screening Summary. 2008 http://pubchem.ncbi.nlm.nih.gov/assay/assay.cgi?aid=1206.
- 78.Sully EK, Malachowa N, Elmore BO, et al. Selective Chemical Inhibition of agr Quorum Sensing in Staphylococcus aureus Promotes Host Defense with Minimal Impact on Resistance. PLoS Pathog. 2014;10:e1004174. doi: 10.1371/journal.ppat.1004174. [DOI] [PMC free article] [PubMed] [Google Scholar]
- 79.Parra K, Sklar LA, Lindsley CW. Flow cytometry HTS of small molecules that regulate V-ATPase proton transport in yeast. PubChem Bioassay Screening Summary. 2011 http://pubchem.ncbi.nlm.nih.gov/assay/assay.cgi?aid=504622.
- 80.Werner-Washburne M, Sklar LA. Multiplex HTS screen of TOR pathway GFP-fusion proteins in Saccharomyces Cerevisiae. PubChem Bioassay Screening Summary. 2009 http://pubchem.ncbi.nlm.nih.gov/assay/assay.cgi?aid=1908.
- 81.Sykes D, Sklar LA, Schreiber S. HTS to identify compounds that promote myeloid differentiation. PubChem Bioassay Screening Summary. 2011 http://pubchem.ncbi.nlm.nih.gov/assay/assay.cgi?aid=588701.
- 82.Hwang I, Sklar LA. Screening for developing T cell immune modulators. PubChem Bioassay Screening Summary. 2009 http://pubchem.ncbi.nlm.nih.gov/assay/assay.cgi?aid=2087.
- 83.Florian AE, Lepensky CK, Kwon O, et al. Flow cytometry enables a high-throughput homogeneous fluorescent antibody-binding assay for cytotoxic T cell lytic granule exocytosis. J Biomol Screen. 2013;18:420–9. doi: 10.1177/1087057112466697. [DOI] [PMC free article] [PubMed] [Google Scholar]
- 84.Chigaev A, Sklar LA. HTS for identification of VLA-4 allosteric modulators. PubChem Bioassay Screening Summary. 2010 http://pubchem.ncbi.nlm.nih.gov/assay/assay.cgi?aid=2617.
- 85.Cannon R, Sklar LA, Lindsley C. Phenotypic HTS multiplex for anti-fungal efflux pump inhibitors. PubChem Bioassay Screening Summary. 2010 http://pubchem.ncbi.nlm.nih.gov/assay/assay.cgi?aid=485335.
- 86.Ivnitski-Steele I, Larson RS, Lovato DM, et al. High-throughput flow cytometry to detect selective inhibitors of ABCB1, ABCC1, and ABCG2 transporters. Assay Drug Dev Technol. 2008;6:263–76. doi: 10.1089/adt.2007.107. [DOI] [PubMed] [Google Scholar]
- 87.Krishnamurthy P, Sklar LA, Aube J. HTS screen for inhibitors of the ABC transporter ACCC6. PubChem Bioassay Screening Summary. 2011 http://pubchem.ncbi.nlm.nih.gov/assay/assay.cgi?aid=588561.
- 88.Larson RS, Sklar LA. High throughput multiplex screening for ABC transporters. PubChem Bioassay Screening Summary. 2009 http://pubchem.ncbi.nlm.nih.gov/assay/assay.cgi?aid=1818.
- 89.Mathews LA, Keller JM, McKnight C, et al. Multiplexing high-content flow (HCF) and quantitative high-throughput screening (qHTS) to identify compounds capable of decreasing cell viability, activating caspase 3/7, expressing annexin V, and changing mitochondrial membrane integrity. Curr Protoc Chem Biol. 2013;5:195–212. doi: 10.1002/9780470559277.ch130060. [DOI] [PubMed] [Google Scholar]
- 90.Holleran J, Brown D, Fuhrman MH, et al. Fluorogen-activating proteins as biosensors of cell-surface proteins in living cells. Cytometry A. 2010;77:776–82. doi: 10.1002/cyto.a.20925. [DOI] [PMC free article] [PubMed] [Google Scholar]
- 91.Szent-Gyorgyi C, Schmidt BF, Creeger Y, et al. Fluorogen-activating single-chain antibodies for imaging cell surface proteins. Nat Biotechnol. 2008;26:235–40. doi: 10.1038/nbt1368. [DOI] [PubMed] [Google Scholar]
- 92.Jarvik JW, Sklar LA, Lindsley C. HTS for non-canonical ligands for beta-2 adrenergic receptor internalization. PubChem Bioassay Screening Summary. 2011 http://pubchem.ncbi.nlm.nih.gov/assay/assay.cgi?aid=504448.
- 93.Gebhard D, Hallowell S, Benvenuti E, et al. Development of FAP technology: fluorogen activated protein in high throughput flow cytometry. CYTO2013 Conference; San Diego, CA. 2013. p. 242. [Google Scholar]
- 94.Carlson C, Koonce C, Aoyama N, et al. Phenotypic screening with human iPS cell-derived cardiomyocytes: HTS-compatible assays for interrogating cardiac hypertrophy. J Biomol Screen. 2013;18:1203–11. doi: 10.1177/1087057113500812. [DOI] [PubMed] [Google Scholar]
- 95.Li H, Xie W, Gore ER, et al. Development of phenotypic screening assays for gamma-globin induction using primary human bone marrow day 7 erythroid progenitor cells. J Biomol Screen. 2013;18:1212–22. doi: 10.1177/1087057113499776. [DOI] [PubMed] [Google Scholar]
- 96.Sanker S, Cirio MC, Vollmer LL, et al. Development of high-content assays for kidney progenitor cell expansion in transgenic zebrafish. J Biomol Screen. 2013;18:1193–202. doi: 10.1177/1087057113495296. [DOI] [PMC free article] [PubMed] [Google Scholar]
- 97.Azegrouz H, Karemore G, Torres A, et al. Cell-based fuzzy metrics enhance high-content screening (HCS) assay robustness. J Biomol Screen. 2013;18:1270–83. doi: 10.1177/1087057113501554. [DOI] [PubMed] [Google Scholar]
- 98.Isherwood BJ, Walls RE, Roberts ME, et al. High-content analysis to leverage a robust phenotypic profiling approach to vascular modulation. J Biomol Screen. 2013;18:1246–59. doi: 10.1177/1087057113499775. [DOI] [PubMed] [Google Scholar]
- 99.Wolfe A, O’Clair B, Groppi VE, et al. Pharmacologic characterization of a kinetic in vitro human co-culture angiogenesis model using clinically relevant compounds. J Biomol Screen. 2013;18:1234–45. doi: 10.1177/1087057113502085. [DOI] [PubMed] [Google Scholar]
- 100.Honarnejad K, Kirsch AK, Daschner A, et al. FRET-based calcium imaging: a tool for high-throughput/content phenotypic drug screening in Alzheimer disease. J Biomol Screen. 2013;18:1309–20. doi: 10.1177/1087057113502672. [DOI] [PubMed] [Google Scholar]
- 101.Horman SR, To J, Orth AP. An HTS-compatible 3D colony formation assay to identify tumor-specific chemotherapeutics. J Biomol Screen. 2013;18:1298–308. doi: 10.1177/1087057113499405. [DOI] [PubMed] [Google Scholar]
- 102.Reisen F, Zhang X, Gabriel D, et al. Benchmarking of multivariate similarity measures for high-content screening fingerprints in phenotypic drug discovery. J Biomol Screen. 2013;18:1284–97. doi: 10.1177/1087057113501390. [DOI] [PubMed] [Google Scholar]
- 103.Boyd JD, Lee-Armandt JP, Feiler MS, et al. A high-content screen identifies novel compounds that inhibit stress-induced TDP-43 cellular aggregation and associated cytotoxicity. J Biomol Screen. 2014;19:44–56. doi: 10.1177/1087057113501553. [DOI] [PMC free article] [PubMed] [Google Scholar]
- 104.Cautain B, de Pedro N, Murillo Garzon V, et al. High-content screening of natural products reveals novel nuclear export inhibitors. J Biomol Screen. 2014;19:57–65. doi: 10.1177/1087057113501389. [DOI] [PubMed] [Google Scholar]
- 105.Ljosa V, Caie PD, Ter Horst R, et al. Comparison of methods for image-based profiling of cellular morphological responses to small-molecule treatment. J Biomol Screen. 2013;18:1321–9. doi: 10.1177/1087057113503553. [DOI] [PMC free article] [PubMed] [Google Scholar]
- 106.Shahane SA, Huang R, Gerhold D, et al. Detection of phospholipidosis induction: a cell-based assay in high-throughput and high-content format. J Biomol Screen. 2014;19:66–76. doi: 10.1177/1087057113502851. [DOI] [PMC free article] [PubMed] [Google Scholar]
- 107.Smith EB, Ogert RA, Pechter D, et al. HIV cell fusion assay: phenotypic screening tool for the identification of HIV entry inhibitors via CXCR4. J Biomol Screen. 2014;19:108–18. doi: 10.1177/1087057113500074. [DOI] [PubMed] [Google Scholar]
- 108.Sugarman E, Koo A, Suyama E, et al. Identification of Inhibitors of triacylglyceride accumulation in muscle cells: comparing HTS results from 1536-well plate-based and high-content platforms. J Biomol Screen. 2014;19:77–87. doi: 10.1177/1087057113501198. [DOI] [PMC free article] [PubMed] [Google Scholar]
- 109.Adams M, Cookson VJ, Higgins J, et al. A high-throughput assay to identify modifiers of premature chromosome condensation. J Biomol Screen. 2014;19:176–83. doi: 10.1177/1087057113495443. [DOI] [PubMed] [Google Scholar]
- 110.Cappella P, Gasparri F. Highly multiplexed phenotypic imaging for cell proliferation studies. J Biomol Screen. 2014;19:145–57. doi: 10.1177/1087057113495712. [DOI] [PubMed] [Google Scholar]
- 111.Xu M, Liu K, Swaroop M, et al. A phenotypic compound screening assay for lysosomal storage diseases. J Biomol Screen. 2014;19:168–75. doi: 10.1177/1087057113501197. [DOI] [PMC free article] [PubMed] [Google Scholar]
- 112.Pinilla C, Edwards BS, Appel JR, et al. Selective agonists and antagonists of formylpeptide receptors: duplex flow cytometry and mixture-based positional scanning libraries. Mol Pharmacol. 2013;84:314–24. doi: 10.1124/mol.113.086595. [DOI] [PMC free article] [PubMed] [Google Scholar]
- 113.Ye RD, Boulay F, Wang JM, et al. International Union of Basic and Clinical Pharmacology. LXXIII. Nomenclature for the formyl peptide receptor (FPR) family. Pharmacol Rev. 2009;61:119–61. doi: 10.1124/pr.109.001578. [DOI] [PMC free article] [PubMed] [Google Scholar]
- 114.Houghten RA, Pinilla C, Appel JR, et al. Mixture-based synthetic combinatorial libraries. J Med Chem. 1999;42:3743–78. doi: 10.1021/jm990174v. [DOI] [PubMed] [Google Scholar]
- 115.Houghten RA, Pinilla C, Giulianotti MA, et al. Strategies for the use of mixture-based synthetic combinatorial libraries: scaffold ranking, direct testing in vivo, and enhanced deconvolution by computational methods. J Comb Chem. 2008;10:3–19. doi: 10.1021/cc7001205. [DOI] [PubMed] [Google Scholar]
- 116.Edwards BS, Bologa C, Young SM, et al. Integration of virtual screening with high-throughput flow cytometry to identify novel small molecule formylpeptide receptor antagonists. Mol Pharmacol. 2005;68:1301–10. doi: 10.1124/mol.105.014068. [DOI] [PubMed] [Google Scholar]
- 117.Young SM, Bologa CM, Fara D, et al. Duplex high-throughput flow cytometry screen identifies two novel formylpeptide receptor family probes. Cytometry A. 2009;75:253–63. doi: 10.1002/cyto.a.20645. [DOI] [PMC free article] [PubMed] [Google Scholar]
- 118.Cornelissen F, Cik M, Gustin E. Phaedra, a protocol-driven system for analysis and validation of high-content imaging and flow cytometry. J Biomol Screen. 2012;17:496–506. doi: 10.1177/1087057111432885. [DOI] [PubMed] [Google Scholar]
- 119.Robinson JP, Patsekin V, Holdman C, et al. High-throughput secondary screening at the single-cell level. J Lab Autom. 2013;18:85–98. doi: 10.1177/2211068212456978. [DOI] [PMC free article] [PubMed] [Google Scholar]
- 120.Khanna I. Drug discovery in pharmaceutical industry: productivity challanges and trends. Drug Discov Today. 2012;17:1088–1102. doi: 10.1016/j.drudis.2012.05.007. [DOI] [PubMed] [Google Scholar]
- 121.Lee R, Tran M, Nocerini M, et al. A high-throughput hybridoma selection method using fluorometric microvolume assay technology. J Biomol Screen. 2008;13:210–7. doi: 10.1177/1087057108314148. [DOI] [PubMed] [Google Scholar]
- 122.Eglen R, Reisine T. Primary cells and stem cells in drug discovery: emerging tools for high-throughput screening. Assay Drug Dev Technol. 2011;9:108–24. doi: 10.1089/adt.2010.0305. [DOI] [PubMed] [Google Scholar]
- 123.Pemovska T, Kontro M, Yadav B, et al. Individualized systems medicine strategy to tailor treatments for patients with chemorefractory acute myeloid leukemia. Cancer Discov. 2013;3:1416–29. doi: 10.1158/2159-8290.CD-13-0350. [DOI] [PubMed] [Google Scholar]
- 124.Grskovic M, Javaherian A, Strulovici B, et al. Induced pluripotent stem cells--opportunities for disease modelling and drug discovery. Nat Rev Drug Discov. 2011;10:915–29. doi: 10.1038/nrd3577. [DOI] [PubMed] [Google Scholar]
- 125.Zhang R, Zhang LH, Xie X. iPSCs and small molecules: a reciprocal effort towards better approaches for drug discovery. Acta Pharmacol Sin. 2013;34:765–76. doi: 10.1038/aps.2013.21. [DOI] [PMC free article] [PubMed] [Google Scholar]
- 126.Beck B, Blanpain C. Unravelling cancer stem cell potential. Nat Rev Cancer. 2013;13:727–38. doi: 10.1038/nrc3597. [DOI] [PubMed] [Google Scholar]
- 127.Kreso A, Dick JE. Evolution of the cancer stem cell model. Cell Stem Cell. 2014;14:275–91. doi: 10.1016/j.stem.2014.02.006. [DOI] [PubMed] [Google Scholar]
- 128.O’Brien CA, Kreso A, Dick JE. Cancer stem cells in solid tumors: an overview. Semin Radiat Oncol. 2009;19:71–7. doi: 10.1016/j.semradonc.2008.11.001. [DOI] [PubMed] [Google Scholar]
- 129.Winquist RJ, Furey BF, Boucher DM. Cancer stem cells as the relevant biomass for drug discovery. Curr Opin Pharmacol. 2010;10:385–90. doi: 10.1016/j.coph.2010.06.008. [DOI] [PubMed] [Google Scholar]
- 130.Joosse SA, Gorges TM, Pantel K. Biology, detection, and clinical implications of circulating tumor cells. EMBO Mol Med. 2014 doi: 10.15252/emmm.201303698. [DOI] [PMC free article] [PubMed] [Google Scholar]
- 131.Nagrath S, Sequist LV, Maheswaran S, et al. Isolation of rare circulating tumour cells in cancer patients by microchip technology. Nature. 2007;450:1235–9. doi: 10.1038/nature06385. [DOI] [PMC free article] [PubMed] [Google Scholar]
- 132.Adams JD, Kim U, Soh HT. Multitarget magnetic activated cell sorter. Proc Natl Acad Sci U S A. 2008;105:18165–70. doi: 10.1073/pnas.0809795105. [DOI] [PMC free article] [PubMed] [Google Scholar]
- 133.Piyasena ME, Austin Suthanthiraraj PP, Applegate RW, Jr, et al. Anal Chem. 2012;84:1831–9. doi: 10.1021/ac200963n. [DOI] [PMC free article] [PubMed] [Google Scholar]
- 134.Piyasena ME, Graves SW. The intersection of flow cytometry with microfluidics and microfabrication. Lab Chip. 2014;14:1044–59. doi: 10.1039/c3lc51152a. [DOI] [PMC free article] [PubMed] [Google Scholar]
- 135.Goddard GR, Sanders CK, Martin JC, et al. Analytical performance of an ultrasonic particle focusing flow cytometer. Anal Chem. 2007;79:8740–6. doi: 10.1021/ac071402t. [DOI] [PubMed] [Google Scholar]
- 136.Laurell T, Petersson F, Nilsson A. Chip integrated strategies for acoustic separation and manipulation of cells and particles. Chem Soc Rev. 2007;36:492–506. doi: 10.1039/b601326k. [DOI] [PubMed] [Google Scholar]
- 137.George TC, Basiji DA, Hall BE, et al. Distinguishing modes of cell death using the ImageStream multispectral imaging flow cytometer. Cytometry A. 2004;59:237–45. doi: 10.1002/cyto.a.20048. [DOI] [PubMed] [Google Scholar]
- 138.Ortyn WE, Hall BE, George TC, et al. Sensitivity measurement and compensation in spectral imaging. Cytometry A. 2006;69:852–62. doi: 10.1002/cyto.a.20306. [DOI] [PubMed] [Google Scholar]
- 139.Goda K, Ayazi A, Gossett DR, et al. High-throughput single-microparticle imaging flow analyzer. Proc Natl Acad Sci U S A. 2012;109:11630–5. doi: 10.1073/pnas.1204718109. [DOI] [PMC free article] [PubMed] [Google Scholar]
- 140.Goda K, Tsia KK, Jalali B. Serial time-encoded amplified imaging for real-time observation of fast dynamic phenomena. Nature. 2009;458:1145–9. doi: 10.1038/nature07980. [DOI] [PubMed] [Google Scholar]
- 141.McKenna BK, Evans JG, Cheung MC, et al. A parallel microfluidic flow cytometer for high-content screening. Nat Methods. 2011;8:401–3. doi: 10.1038/nmeth.1595. [DOI] [PMC free article] [PubMed] [Google Scholar]
- 142.Nolan JP, Duggan E, Liu E, et al. Single cell analysis using surface enhanced Raman scattering (SERS) tags. Methods. 2012;57:272–9. doi: 10.1016/j.ymeth.2012.03.024. [DOI] [PMC free article] [PubMed] [Google Scholar]
- 143.Bendall SC, Nolan GP, Roederer M, et al. A deep profiler’s guide to cytometry. Trends Immunol. 2012;33:323–32. doi: 10.1016/j.it.2012.02.010. [DOI] [PMC free article] [PubMed] [Google Scholar]
- 144.Atkuri KR, Stevens JC, Neubert H. Mass Cytometry: A Highly Multiplexed Single Cell Technology for Advancing Drug Development. Drug Metab Dispos. 2014 doi: 10.1124/dmd.114.060798. [DOI] [PubMed] [Google Scholar]
- 145.Bendall SC, Simonds EF, Qiu P, et al. Single-cell mass cytometry of differential immune and drug responses across a human hematopoietic continuum. Science. 2011;332:687–96. doi: 10.1126/science.1198704. [DOI] [PMC free article] [PubMed] [Google Scholar]
- 146.Newell EW, Sigal N, Bendall SC, et al. Cytometry by time-of-flight shows combinatorial cytokine expression and virus-specific cell niches within a continuum of CD8+ T cell phenotypes. Immunity. 2012;36:142–52. doi: 10.1016/j.immuni.2012.01.002. [DOI] [PMC free article] [PubMed] [Google Scholar]
- 147.Horowitz A, Strauss-Albee DM, Leipold M, et al. Genetic and environmental determinants of human NK cell diversity revealed by mass cytometry. Sci Transl Med. 2013;5:208ra145. doi: 10.1126/scitranslmed.3006702. [DOI] [PMC free article] [PubMed] [Google Scholar]
- 148.Bandura DR, Baranov VI, Ornatsky OI, et al. Mass cytometry: technique for real time single cell multitarget immunoassay based on inductively coupled plasma time-of-flight mass spectrometry. Anal Chem. 2009;81:6813–22. doi: 10.1021/ac901049w. [DOI] [PubMed] [Google Scholar]
- 149.Burdett E, Kasper FK, Mikos AG, et al. Engineering tumors: a tissue engineering perspective in cancer biology. Tissue Eng Part B Rev. 2010;16:351–9. doi: 10.1089/ten.TEB.2009.0676. [DOI] [PubMed] [Google Scholar]
- 150.Kunz-Schughart LA, Freyer JP, Hofstaedter F, et al. The use of 3-D cultures for high-throughput screening: the multicellular spheroid model. J Biomol Screen. 2004;9:273–85. doi: 10.1177/1087057104265040. [DOI] [PubMed] [Google Scholar]
- 151.Yang HC, Xing S, Shan L, et al. Small-molecule screening using a human primary cell model of HIV latency identifies compounds that reverse latency without cellular activation. J Clin Invest. 2009;119:3473–86. doi: 10.1172/JCI39199. [DOI] [PMC free article] [PubMed] [Google Scholar]
- 152.Shishido T, Wolschendorf F, Duverger A, et al. Selected drugs with reported secondary cell-differentiating capacity prime latent HIV-1 infection for reactivation. J Virol. 2012;86:9055–69. doi: 10.1128/JVI.00793-12. [DOI] [PMC free article] [PubMed] [Google Scholar]
- 153.Thompson TA, Sklar LA. Prostate cell differentiation assays. PubChem Bioassay Screening Summary. 2008 http://pubchem.ncbi.nlm.nih.gov/assay/assay.cgi?aid=1260.
- 154.Haynes MK, Strouse JJ, Waller A, et al. Detection of intracellular granularity induction in prostate cancer cell lines by small molecules using the HyperCyt high-throughput flow cytometry system. J Biomol Screen. 2009;14:596–609. doi: 10.1177/1087057109335671. [DOI] [PMC free article] [PubMed] [Google Scholar]
- 155.Burhans WC, Sklar LA. Yeast senescence screen. PubChem Bioassay Screening Summary. 2010 http://pubchem.ncbi.nlm.nih.gov/assay/assay.cgi?aid=2714.