

Abstract
Background: An important issue the world faces today is ensuring that households living in different countries have access to enough food to maintain a healthy life. Food insecurity is prevalent in both developed and developing countries. The objective of this study was to assess the household food security status and related factors among different rural districts of Neyshabur (A city in northeast of Iran).
Methods: Of 5000 selected rural households 4647 were studied in this cross-sectional study. A validated short questionnaire (with six questions) was used to measure food security. Chi-square test and logistic regression were used for data analysis through SPSS software.
Results: In total, 2747 households (59.1%) were identified as food secure. The highest prevalence of food security was observed in Central district (62.3%) and the lowest was in Miyanjolgeh district (52.9%). Backward multiple logistic regression revealed that car ownership, presence of chronic disease in household and household income (per month) were significantly associated with food security in all of surveyed districts (p< 0.05).
Conclusion: According to results of this study, lower than 60% of Neyshabur rural households were food secure and economic variables were the most important factors. Therefore, a special attention should be paid to this health problem in these regions.
Keywords: Food security, Household, Iran
Introduction
Food security is defined as access by all people at all times to enough food for an active healthy life (1). Therefore, the concept of food security includes: (a) the availability of food that is adequate, safe and nutritious; and (b) an assured ability to procure and acquire food of good quality in a socially acceptable way. Food insecurity could occur when food is not easily accessible and households have difficulty securing adequate food (2). When food insecurity occurs, household members begin to skip meals or otherwise cut back on the amount of food they consume, that this situation has considerable health impacts on the psychological, physical and social status of individuals in communities (3-5). Food and Agriculture Organization (FAO) estimates that %12 (842 million people) of the global population were unable to meet their dietary energy requirements in 2011–13. Thus, around one in eight people in the world do not have enough food for an active and healthy life. The vast majority of them (827 million) live in developing regions (6). "Food security is a complex condition which its dimensions (availability, access, utilization and stability) are better understood when presented through a suite of indicators" (6). Some surveys studied food security in Iran and they have found some variations of the prevalence of food security in different regions (7-9). Different factors may be related to food security, for example family size, family income, having children in the household, presence of both parents, number of centers that provide food, having a house, having a car, etc. For determining the related factors of food security, it is essential to first understand the status of food security in households and then to specify the related factors. The objective of this study was to assess the household food security status and related factors among rural households in Neyshabur (Northeast of Iran).
Methods
Data
This cross-sectional study was conducted on 5000 rural households that were selected from Neyshabur. Neyshabur is divided into four districts (Central, Zebarkhan, Sarvelayat and Miyanjolgeh) and each includes many villages. In this study, we used simple random sampling, thus we had rural households from different districts for analysis. Of all selected households, 4647 contributed to this study and others were excluded because of disagreement to contribute in study. Informed consent provided for all participating households after being acquainted with the purpose of study. In this study, questionnaires were filled out by trained interviewers; all participating households were informed that their responses would remain confidential.
Instrument
A validated household food security short questionnaire was used to measure the prevalence of food security of the surveyed households. This questionnaire was validated in Iran by Dastgiri, et al (10) and contains six items from the food security: 1. In the last 12 months, did you or any other in your household ever had to cut the size of meals or skip meals entirely because of no enough money for food? 2. If yes, how often did this happen? 3. In the last 12 months, did you ever eat less than enough because there was no enough money to buy food? 4. In the last 12 months, were you ever hungry but did not eat because you could not afford enough food? 5. The food that I/we bought just did not last, and I/we did not have money to buy more. Was this often, sometimes, or never true for you or the other members of your household in the last 12 months? 6. I/we could not afford to eat balanced meals. Was this often, sometimes, or never true for you or the other members of your household in the last 12 months? Households were classified as ‘food-secure’ if the respondent answered negatively to five or more of the six household food security questions. For questions number 1, 3 and 4, ‘No’ were considered negative responses, and for question number 2 ‘Only one or two months’ was considered negative response. ‘Never’ was considered negative response for questions 5 and 6. In this study, food security was considered as dependent variable and the other data were considered as independent variables.
Statistical analysis
The data collected were analyzed using descriptive statistics including frequencies, ranges, means, and standard deviations (SD) through SPSS v.16 software. Logistic regression model was used to investigate the association between food security and other variables. Odds Ratio (OR) with 95% confidence interval (CI) was reported. Significant level was set as p<0.05.
Results
Of 4647 households, 1970 (42%) were selected randomly from Central district, 964 (21%) from Zebarkhan, 743 (16%) from Sarvelayat and 970 (21%) from Miyanjolgeh. The characteristics of study households are shown in Table 1 according to selected districts.
Table 1 . Characteristics of study households according to the surveyed districts (n = 4647) .
| Central (n=1970) | Zebarkhan (n=964 ) | Sarvelayat (n=743 | Miyanjolgeh (n=970) | |||||
| Variables | n | % | n | % | n | % | N | % |
| Family size | ||||||||
| ≤ 3 | 918 | 46.6 | 443 | 46 | 287 | 38.6 | 409 | 42.2 |
| > 3 | 1052 | 53.4 | 521 | 54 | 456 | 61.4 | 561 | 57.8 |
| Education level of head of family * | ||||||||
| < 12 yr | 1777 | 90.2 | 905 | 93.9 | 680 | 91.5 | 922 | 95.1 |
| ≥ 12 yr | 192 | 9.8 | 59 | 6.1 | 63 | 8.5 | 48 | 4.9 |
| Age of head of family | ||||||||
| ≤ 50 yr | 1298 | 65.9 | 586 | 60.8 | 372 | 50.1 | 634 | 65.4 |
| > 50 yr | 672 | 34.1 | 378 | 39.2 | 371 | 49.9 | 336 | 34.6 |
| Presence of children at home | ||||||||
| No | 349 | 17.7 | 191 | 19.8 | 149 | 20.1 | 160 | 16.5 |
| Yes | 1621 | 82.3 | 773 | 80.2 | 594 | 79.9 | 810 | 83.5 |
| Car ownership* | ||||||||
| No | 1424 | 72.3 | 790 | 82 | 616 | 83 | 757 | 78.1 |
| Yes | 546 | 27.7 | 174 | 18 | 126 | 17 | 212 | 21.9 |
| House ownership | ||||||||
| Tenant | 240 | 12.2 | 97 | 10.1 | 88 | 11.8 | 59 | 6.1 |
| Private house | 1730 | 87.8 | 867 | 89.9 | 655 | 88.2 | 911 | 93.9 |
| Presence of chronic disease in household* | ||||||||
| No | 1612 | 81.9 | 760 | 78.8 | 563 | 76.1 | 711 | 73.3 |
| Yes | 357 | 18.1 | 204 | 21.2 | 177 | 23.9 | 259 | 26.7 |
| Distance from the city | ||||||||
| ≤ 30 km | 1960 | 99.5 | 624 | 64.7 | 164 | 22.1 | 211 | 21.8 |
| > 30 km | 10 | 0.5 | 340 | 35.3 | 579 | 77.9 | 759 | 78.2 |
| Number of centers that provides food | ||||||||
| < 2 | 554 | 28.1 | 216 | 22.4 | 152 | 20.5 | 310 | 32 |
| ≥ 2 | 1416 | 71.9 | 748 | 77.6 | 591 | 79.5 | 660 | 68 |
| Presence of smoker in household* | ||||||||
| No | 1465 | 74.4 | 764 | 79.3 | 574 | 77.3 | 708 | 73 |
| Yes | 504 | 25.6 | 200 | 20.7 | 169 | 22.7 | 262 | 27 |
| Residential infrastructure* | ||||||||
| ≤ 50 m2 | 401 | 20.4 | 419 | 43.5 | 170 | 23.1 | 185 | 19.2 |
| > 50 m2 | 1567 | 79.6 | 545 | 56.5 | 567 | 76.9 | 780 | 80.8 |
| Parentship status | ||||||||
| Single parents | 271 | 13.8 | 128 | 13.3 | 155 | 20.9 | 122 | 12.6 |
| Two parent | 1699 | 86.2 | 836 | 86.7 | 588 | 79.1 | 848 | 87.4 |
| Household income (monthly)* | ||||||||
| < 4000000 rial | 1523 | 77.6 | 748 | 77.7 | 558 | 75.7 | 787 | 81.7 |
| ≥ 4000000 rial | 439 | 22.4 | 215 | 22.3 | 179 | 24.3 | 176 | 18.3 |
*Some data were missing in these variables
In total, 2747 households (59.1%) were identified as food secure. The highest prevalence of food security was observed in Central district (62.3%, 95% CI: 60.9-63.7%) and the lowest in Miyanjolgeh district (52.9%, 95 CI: 51.5-54.3%) (Fig.1).
Fig. 1 .
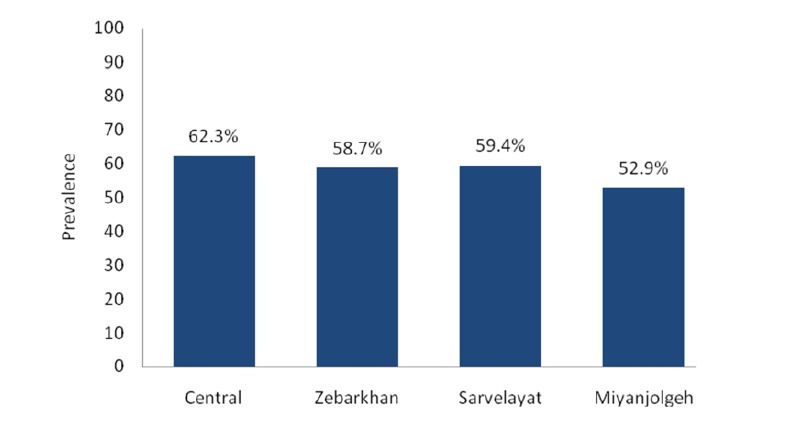
Household food security status according to the surveyed districts
Univariate logistic regression revealed that there was significant relation between some variables such as education level and age of head of family, car ownership, house ownership, presence of chronic disease in the household, presence of smoker in the household, distance from the city, number of centers that provide food, residential infrastructure, parentship status and household income per month with food security status in surveyed districts separately (p<0.05) (Table 2).
Table 2 . Odds ratio (OR) estimates based on the univariate logistic regression model according to the surveyed districts .
| Variable | Central | Zebarkhan | Sarvelayat | Miyanjolgeh | ||||||||||||
| Food Security | OR | p | Food Security | OR | p | Food Security | OR | p | Food Security | OR | p | |||||
| yes n=1227 | no n=743 | yes n=566 | no n=398 | yes n=441 | no n=302 | yes n=513 | no n=457 | |||||||||
| Family size | ||||||||||||||||
| ≤ 3 | 594 | 324 | 0.82 | 0.38 | 261 | 182 | 0.99 | 0.906 | 170 | 117 | 1.008 | 0.958 | 209 | 200 | 1.13 | 0.341 |
| > 3 | 633 | 419 | 305 | 216 | 271 | 185 | 304 | 257 | ||||||||
| Education level of head of family * | ||||||||||||||||
| < 12 yr | 1083 | 694 | 1.92 | <0.001 | 521 | 384 | 2.37 | 0.005 | 395 | 286 | 2.13 | 0.01 | 488 | 434 | 0.97 | 0.91 |
| ≥ 12 yr | 144 | 48 | 45 | 14 | 47 | 16 | 25 | 23 | ||||||||
| Age of head of family | ||||||||||||||||
| ≤ 50 yr | 842 | 456 | 0.73 | 0.001 | 364 | 222 | 0.7 | 0.008 | 221 | 151 | 0.995 | 0.976 | 359 | 275 | 0.65 | 0.001 |
| > 50 yr | 385 | 287 | 202 | 176 | 220 | 151 | 154 | 182 | ||||||||
| Presence of children at home | ||||||||||||||||
| No | 221 | 128 | 0.95 | 0.659 | 107 | 84 | 1.15 | 0.399 | 94 | 55 | 0.82 | 0.299 | 83 | 77 | 1.05 | 0.779 |
| Yes | 1006 | 615 | 459 | 314 | 347 | 247 | 430 | 380 | ||||||||
| Car ownership* | ||||||||||||||||
| No | 796 | 628 | 2.96 | <0.001 | 433 | 357 | 2.68 | <0.001 | 340 | 276 | 3.2 | <0.001 | 357 | 400 | 3.05 | <0.001 |
| Yes | 431 | 115 | 133 | 41 | 100 | 26 | 155 | 57 | ||||||||
| House ownership | ||||||||||||||||
| Tenant | 116 | 124 | 1.92 | <0.001 | 47 | 50 | 1.59 | 0.030 | 38 | 50 | 2.1 | 0.001 | 15 | 44 | 3.54 | <0.001 |
| Private house | 1111 | 619 | 519 | 348 | 403 | 252 | 498 | 413 | ||||||||
| Presence of chronic disease in household* | ||||||||||||||||
| No | 1063 | 549 | 0.43 | <0.001 | 477 | 283 | 0.46 | <0.001 | 362 | 201 | 0.42 | <0.001 | 417 | 294 | 0.42 | <0.001 |
| Yes | 163 | 194 | 89 | 115 | 76 | 101 | 96 | 163 | ||||||||
| Distance from the city | ||||||||||||||||
| ≤ 30 km | 1223 | 737 | 0.4 | 0.145 | 392 | 232 | 0.62 | <0.001 | 94 | 70 | 1.11 | 0.547 | 149 | 62 | 0.38 | <0.001 |
| > 30 km | 4 | 6 | 174 | 166 | 347 | 232 | 364 | 395 | ||||||||
| Number of centers that provides food | ||||||||||||||||
| < 2 | 288 | 266 | 1.82 | <0.001 | 117 | 99 | 1.27 | 0.123 | 81 | 71 | 1. | 0.088 | 199 | 111 | 0.51 | <0.001 |
| ≥ 2 | 939 | 477 | 449 | 299 | 360 | 231 | 314 | 346 | ||||||||
| presence of smoker in household* | ||||||||||||||||
| No | 948 | 517 | 0.68 | <0.001 | 479 | 285 | 0.46 | 0.066 | 351 | 223 | 0.72 | <0.001 | 405 | 303 | 0.53 | <0.001 |
| Yes | 279 | 225 | 87 | 113 | 90 | 79 | 108 | 154 | ||||||||
| Residential infrastructure* | ||||||||||||||||
| ≤ 50 m2 | 196 | 205 | 2.006 | <0.001 | 209 | 210 | 1.91 | <0.001 | 55 | 115 | 4.32 | <0.001 | 55 | 130 | 3.34 | <0.001 |
| > 50 m2 | 1030 | 537 | 357 | 188 | 382 | 185 | 457 | 323 | ||||||||
| Parentship status | ||||||||||||||||
| Single parents | 112 | 159 | 2.71 | <0.001 | 65 | 63 | 1.45 | 0.05 | 81 | 74 | 1.44 | 0.43 | 44 | 78 | 2.19 | <0.001 |
| Two parent | 1115 | 584 | 501 | 335 | 360 | 228 | 469 | 379 | ||||||||
| Household income (monthly)* | ||||||||||||||||
| <4000000 rial | 848 | 675 | 4.66 | <0.001 | 378 | 370 | 6.54 | <0.001 | 287 | 271 | 3.29 | <0.001 | 367 | 420 | 4.96 | <0.001 |
| ≥4000000 rial | 375 | 64 | 187 | 28 | 151 | 28 | 143 | 33 | ||||||||
Table 3 presents the results of backward multiple logistic regression according to surveyed districts; variables with significant relations were as follows: education level of head of family, car ownership, house ownership, presence of chronic disease in the household, presence of smoker in household, distance from the city, number of centers that provides food, residential infrastructure, parentship status and household income per month (p<0.05).
Table 3 . Odds ratio (OR) estimates based on the backward multiple logistic regression model according to the surveyed districts .
| District | Variables | Β | OR | 95%CI | p |
| Central | Car ownership | 0.669 | 1.95 | (1.52 , 2.5) | <0.001 |
| House ownership | 0.527 | 1.69 | (1.26 , 2.27) | <0.001 | |
| Presence of chronic disease in household | -0.662 | 0.52 | (0.40 , 0.67) | <0.001 | |
| Number of centers that provides food | 0.578 | 1.78 | (1.44 , 2.22) | <0.001 | |
| presence of smoker in household | -0.492 | 0.61 | (0.49 , 0.77) | <0.001 | |
| Parentship status | 0.791 | 2.21 | (1.66 , 2.94) | <0.001 | |
| Household income (per month) | 1.265 | 3.54 | (2.63 , 4.77) | <0.001 | |
| Zebarkhan | Education level of head of family | 0.726 | 2.07 | (1.08 , 3.97) | 0.029 |
| Car ownership | 0.616 | 1.85 | (1.23 , 2.78) | 0.003 | |
| House ownership | 0.521 | 1.68 | (1.07 , 2.66) | 0.025 | |
| Presence of chronic disease in household | -0.754 | 0.47 | (0.34 , 0.66) | <0.001 | |
| Distance from the city | -0.321 | 0.73 | (0.54 , 0.97) | 0.028 | |
| Household income (per month) | 1.729 | 5.64 | (3.66 , 8.69) | <0.001 | |
| Sarvelayat | Car ownership | 0.679 | 1.97 | (1.19 , 3.26) | 0.08 |
| Presence of chronic disease in household | -0.769 | 0.46 | (0.31 , 0.69) | <0.001 | |
| Residential infrastructure | 1.365 | 3.92 | (2.64 , 5.81) | <0.001 | |
| Household income (per month) | 1.412 | 4.10 | (2.58 , 6.54) | <0.001 | |
| Miyanjolgeh | Car ownership | 0.522 | 1.69 | (1.15 , 2.47) | 0.007 |
| House ownership | 1.039 | 2.83 | (1.44 , 5.54) | 0.003 | |
| Presence of chronic disease in household | -0.748 | 0.47 | (0.34 , 0.66) | <0.001 | |
| Distance from the city | -0.942 | 0.39 | (0.27 , 0.56) | <0.001 | |
| Number of centers that provides food | -0.600 | 0.55 | (0.40 , 0.75) | <0.001 | |
| presence of smoker in household | -0.685 | 0.50 | (0.37 , 0.70) | <0.001 | |
| Residential infrastructure | 0.787 | 2.20 | (1.50 , 3.23) | <0.001 | |
| Household income (per month) | 1.314 | 3.72 | (2.41 , 5.74) | <0.001 |
Discussion
The findings of this study indicated that 59.1% of surveyed rural households were food secure, thus more than 40% were food insecure. In Mohammadi’ study conducted on 7158 households (2496 rural and 4662 urban) in Iran, it was observed that 87% of rural households and 71% of urban households were food secure (9). In Sharafkhani’s study that conducted in the Northwest of Iran, it was observed that 40.4% of studied rural households were food secure and the others (59.6%) were food insecure (7). In Babatunde's study conducted in order to assess factors influencing food security status of rural farming households in north central Nigeria, it was observed that 36% of them were food secure and the others (64%) had experienced some degree of food insecurity (11). Also in Omotesho's study it was observed that 48.28% of rural Households in Kwara State, Nigeria were food secure and the others (51.72%) were food insecure (12). Therefore, the prevalence of food security has diversity in different studies. According to the different districts of Neyshabur, the highest prevalence of food security was observed in Central district (62.3%) and the lowest was in Miyanjolgeh district (52.9%). This result was not unexpected, because Central district is near to Neyshabur city and their households can provide food easier than households in Miyanjolgeh district that they are far from Neyshabur city. In this study, associated torevealed that some factors (education level of head of family, car ownership, house ownership, presence of chronic disease in household, presence of smoker in household, distance from the city, number of places that provides food, residential infrastructure, parentship status and household income per month) had efects on household food security of study population. However, three factors were common in all regions studied, including car ownership, presence of chronic disease in household and household income (per month). In this study, most factors are positively associated with food security in four districts (education level of head of family, car ownership, house ownership, residential infrastructure, parentship status and household income per month) and the household income (per month) is the most important one. As household income decreased, the food security also decreased in all districts. The findings of Bashir’s study showed that household’s monthly income and household head’s education levels were positively associated to household food security but household heads’ age and family size were negatively associated with household food security (13). The results of Omotesho’s study that conducted to study Food Security and Poverty of the Rural Households in Kwara State, Nigeria, revealed that accessibility to health facilities; household size, farm size and household expenditure on food were the major determinants of a household’s food security status (12). In Babatunde’s study that conducted to examine the factors influencing the food security status of rural farming household in north central Nigeria it was observed that total annual income, household size, educational status of household's head and quantity of food obtained from own production were associated with household food security (11). Mohammadi conducted a study among Iranian households in the city of Tehran and identified low education and job level of household head and lower income as some of the major factors of food insecurity (14). In a study conducted by Sharafkhani it was observed that distance from the city, number of centers that provides food, family size, presence of both parents and residential infrastructure were related factors to food insecurity (15). The results of Omidvar’ study showed that food insecurity was significantly more prevalent in households whose head and spouse had lower level of education, not owning their house and low socioeconomic status (SES) (16). In one study Dastgiri identified related factors to food insecurity as: children at home, elderly people at home, education (head of family), car ownership, house ownership, monthly income, and parenting status (17). In Sheykholeslam's study also it was observed that the low level of education of the household head and spouse (mother) is one of the major predictors of household food insecurity (18). Influential factors in Furness’ study were: income, children in household and past homelessness (19). As observed in this and other mentioned studies, educational level of the household head and household income are the main factors related to food security or food insecurity. According to these factors, cultural and economic interventions are suggested. A major limitation of this study was the use of a cross-sectional study design, which is not sufficient to determine causal direction. Despite this limitation, this study provides valuable information on food security among rural households in Neyshabur.
Conclusion
The results of this study provide insights into the prevalence and factors associated with food security among rural households in Neyshabur. According to the results of this study, more than 40% of rural households of Neyshabur suffered from food insecurity and this problem is more prevalent in households with low income. It also observed that prevalence of food security in four districts of Neyshabur was different but some of associated factors were common in these districts. According to these results, a special attention should be paid to rural households of Neyshabur.
Acknowledgments
The authors gratefully acknowledge householdswho willingly contributed in this study. Also acknowledge Neyshabur University of Medical Sciences that supported this study.
Conflict of interest
The authors have no conflicts of interest.
Cite this article as: Gholami A, Foroozanfar Z. Household food security status in the Northeast of Iran: a cross-sectional study. Med J Islam Repub Iran 2015 (4 July). Vol. 29:227.
References
- 1. United States Department of Agriculture. Economic Research Service [Internet]. Food security in the United States: definitions of hunger and food security. Washington: USDA; 2011. Available from: http://www.ers.usda.gov/Briefing/FoodSecurity/labels.htm [Accessed 16 September 2011].
- 2. The state of food insecurity in the world 2004: monitoring progress towards the World Food Summit and Millennium Development Goals. Rome: Food and Agriculture Organization; 2004. Available from: ftp://ftp.fao.org/DOCREP/FAO/007/Y5650E/Y5650E00.PDF [Accessed 13 September 2011].
- 3. Food and Agriculture Organization (FAO). [Cited 2009/3/29]; Available from: http://www.fao.org.
- 4. World Health Organisation (WHO). [Cited 2009/3/29]; Available from: http://www.who.int.
- 5.Alaimo K, Briefel RR, Frongillo EA Jr, Olson CM. Food insufficiency exists in the United States: Results from thethird National Health and Nutrition Examination Survey (NHANES III) Am J Public Health. 1998;88:419–26. doi: 10.2105/ajph.88.3.419. [DOI] [PMC free article] [PubMed] [Google Scholar]
- 6. FAO, IFAD and WFP. The State of Food Insecurity in the World 2013.The multiple dimensions of food security. Rome, FAO. 2013.
- 7.Sharafkhani R, Dastgiri S, Gharaaghaji R, Ghavamzadeh S, Didarloo A. The role of household structure on the prevalence of food insecurity. Eur J Gen Med. 2010;7:385–8. [Google Scholar]
- 8.Mohammadzadeh A, Dorosty A, Eshraghian M. Household food security status and associated factors among high-school students in Esfahan, Iran. Public Health Nutr. 2010;13:1609–13. doi: 10.1017/S1368980010000467. [DOI] [PubMed] [Google Scholar]
- 9.Mohammadi F, Omidvar N, Houshiar Rad A, Mehrabi Y, Abdollahi M. Association of food security and body weight status of adult members of Iranian households. Iranian Journal of Nutrition Sciences & FoodTechnology. 2008;3(2):41–53. [Google Scholar]
- 10.Dastgiri S, Tutunchi H, Ostadrahimi A, Mahboob S. Sensitivity and specificity of a short questionnaire for food insecurity surveillance in Iran. Food Nutr Bull. 2007;28:55–8. doi: 10.1177/156482650702800106. [DOI] [PubMed] [Google Scholar]
- 11.Babatunde RO, Omotesho OA, Sholotan OS. Factors influencing food security status of rural farming households in north central Nigeria. Agric J. 2007;2(3):351–7. [Google Scholar]
- 12.Omotesho OA, Adewumi MO, Fadimula KS. Food Security and Poverty of the Rural Households in Kwara State, Nigeria. Libyan Agric Res Cen J Int. 2010;1(1):56–5. [Google Scholar]
- 13. Bashir MK, Schilizzi S,Pandit R.The determinants of rural household food security: The Case of Landless Households of the Punjab, Pakistan, Working Paper 1208, School of Agricultural and Resource Economics, University of Western Australia, Crawley, Australia, 2012.
- 14.Mohammadi F, Omidvar N, Houshiar-Rad A, Khoshfetrat MR, Abdollahi M, Mehrabi Y. Validity of an adapted household food insecurity access scale in urban households in Iran. Public Health Nutr. 2012;15:149–57. doi: 10.1017/S1368980011001376. [DOI] [PubMed] [Google Scholar]
- 15.Sharafkhani R, Dastgiri S, GharaaghajiAsl R, Ghavamzadeh S. Factors Influencing Household Food Security Status. Food Nutr Sci. 2011;2:31–4. [Google Scholar]
- 16.Omidvar N1, Ghazi-Tabatabie M, Sadeghi R, Mohammadi F, Abbasi-Shavazi MJ. Food insecurity and its sociodemographiccorrelates among Afghan immigrants in Iran. J Health Popul Nutr. 2013;31(3):356–66. doi: 10.3329/jhpn.v31i3.16828. [DOI] [PMC free article] [PubMed] [Google Scholar]
- 17.Dastgiri S, Sharafkhani R, GharaaghajiAsl R, Ghavamzadeh S. Prevalence, influencing factors and control of food insecurity: a model in the northwest of Iran. Asia Pac J Clin Nutr. 2011;20:613–17. [PubMed] [Google Scholar]
- 18. Sheykholeslam R, Abdollahi Z, Salarkia N, Kavehi Z, Abdollahi M, Kalantari N, et al. Food security assessment of urban Afghan refugee populations in Pakdasht, Iran. Tehran: World Food Program 2008; 38.
- 19.Furness BW, Simon PA, Wold CM, Asarian-Anderson J. Prevalence and predictors of food insecurity among low- income households in Los Angeles County. Public Health Nutr. 2004;7:791–4. doi: 10.1079/phn2004608. [DOI] [PubMed] [Google Scholar]