

Abstract
The evolution of heterogametic sex chromosomes is often—but not always—accompanied by the evolution of dosage compensating mechanisms that mitigate the impact of sex-specific gene dosage on levels of gene expression. One emerging view of this process is that such mechanisms may only evolve in male-heterogametic (XY) species but not in female-heterogametic (ZW) species, which will consequently exhibit “incomplete” sex chromosome dosage compensation. However, recent results suggest that at least some Lepidoptera (moths and butterflies) may prove to be an exception to this prediction. Studies in bombycoid moths indicate the presence of a chromosome-wide epigenetic mechanism that effectively balances Z chromosome gene expression between the sexes by reducing Z-linked expression in males. In contrast, strong sex chromosome dosage effects without any reduction in male Z-linked expression were previously reported in a pyralid moth, suggesting a lack of any such dosage compensating mechanism. Here we report an analysis of sex chromosome dosage compensation in Heliconius butterflies, sampling multiple individuals for several different adult tissues (head, abdomen, leg, mouth, and antennae). Methodologically, we introduce a novel application of linear mixed-effects models to assess dosage compensation, offering a unified statistical framework that can estimate effects specific to chromosome, to sex, and their interactions (i.e., a dosage effect). Our results show substantially reduced Z-linked expression relative to autosomes in both sexes, as previously observed in bombycoid moths. This observation is consistent with an increasing body of evidence that some lepidopteran species possess an epigenetic dosage compensating mechanism that reduces Z chromosome expression in males to levels comparable with females. However, this mechanism appears to be imperfect in Heliconius, resulting in a modest dosage effect that produces an average 5–20% increase in male expression relative to females on the Z chromosome, depending on the tissue. Thus our results in Heliconius reflect a mixture of previous patterns reported for Lepidoptera. In Heliconius, a moderate pattern of incomplete dosage compensation persists apparently despite the presence of an epigenetic dosage compensating mechanism. The chromosomal distributions of sex-biased genes show an excess of male-biased and a dearth of female-biased genes on the Z chromosome relative to autosomes, consistent with predictions of sexually antagonistic evolution.
Keywords: Lepidoptera, Heliconius, dosage compensation, sex chromosomes, butterfly
Introduction
Dosage compensation is a gene-regulatory mechanism that equalizes levels of gene expression in response to differences in gene dose (i.e., copy number). Without dosage compensation, changes in gene dose can substantially affect gene expression, potentially resulting in detrimental effects on finely tuned gene networks (Birchler et al. 2001). For this reason, it was long assumed that the evolution of a chromosome-wide dosage compensating mechanism was an essential step in the evolution of heteromorphic sex chromosomes (Vicoso and Bachtrog 2009; Disteche 2012; Mank 2013).
Heteromorphic sex chromosomes typically evolve from homologous autosomes that acquire a sex-determining locus, accumulate sexually antagonistic alleles, and suppress recombination (Charlesworth 1996; Charlesworth B and Charlesworth D 2000; Bachtrog 2006). Eventually, substantial gene loss and degeneration occurs on the nascent Y chromosome (or W in female-heterogametic ZW taxa) (Rice 1984; B Charlesworth B and Charlesworth D 2000; Bachtrog 2013). The erosion of genes from the Y/W presents the problem of balancing gene expression with the autosomes. Monosomy of the X/Z in one sex means the dose (i.e., copy number) of most sex-linked genes differs by half between the sexes. If the resulting sex-linked gene expression becomes similarly unbalanced, degradation of the Y/W could impose a substantial fitness cost for the heterogametic sex due to impaired dosage-sensitive interactions with autosomal loci (Ohno 1967; Mank 2009; Pessia et al. 2013). It is thus predicted that a global dosage-compensating mechanism should evolve to balance the expression of X/Z loci relative to autosomes as the Y/W degrades (Ohno 1967; Charlesworth 1978; Mank 2013; Veitia et al. 2015). This process should also result, indirectly, in balanced gene expression between the sexes for the X/Z. One important working assumption in this framework is that average expression is approximately equal across autosomes, therefore “complete” dosage compensation should yield X:A (or Z:A) expression ratios of approximately 1 in both sexes (Nguyen and Disteche 2006; Mank 2009, 2013; Vicoso and Bachtrog 2011; Walters and Hardcastle 2011; Smith et al. 2014).
Efforts to evaluate this hypothesis have expanded greatly in the last decade with the application of genome-wide expression analyses via microarray or RNA-seq, and have yielded several unexpected results. The history and contemporary findings of research on sex chromosome dosage compensation are extensively reviewed in several recent publications (Disteche 2012; Mank 2013; Pessia et al. 2013; Ferrari et al. 2014). Here, we briefly highlight details particularly relevant to our current results. Where investigated during the pregenomic decades, the limited results obtained tended to support theoretical predictions. Initial genome-wide investigations using microarrays in established model organisms such as mouse, humans, fruit flies, and nematodes—all male heterogametic species—yielded patterns consistent with global sex chromosome dosage compensation. As predicted, average expression on the X was comparable to autosomes (X:A ∼ 1) in both sexes and the canonical view of dosage compensation and sex chromosome evolution appeared robust (Hamada 2005; Gupta et al. 2006; Nguyen and Disteche 2006). Moreover, the recognition that distinct molecular mechanism underlay dosage compensation in flies, worms, and humans added further support to the universality of dosage compensation evolving concomitantly with differentiated sex chromosomes (Deng et al. 2011; Straub and Becker 2011). However, more recent research has added substantial complexity and controversy to the issue. In particular, evaluating dosage compensation in the context of ancestral expression levels indicates that eutherian mammals should be considered to have X:A expression ratio of approximately 0.5 in both sexes (Julien et al. 2012; Lin et al. 2012). Importantly, in all of these cases, sex-linked expression appears to be balanced between males and females (male:female [M:F] ∼ 1 on the X) and there is no evidence of a gene dosage-effect on X chromosome expression.
Other striking exceptions to the canonical theory of dosage compensation were observed when investigations of sex chromosome dosage compensation expanded into novel taxa. Notably, several female-heterogametic taxa exhibit incomplete dosage compensation: Male birds, snakes, and schistosomes are homogametic (ZZ) with Z:A ∼ 1, but in females the Z:A ratio is significantly less than 1 (Itoh et al. 2007; Mank and Ellegren 2009; Naurin et al. 2011; Vicoso and Bachtrog 2011; Vicoso, Emerson, et al. 2013). The apparently dichotomous pattern of completely dosage compensated XY taxa versus incompletely compensated ZW species catalyzed strong suggestions and some nascent theory claiming that global, complete sex chromosome dosage compensation might be universally absent from ZW taxa and occur only XY species (Naurin et al. 2010; Bachtrog et al. 2011; Mank 2013; Vicoso, Emerson, et al. 2013). We call this the “heterogametic dichotomy hypothesis.”
Despite the emerging evidence supporting the heterogametic dichotomy hypothesis, there are also notable counter-examples. Among XY organisms, evidence is mounting that eutherian mammals lack X:A compensation (Julien et al. 2012; Lin et al. 2012; Chen and Zhang 2015). Also, there is at least one conspicuous female-heterogametic taxon that may prove to be an exception: Lepidoptera (moths and butterflies). The status of sex chromosome dosage compensation in Lepidoptera is currently ambiguous, primarily due to inconsistent results reported by the few studies currently available. The first genome-wide assessment of sex chromosome dosage compensation in Lepidoptera was based on a microarray data set in the silkmoth, Bombyx mori (Xia et al. 2007). An initial analysis of these data reported a strong Z chromosome dosage effect, compensation similar to other ZW taxa with incomplete dosage compensation (Zha et al. 2009). However, analytical flaws were later identified in this initial effort and a subsequent reanalysis indicated no Z dosage effect and a Z:A ratio that was equal in males and females, offering evidence for global, complete sex chromosome dosage compensation (Walters and Hardcastle 2011). Intriguingly, this reanalysis further revealed a Z:A ratio of approximately 0.7, significantly less than 1. This result is not anticipated by current theory concerning sex chromosome evolution. Additional evidence for complete sex chromosome dosage compensation in Lepidoptera was more recently reported in another bombycoid moth, Manduca sexta (tobacco hormworm), using RNA-seq (Smith et al. 2014). Again the Z:A ratio was equal between sexes, but in this case the Z:A ratio was only marginally less than 1, with significance depending on filtering thresholds. In stark contrast to results from Bombycoid moths, RNA-seq analysis of the Pyralid moth Plodia interpunctella (Indian meal moth) showed no evidence for dosage compensation, with female Z:A ∼ 0.5 whereas male Z:A was ∼ 1 (Harrison et al. 2012). This is the largest magnitude of sex chromosome dosage effect yet reported, exceeding patterns observed in birds and snakes (Itoh et al. 2007; Mank and Ellegren 2009; Naurin et al. 2011; Vicoso and Bachtrog 2011; Vicoso, Emerson, et al. 2013).
These studies differed considerably in what tissues or body parts were assayed. The B. mori microarray data included samples from ten different larval body parts (Xia et al. 2007; Walters and Hardcastle 2011). The M. sexta study sampled only adult heads while pools of whole adult P. interpunctella were used (Harrison et al. 2012; Smith et al. 2014). These latter two studies both constructed de novo transcriptome assemblies and assigned chromosomal linkage based on contig homology to B. mori. This approach of assigning Z-linkage is seemingly robust because synteny is highly conserved in Lepidoptera (Pringle et al. 2007; Heliconius Genome Consortium 2012; Yue et al. 2013; Ahola et al. 2014).
However, only the B. mori data set, which included isolated gonads, provided any opportunity to assess patterns of dosage compensation separately in somatic and reproductive tissues. It is well-established that, at least in B. mori, the Z chromosome is enriched for highly expressed, testes-specific genes but depleted of ovary-specific transcripts (Arunkumar et al. 2009; Suetsugu et al. 2013). Thus, inclusion of gonadal tissue may substantially skew patterns of Z:A ratios to appear “uncompensated” even when somatic Z:A ratios are otherwise comparable between the sexes (Walters and Hardcastle 2011).
In this manuscript, we report the first genomic analysis of sex chromosome dosage compensation in a butterfly. Using RNA-seq, we assay male and female gene expression in several body parts of Heliconius melpomene and its closely related sibling species, Heliconius cydno (Quek et al. 2010; Martin et al. 2013). The existence of a complete reference genome and linkage map for H. melpomene facilitates a nuanced inference of chromosome and sex-specific effects on gene expression, which we achieve through the novel application of mixed-effects linear models to analyze dosage compensation (Heliconius Genome Consortium 2012). Our results show substantially reduced Z-linked expression relative to autosomes in both sexes, but also modest dosage effect on the Z chromosome, and thus reflect a mixture of previous patterns reported for Lepidoptera.
Materials and Methods
Samples and Sequencing
Two groups of RNA-seq data were used to estimate gene expression. First, we used the paired-end data sequenced from H. melpomene generated by Briscoe et al. (2013) ArrayExpress ID: E-TAB-1500. This data set includes three male and three female samples from mouth, leg, and antennae. Additionally, we generated new RNA-seq data from adult head (excluding antennae) and abdomen (complete, including testes, ovaries, and other sex-specific somatic reproductive tissues). For these samples, Heliconius butterflies were reared in large insectaries in Gamboa, Panama. Insectary populations were recently established from local natural populations. Males and females were kept separate after eclosion and aged 6 days before collection to allow reproductive tissues to develop (Dunlap-Pianka et al. 1977); all samples were virgins. Head and abdomen tissues were collected into RNAlater and stored frozen before RNA purification. Total RNA was extracted with TRIzol reagent (Invitrogen, Carlsbad, CA), purified using RNeasy columns (Qiagen, Valencia, CA), and treated with TURBO DNase (Life Technologies, Grand Island, NY) following manufacturer’s instructions. Messenger RNA was isolated from total RNA via poly-A pulldown and subsequently transformed into a cDNA library using the Illumina TruSeq sample preparation kits. Paired-end 100 bp sequencing was performed on an Illumina HiSeq.
Read Mapping and Normalization
Read mapping and estimation of fragment counts per gene were performed using RSEM (v1.2.11) running Bowtie2 (v2.1.0) (Li and Dewey 2011; Langmead and Salzberg 2012). Reads were mapped as paired-end data, with the first 9 bp and the final 40 bp trimmed before mapping to remove low and variable-quality bases. All subsequent statistical analyses were performed using R and BioConductor, especially the baySeq package for assessing differential expression (Hardcastle and Kelly 2010; R Development Core Team 2014). The library scaling factors were calculated as the sum of nonzero gene expression levels below the 75th percentile of gene expression, following the example of Hardcastle et al. (2012) as an amendment to Bullard et al. (2010). As there is potential for substantial Z chromosome effects on gene expression, only known autosomal loci were considered when calculating library scaling factors. For nonparametric statistical analyses, we further normalized expression levels as fragments per kilobase per million mapped reads (FPKM).
Failing to remove transcriptionally inactive genes from RNA-seq data sets assayed for sex chromosome dosage compensation can result in problematic biases, yet the most appropriate filtering method to apply is not well-established (Xiong et al. 2010; Kharchenko et al. 2011; Jue et al. 2013; Smith et al. 2014). Here, we employ a probabilistic approach to assessing whether a given locus is expressed. The baySeq framework calculates the posterior likelihood (ranging from 0 to 1) that a given locus has no true expression. (i.e., any observed reads should be considered “noise,” not signal) (Hardcastle 2014). We primarily report results filtered at a likelihood of 50%, but results are comparable across a range thresholds tested, from 25% to 90% (see, Supplementary Material online).
Assessing Z Chromosome and Dosage Effects: Nonparametric Statistics
To test for Z chromosome dosage effects, we compared the expression of Z-linked and autosomal loci in males and females. Greater than 80% of predicted coding loci have been mapped to the 21 chromosomes of H. melpomene (Heliconius Genome Consortium 2012), with Z-linkage validated or corrected based on sex-specific genome sequencing coverage as reported in Martin et al. (2013). For each body part sampled, replicates were averaged by sex to give mean male and female FPKM values for each locus. Within each sex, Z-linked versus autosomal (Z:A) expression was compared, with differences in median expression evaluated via Mann–Whitey U test (MWU). The median M:F expression ratio of Z-linked versus autosomal loci was also compared via MWU. Only loci actively expressed in both sexes were included when analyzing M:F ratios.
We further explored the effects of Z chromosome dosage by comparing the average expression of Z-linked genes in males and females, split by quartiles of expression magnitude. Within quartile, differences between sex in median Z-linked expression were tested via MWU. Only loci actively expressed in both sexes were included in this analysis. This analysis closely resembles an analysis performed by Harrison et al. (2012) aimed at assessing how Z chromosome dosage effects depend on expression magnitude. However, we have slightly modified the analysis to avoid a bias we believe is inherent in the analysis as originally performed by Harrison et al. (2012). Rather than basing expression quartiles solely on male expression as was previously done, we calculated quartiles based on the maximum of male or female expression for each locus. The reasoning for this modification and the potential biases arising from ranking genes using data from only one sex is provided in the Appendix.
Assessing Sex Chromosome and Dosage Effects: Linear Modeling of Expression Levels
In addition to the application of nonparametric MWU tests, as is typically employed for investigations of sex chromosome dosage compensation, we implemented a linear modeling framework to test for dosage and Z-specific effects on gene expression.
The count data (after filtering) were fitted via maximum likelihood methods (Bates et al. 2014) to a generalized linear mixed-effects model. In common with other analyses of count data from high-throughput sequencing, we assumed a Poisson distribution of counts due to technical variation in sequencing. We further assumed that biological effects would primarily act on the rate of transcription and thus applied a log linkage function. Library scaling factor and gene lengths were used as offsets for this model, since higher counts will be observed both in more deeply sequenced libraries, and in longer genes (Mortazavi et al. 2008). To account for biological variation between replicates, a per gene random effect was applied over sex, simultaneously allowing for variation in individual gene expression and differential expression of genes between the sexes. We fit a series of models using various effects of chromosome, Z-linkage and sex, together with relevant interactions between these effects.
Using this modeling framework, we first tested for a global effect of Z-linkage on expression by comparing a model with both “sex” and “Zlinkage” as fixed effects (but no interaction)
versus a model with “sex” as the sole fixed effect.
We then additionally tested for sex-specific effect on Z-expression (i.e., a dosage effect), by fitting the full model
to one without the interaction term.
Chromosomal Distribution of Sex-Biased Genes
Genes differentially expressed between males and females were identified using baySeq (Hardcastle and Kelly 2010). We applied a false-discovery rate of 0.05 and required at least a 1.5-fold change in expression between sexes. This analysis excluded genes lacking evidence of expression in either sex, but included genes expressed in only one sex. The negative binomial model applied here to read-count data readily accommodates loci with reads from only one sex. Thus loci with “sex-specific” expression were included as sex-biased in this analysis. To examine the chromosomal distribution of sex-biased genes, we counted the number of male, female, and unbiased genes among all actively expressed genes on each chromosome and also the unmapped scaffolds not yet assigned to chromosome. Gene activity was based on the probabilistic criteria, and assessed independently in males and females, so a gene expressed in males but not females was counted as male biased (and vice versa). Differences between the Z and autosomes in proportion of sex-biased genes were tested using a Fisher’s exact test.
Results
Sequencing and Read Mapping
Data sets newly generated for this project were considerably larger that those generated by Briscoe et al. (2013). For the 40 samples sequenced here, the mean number of total reads sequenced was approximately 130 M, ranging from approximately 30 M to 284 M reads. The 18 samples from Briscoe et al. (2013) gave a mean of approximately 23 M, ranging from approximately 8 M to 46 M reads. The proportion of reads aligned with RSEM was also generally higher for the abdomen and head samples compared with the Briscoe et al. (2013) samples from antennae, mouth, and leg. The 40 abdomen and head samples yielded a mean of 49% aligned, ranging from 21% to 65%. Mean percent mapping in the 18 Briscoe et al. (2013) samples was 37%, ranging from 9% to 55%. A complete summary of read counts and alignment statistics calculated with Picard’s CollectAlignmentSummaryMetrics utility (http://broadinstitute.github.io/picard/, last accessed March 10, 2014) is provided in supplementary table S1, Supplementary Material online. Newly generated data sets for H. melpomene and H. cydno head and abdomen are available from GenBank BioProject PRJNA283415.
Z Chromosome to Autosome Comparisons
For both sexes, all body parts in both species yielded average Z expression significantly lower than autosomal expression, as is evident from both linear modeling and nonparametric analyses (fig. 1 and tables 1 and 2). Comparing median expression, the Z:A ratio ranged from about 0.5 to 0.75; ratios based on mean values are even lower. Linear modeling of these data showed Z-linkage had a significant negative effect on gene expression relative to autosomal average (table 2). Median expression of individual autosomes varied somewhat in both sexes, but in nearly all cases the median Z expression was lower than any autosome (supplementary fig. S1, Supplementary Material online).
Fig. 1.—
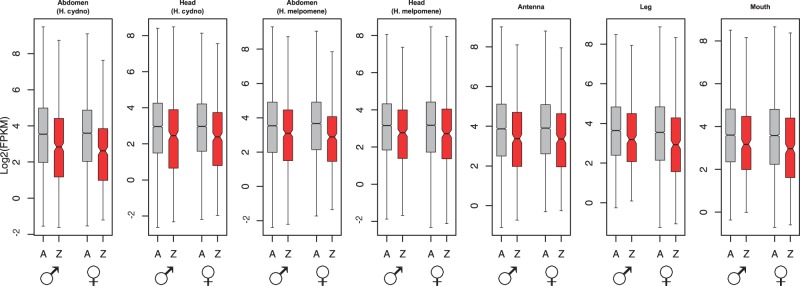
Distributions of log2-transformed gene expression levels (FPKM) for the Z chromosome (Z; red) and autosomes (A; gray) in male and female Heliconius butterflies in several tissues. Boxes indicate the interquartile range (IQR) around the median (black bar) and whiskers extend to 1.5 times the IQR; outlier points beyond 1.5 IQR are not shown. Nonparametric tests as well as linear modeling indicate a significant reduction in Z chromosome expression relative to autosomes in both sexes for all tissues (see tables 1 and 2). Data were filtered with a null expression likelihood of 0.5 and are representative of results using a range of likelihood thresholds (supplementary table S2, Supplementary Material online).
Table 1.
Summary of Average Expression of Z-Linked and Autosomal Loci across Several Tissues in Heliconius Butterflies
| Statistic | Abdomen (H. cydno) |
Head (H. cydno) |
Abdomen (H. melpomene) |
Head (H. melpomene) |
Antenna |
Leg |
Mouth |
|||||||
|---|---|---|---|---|---|---|---|---|---|---|---|---|---|---|
| Male | Female | Male | Female | Male | Female | Male | Female | Male | Female | Male | Female | Male | Female | |
| Mean Z-linked FPKM | 40.66 | 26.15 | 29.27 | 23.78 | 36.63 | 29.6 | 28.14 | 29.18 | 30.32 | 27.3 | 47.99 | 41.65 | 40.74 | 35.07 |
| Mean autosomal FPKM | 85.45 | 54.81 | 70.64 | 53.6 | 63.42 | 53.33 | 54.2 | 68.43 | 75.66 | 67.84 | 63.3 | 59.02 | 71.77 | 68.06 |
| Z:A ratio of mean expression | 0.4758 | 0.4771 | 0.4144 | 0.4437 | 0.5776 | 0.555 | 0.5192 | 0.4264 | 0.4007 | 0.4024 | 0.7581 | 0.7057 | 0.5676 | 0.5153 |
| Median Z-linked FPKM | 7.15 | 6.15 | 5.48 | 5.23 | 8.53 | 7.38 | 6.8 | 6.59 | 10.38 | 10.26 | 9.12 | 7.59 | 9.03 | 7.81 |
| Median autosomal FPKM | 11.67 | 12.12 | 7.78 | 7.82 | 11.6 | 12.71 | 8.93 | 9.03 | 14.65 | 14.93 | 12.43 | 11.69 | 12.13 | 11.96 |
| Z:A ratio of median expression | 0.6127 | 0.5074 | 0.7044 | 0.6688 | 0.7353 | 0.5806 | 0.7615 | 0.7298 | 0.7085 | 0.6872 | 0.7337 | 0.6493 | 0.7444 | 0.653 |
| MWU P value: autosomal ≠ Z-linked | <0.0001 | <0.0001 | <0.0001 | <0.0001 | <0.0001 | <0.0001 | 0.0007 | 0.0001 | <0.0001 | <0.0001 | 0.0003 | <0.0001 | 0.0002 | <0.0001 |
| No. expressed Z-linked loci | 481 | 403 | 443 | 429 | 506 | 417 | 449 | 447 | 392 | 394 | 357 | 385 | 361 | 390 |
| No. expressed autosomal loci | 10,638 | 9,758 | 10,272 | 10,050 | 11,020 | 10,014 | 10004 | 10383 | 9296 | 9318 | 8548 | 9239 | 8792 | 9243 |
Note.—Results reflect data filtering with a null expression likelihood of 0.5 and are representative of results using a range of likelihood thresholds (supplementary table S2, Supplementary Material online).
Table 2.
Linear Modeling Analysis of Z Chromosome and Dosage Effects on Gene Expression Levels across Several Tissues in Heliconius Butterflies
| Z-Linkage Only |
Z-Linkage by Sex Interaction (dosage effect) |
|||||
|---|---|---|---|---|---|---|
| Sample | Z-Linkage Effect Size | ANOVA P value | Z-Linkage Effect Size | Interaction (Dosage) Effect Size | ANOVA P Value | |
| Abdomen (H. cydno) | −0.56 | 2.16E-14 | −0.65878 | 0.212 | 2.57E-05 | |
| Head (H. cydno) | −0.431 | 3.02E-08 | −0.40678 | 0.0642 | 7.66E-08 | |
| Abdomen (H. melpomene) | −0.385 | 1.53E-07 | −0.47591 | 0.189 | 0.0001 | |
| Head (H. melpomene) | −0.263 | 0.00030 | −0.4581 | 0.289 | 6.90E-27 | |
| Antenna | −0.371 | 2.35E-07 | −0.37173 | 0.0307 | 0.224 | |
| Leg | −0.275 | 0.00047 | −0.36309 | 0.169 | 1.47E-14 | |
| Mouth | −0.340 | 6.72E-06 | −0.36206 | 0.0615 | 0.00227 | |
Note.—Results reflect data filtering with a null expression likelihood of 0.5 and are representative of results using a range of likelihood thresholds (supplementary table S3, Supplementary Material online).
Notably, in several body parts sampled, the Z:A ratio was slightly greater in males than in females (table 1). This apparent sex-effect on Z chromosome expression was statistically confirmed with linear modeling. All tissues except antennae showed a significant interaction between sex and Z-linked expression, with greater male Z-linked expression (table 2). This interaction can be interpreted as dosage effect of the Z chromosome on average gene expression. Note, however, that the magnitude of this interaction (dosage) effect is distinctly less than the effect of the Z chromosome on gene expression levels.
Male:Female Expression Ratios
Consistent with the dosage effect observed in the linear models, the Z chromosome showed a modest but consistent male bias in expression relative to autosomes in all samples (fig. 2 and table 3). The distribution of M:F expression ratios was significantly greater on the Z (MWU P < 0.05 after Bonferroni correction) in all samples except antennae. The average magnitude of this Z-linked male expression bias ranged from 5% to 20% relative to autosomes based on the median M:F expression ratios (table 2). We further explored the relationship between sex-biased gene expression (see below) and this gene dosage effect by reanalyzing the M:F ratios after removing 2,465 genes with significant differential expression in the abdomen of both H. melpomene and H. cydno. Excluding these genes did not qualitatively alter results; all tissues retained a significant and similarly sized male bias on the Z chromosome (supplementary table S5, Supplementary Material online).
Fig. 2.—
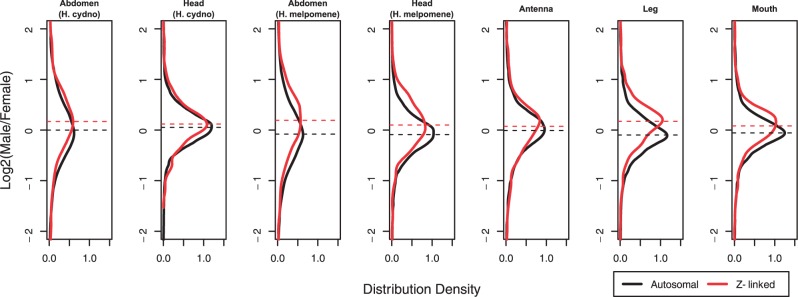
Distribution density plots of log2(M:F) expression ratios for the Z chromosome (Z; red) and autosomes (A; black) in male and female Heliconius butterflies in several tissues. Dashed lines indicate median values. Nonparametric tests and linear modeling indicate all tissues but antenna show a modest but significant sex chromosome dosage effect, visualized here as a shift toward male-biased expression among Z-linked loci (see tables 2 and 3). Antenna also shows this pattern but the effect is not statistically significant.
Table 3.
Summary of Average M:F Gene Expression Ratios for Z-Linked and Autosomal Loci in Heliconius Butterflies for Several Tissues
| Tissue | No. Z-Linked Loci | No. Autosomal Loci | Mean Z-Linked Log2(M:F) | Mean Autosomal Log2(M:F) | Median Z-Linked Log2(M:F) | Mean Autosomal Log2(M:F) | Z:A Ratio of Means (Not Log2) | Z:A Ratio of Medians (Not Log2) | MWU P Value: Autosomal ≠ Z-Linked |
|---|---|---|---|---|---|---|---|---|---|
| Abdomen (H. cydno) | 387 | 9,539 | 0.3553 | 0.1101 | 0.1683 | −0.0009 | 1.1853 | 1.1244 | <0.0001 |
| Head (H. cydno) | 425 | 9,972 | 0.1173 | 0.0584 | 0.116 | 0.0543 | 1.0417 | 1.0437 | 0.0034 |
| Abdomen (H. melpomene) | 408 | 9,859 | 0.2418 | 0.0106 | 0.1904 | −0.0788 | 1.1738 | 1.2051 | <0.0001 |
| Head (H. melpomene) | 433 | 9,909 | 0.0847 | −0.1372 | 0.1002 | −0.0904 | 1.1662 | 1.1412 | <0.0001 |
| Antenna | 378 | 8,957 | 0.0115 | −0.039 | 0.0731 | −0.009 | 1.0356 | 1.0586 | 0.021 |
| Leg | 354 | 8,457 | 0.1272 | −0.0912 | 0.1731 | −0.097 | 1.1634 | 1.2059 | <0.0001 |
| Mouth | 356 | 8,636 | 0.003 | −0.0741 | 0.0811 | −0.0561 | 1.0549 | 1.0997 | <0.0001 |
Note.—Results reflect data filtering with a null expression likelihood of 0.5 and are representative of results using a range of likelihood thresholds (supplementary table S4, Supplementary Material online).
Quartile Analysis of Z Expression
Comparing Z-linked expression between sexes split by quartiles of expression showed no obvious pattern of discrepancy in male versus female Z-linked expression for tissues other than abdomen (fig. 3; supplementary fig. S2, Supplementary Material online). In both abdomen samples, which include gonads, male expression was significantly greater than female in the fourth (highest expression) quartile, using Bonferroni multiple testing correction for four tests.
Fig. 3.—

Comparison of male (blue) and female (red) expression levels for Z-linked loci, divided into quartiles based on the maximum of male or female expression for H. melpomene head and abdomen. Boxes indicate the interquartile range (IQR) around the median (black bar) and whiskers extend to 1.5 times the IQR. An asterisk (*) indicates significant difference in average expression (Bonferroni corrected MWU P value < 0.05). Plots for all seven tissue samples are given in supplementary figure S2, Supplementary Material online.
Chromosomal Distribution of Sex-Biased Genes
The amount of sex-biased gene expression differed substantially between body parts. Tissues other than in the abdomen showed almost no differential expression between sexes using the criteria we applied (table 4). In contrast, roughly 30% of active genes in abdomen, which include gonads and other sex-specific reproductive tissues, were differentially expressed. We therefore analyzed the chromosomal distribution of sex-biased genes only in the abdomen. We observed a significant difference in the proportions of sex-biased genes on the Z versus the autosomes in both H. melpomene and H. cydno (Fisher’s exact test, P value ≪ 0.001). Figure 4 shows that the Z chromosome is distinctly enriched for male-biased and has a paucity of female-biased genes.
Table 4.
Counts of Sex-Biased and Unbiased Genes (FDR < 0.05 and a Minimum fold-change of 1.5) on the Z Chromosome and Autosomes (A) in Several Tissues of Heliconius Butterflies
| Expression Category | Abdomen (H. cydno) |
Head (H. cydno) |
Abdomen (H. melpomene) |
Head (H. melpomene) |
Antenna |
Leg |
Mouth |
|||||||
|---|---|---|---|---|---|---|---|---|---|---|---|---|---|---|
| Z | A | Z | A | Z | A | Z | A | Z | A | Z | A | Z | A | |
| Male bias | 114 | 1,470 | 3 | 7 | 130 | 1,590 | 0 | 0 | 0 | 0 | 0 | 0 | 0 | 0 |
| Unbiased | 275 | 7,008 | 385 | 9,389 | 290 | 6,888 | 394 | 9,354 | 319 | 8,167 | 301 | 7,717 | 295 | 7,715 |
| Female bias | 48 | 1,540 | 0 | 8 | 58 | 2,025 | 0 | 3 | 0 | 3 | 0 | 0 | 0 | 0 |
Fig. 4.—

Proportions of sex-biased genes across the chromosomes in abdomens for H. cydno and H. melpomene. A gene was considered sex-biased if significantly differentially expressed between males and females with FDR < 0.05 and a minimum fold-change of 1.5. The two larger bars at the bottom represent the Z chromosome individually and the combined results across autosomes (A). Smaller bars (1–20) represent data for individual chromosomes and “UM” indicates genes not mapped to chromosome.
Discussion
Dosage Compensation
Patterns of sex chromosome dosage compensation in Heliconius butterflies reflect an interesting amalgam of previous results from Lepidoptera. Similarly to the bombycoid moths B. mori and M. sexta, Heliconius males show reduced expression of Z chromosome genes below autosomal expression levels (Walters and Hardcastle 2011; Smith et al. 2014). In the two bombycoid species, male Z expression was low enough to be comparable to the female Z; there was no detectable dosage effect on Z-linked expression. Yet despite having Z:A < 1 in both sexes, Heliconius shows a dosage effect such that the Z chromosome retains a modest but consistent male-bias in expression. This result in Heliconius echoes the very substantial dosage effects reported for P. interpunctella. Unfortunately, the magnitude of these Heliconius dosage effects cannot easily be contrasted with P. interpunctella because direct M:F expression ratios were not reported for that species (Harrison et al. 2012). However, the discrepancy in Z:A ratios between sexes of P. interpunctella is so large that we presume the dosage effects reflected in M:F expression ratios are far greater than we observe in Heliconius. Notably, no reduction in male Z-linked expression relative to autosomes was reported for P. interpuctella.
Thus in Heliconius we have further evidence that some Lepidoptera appear to have a molecular mechanism for globally reducing Z-linked expression in males that compensates for the difference in Z chromosome dosage between sexes. Curiously, in Heliconius this mechanism appears to be operating imperfectly, resulting in a measurable dosage effect that could arguably be called “incomplete” dosage compensation. However, the 5–20% Z-linked male bias in Heliconius is distinctly less than approximately 50% bias typically reported for vertebrate ZW species (e.g., snakes and birds) identified as having incomplete sex chromosome dosage compensation (Ellegren et al. 2007; Itoh et al. 2010; Vicoso, Emerson, et al. 2013). In the case of the female-heterogametic vertebrates, it is assumed that dosage compensation is incomplete because no global epigenetic mechanism exists to offset dosage effects, in contrast to the epigenetic mechanisms known in fruit flies, nematodes, and mammals. In the case of Heliconius, we would argue that incomplete dosage compensation occurs despite a global mechanism operating to balance Z:A ratios between the sexes, in this case reducing male Z-linked expression similar to that in females.
Further evidence that a global mechanism mitigates dosage effects in Heliconius comes from the lack of detectable transcriptional saturation on the Z chromosome. None of the purely somatic tissues sampled showed an effect of expression magnitude on differences between male and female Z-linked expression. This result contrasts with P. interpunctella, where the male expression bias increased with expression level, suggesting substantial transcriptional saturation due to uncompensated Z chromosome dosage. However, in abdomens we did observe significantly greater expression in males for the highest expression quartile, reminiscent of the P. interpunctella result. Although this could be regarded as the effect of transcriptional saturation due to gene imbalance (i.e., a dosage effect), we tend to think it primarily reflects the unusually high expression levels of male-biased reproductive genes in the testes. If male-biased genes tend to have very high expression, this could produce the pattern observed. Robustly testing this hypothesis would require sequencing transcriptomes of gonads separately from somatic tissue; such data are currently not available in Heliconius. However, we note that in male abdomens, autosomal male-biased genes are expressed at significantly greater levels on average than unbiased or female-biased genes (Kruskal–Wallis test, P ≪ 0.001; supplementary fig. S3, Supplementary Material online). In female abdomen, median expression of autosomal sex-biased genes does not differ from unbiased genes (Kruskal–Wallis test, N.S.). These patterns are consistent with our hypothesis of highly expressed testes genes generating a pattern of male overexpression in the top quartile. Furthermore, this pattern would be exacerbated on the Z chromosome due to the overrepresentation of male-biased genes on the Z, as observed here (see below) and also reported in B. mori (Arunkumar et al. 2009; Walters and Hardcastle 2011).
Finally, we note there is additional experimental evidence for a global sex chromosome dosage mechanism that downregulates male Z expression, at least in B. mori. Kiuchi et al (2014) recently reported the characterization of a Z-linked masculinizing zinc-finger protein that plays a fundamental role in B. mori sex determination. RNAi disruption of this masc protein does not much alter autosomal expression, but causes chromosome-wide upregulation of Z-linked expression. Thus masc apparently controls a switch that initiates a global epigenetic reduction in Z-linked male expression. (The presence of a masc ortholog in H. melpomene is ambiguous. A translated BLAST search in the H. melpomene genome using the B. mori masc protein identified three proteins with e values ranging from 10−20 to 10−7. The first two hits are autosomal, whereas the third and weakest hit is to a Z-linked scaffold with 31% identity over only the 100 amino acids zinc-finger motif; masc is 588 amino acids. However, PROmer alignments of the relevant B. mori and H. melpomene scaffolds revealed no other homology [i.e., synteny] between these genomic locations. Thus if this represents a Heliconius masc ortholog, it has diverged substantially in sequence and genomic location.)
What does this current set of results from Lepidoptera mean for the heterogametic dichotomy hypothesis? These different lines of evidence pointing to a global sex chromosome dosage compensation mechanism in several lepidopteran species undermine the simple notion that female heterogametic taxa do not evolve such mechanisms. However, there is ample room for nuance here. First, despite emerging support for Lepidoptera as an exception, there is still substantial evidence that global dosage compensation is much less common in ZW than XY taxa (Mank 2013). Thus, while seemingly not a universal rule, the heterogametic dichotomy hypothesis still reflects a compelling and unexplained trend in sex chromosome evolution.
Second, results presented here from Heliconius suggest there is a need to separately consider observed patterns, proximate mechanism, and evolutionary process. In most cases, reporting that a species shows a pattern of incomplete dosage compensation has been assumed to indicate the organism lacks a global mechanism to mitigate sex chromosome dosage differences between sexes. We now observe that Heliconius butterflies appear to break this assumption. Heliconius seems to share a mechanism with bombycoid moths that reduces male Z-linked expression in order to balance Z:A expression between sexes (Walters and Hardcastle 2011; Kiuchi et al. 2014; Smith et al. 2014). In bombycoids this balancing is “perfect,” resulting in complete sex chromosome dosage compensation with no male bias in Z-linked M:F expression ratios. Yet Heliconius shows a pattern of incomplete dosage compensation despite apparently deploying a mechanism of downregulating the male Z. This result defies a simple characterization as being consistent, or not, with the heterogametic dichotomy hypothesis. On the one hand, opposing the hypothesis, Heliconius butterflies apparently have a global mechanism of dosage compensation. On the other hand, supporting the hypothesis, dosage effects persist and compensation is incomplete. A similar scenario was recently reported for the neo-X of D. pseudoobscura, where the well-characterized dosage-compensation complex appears in some tissues and developmental stages to be “incompletely” compensating male neo-X expression to an X:A ratio approximately 0.85, much greater than 0.5 expected without compensation but still short of X:A ∼ 1 complete compensation observed in other Drosophila species and the ancestral portion of the Drosophila pseudoobscura X (Nozawa et al. 2014). The functional and evolutionary significance of a lingering dosage effect in the presence of a global compensating mechanism is certainly a promising area for future research addressing the evolution of sex chromosome dosage compensation, especially the heterogametic dichotomy hypothesis.
A reasonable argument can be made that reducing Z-linked expression in males to balance Z:A expression in females cannot legitimately be considered sex chromosome dosage compensation, sensu stricto. The canonical evolutionary model of dosage compensation invokes stabilizing selection to maintain ancestral expression levels of sex-linked genes in the heterogametic sex as gametologs erode from the W (or Y) (Ohno 1967; Charlesworth 1978; Mank 2009). This model assumes that substantial reduction in the Z:A ratio is deleterious. Following this theory, sex chromosome dosage compensation should be defined as dosage “conservation” retaining the ancestral expression patterns where Z:A ∼ 1. (This assumes all autosomes have roughly comparable average expression levels, a pattern that appears to be true in most species examined [Gupta et al. 2006; Deng et al. 2011; Lin et al. 2011; Walters and Hardcastle 2011; Vicoso, Emerson, et al. 2013; Vicoso, Kaiser, et al. 2013].)
Thus, following this narrow and canonical view, sex chromosome dosage compensation should be limited only to situations where the heterogametic sex has Z:A ∼ 1 (and, comparably, X:A ∼ 1). Notably, this would include cases where sexual antagonism of sex-linked expression presumably remains unresolved and results in hyperexpression of sex-linked genes (i.e., X:A > 1) in the homogametic sex (Prince et al. 2010; Mank et al. 2011; Allen et al. 2013). However, a mechanism that globally reduces Z-linked expression in males to balance Z:A expression in females, as appears to exist in Lepidoptera, is not consistent with canonical evolutionary theory regarding dosage compensation and sex chromosomes. Specifically, if Z:A < 1 in heterogametic females is problematic, why would similarly reducing Z:A expression ratios in homogametic males resolve this problem? Doing so would compensate sex chromosome expression relative to autosomes between sexes, but presumably without dosage conservation. These results from Lepidoptera present a conundrum in light of current evolutionary theory (Walters and Hardcastle 2011).
Some resolution to this conundrum may come from better understanding the evolutionary history of the lepidopteran Z chromosome. Substantial ambiguity currently exists around the evolutionary relationship between the Z and W chromosomes. Basal Lepidoptera and Trichoptera (caddisflies, the sister group to Lepidoptera) are female-heterogametic but completely lack a W chromosome; females are ZO (Lukhtanov 2000; Sahara et al. 2011). The W chromosome now shared by most “advanced” (ditrysian) Lepidoptera arose long after the split between Lepidotera and Trichoptera. One hypothetical origin of the W invokes a fusion between an autosome and the basal Z chromosome, with the remaining free autosome following the canonical evolutionary degradation into the W allosome shared by ditrysian species (Traut and Marec 1996). In this case, standard expectations of dosage compensation apply and the current observations of Z:A<1 in males remain theoretically inconsistent.
However, karyotypes of basal preditrysian and ditrysian species do not obviously indicate a lost autosome, a fact consistent with an alternative scenario that posits the W originating as a supernumerary B chromosome that acquired a sex-determining locus and meiotic pseudobivalence with the Z (Lukhtanov 2000). In this latter scenario, origins of the Z chromosome are quite ancient, likely involve the transition to female-heterogamety, and existing theory offers few expectations about how sex chromosomes and dosage effects might evolve.
The available data indicate substantial variation among lepidopteran lineages in patterns of sex chromosome dosage compensation. Considered in light of the most recent lepidopteran phylogenies (Regier et al. 2013; Kawahara and Breinholt 2014), the patterns appear to reflect at least two evolutionary transitions in dosage compensation (table 5). Two possible histories could explain these patterns. Either a similar dosage compensating mechanism evolved independently in butterflies and the ancestor of bombycoids, or an incomplete dosage compensating mechanism present in butterflies was refined to completeness in bombycoids but lost in pyralids.
Table 5.
Summary of Observed Patterns of Sex Chromosome Dosage Compensation in the Lepidoptera
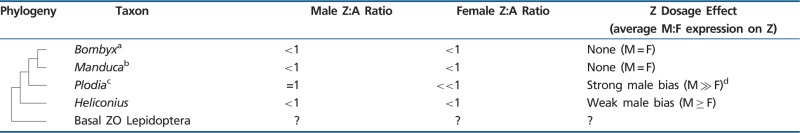 |
aWalters and Hardcastle (2011).
bSmith et al. (2014).
cHarrison et al. (2012).
dNot directly reported, but assumed based on sex-specific Z:A ratios.
Regardless of how dosage compensation has evolved among moths and butterflies, there are some intriguing similarities between the patterns seen among Lepidoptera and the emerging understanding of sex chromosome dosage compensation—or the lack thereof—in mammals. Although still controversial, there is a growing consensus the mammalian X evolved without dosage compensation and, in light of inferred ancestral expression levels on the X, the mammalian X:A ratio is approximately 0.5 in both sexes (Julien et al. 2012; Lin et al. 2012; Pessia et al. 2013; Chen and Zhang 2015). This view means that mammalian X chromosome inactivation effectively balances X-linked expression between sexes by halving the potential dose in females. A similar pattern was also recently reported in twisted-wing insects (Strepsiptera) (Mahajan and Bachtrog 2015). This scenario appears analogous to Lepidoptera, where Z-linked expression is similarly balanced between sexes by an apparent global reduction in expression in the homogametic sex. Investigation into the functional mechanisms of lepidopteran dosage compensation might help to resolve the origins of this mechanism. At this point it seems possible that Lepidoptera, Strepsiptera, and mammals have converged on similar mechanisms of mitigating sex chromosome dosage differences between the sexes.
Chromosomal Distribution of Sex-Biased Genes
The general lack of sex-biased genes in purely somatic, nonreproductive tissue in Heliconius is unusual. There is good precedent from many other animals, particularly fruit flies and mice, that such tissues should contain at least dozens if not hundreds of genes with sex-biased expression (Yang et al. 2006; Catalán et al. 2012; Meisel et al. 2012). Even among other Lepidoptera such tissues yield numerous sex-biased genes (Walters and Hardcastle 2011; Smith et al. 2014). Thus it is tempting to explain away this result through a lack of statistical power or other methodological artifacts. Yet this seems unlikely because abdomens yielded thousands of differentially expressed loci. Heads and abdomens in this study were from the same individuals, with RNA extracted and analyzed simultaneously in parallel. Furthermore, the mouth, leg, and antennae data were generated independently of the head and abdomen samples but yielded a similar paucity of sex-biased genes. So it may simply be that Heliconius butterflies have unusually monomorphic patterns of gene expression between sexes for tissues unrelated to reproduction. Certainly phenotypic sexual dimorphism is quite limited in Heliconius compared with most moths and many butterflies (Walters JR and Jiggins CD personal observations). Thus the lack of sexual dimorphism in expression in Heliconius seemingly reflects minimal dimorphism in adult phenotype. A correlation between expression and phenotypic dimorphism, linked to intensity of sexual selection, was recently reported in galliform birds (Harrison et al. 2015). These observations in Heliconius are consistent with this pattern also occurring in Lepidoptera, though observations from many more species are required to robustly assess this.
In contrast to nonreproductive tissues, the abdomens yielded a very large number of genes with significantly dimorphic expression. The distribution of such sex-biased genes is clearly different between the Z and autosomes, with male-biased genes more abundant and female-biased genes less abundant on the Z relative to autosomes, which have approximately equal amounts of male- and female-biased genes (fig. 4). A positive association between sex-linkage and expression biased toward the homogametic sex has been widely observed in several species of both male and female heterogametic taxa, including Lepidoptera (Reinke et al. 2000; Khil et al. 2004; Kaiser and Ellegren 2006; Arunkumar et al. 2009; Walters and Hardcastle 2011; Meisel et al. 2012). This pattern is generally predicted by models of sexually antagonistic evolution, specifically when sexually antagonistic mutations are fully or partially dominant (Rice 1984; Ellegren and Parsch 2007; Connallon and Clark 2010). Thus our results offer further support for the theory that the asymmetrical transmission of sex chromosomes favors sex-linked accumulation of mutations benefitting the homogametic sex.
A deficit of genes biased toward the heterogametic sex is also predicted by the same theory, but observations are much less consistent across taxa and seem to depend on a range biological idiosyncrasies including meiotic sex chromosome inactivation, tissue specificity of expression, and mechanisms of dosage compensation (Connallon and Clark 2010; Meisel et al. 2012; Parsch and Ellegren 2013). Nonetheless, there is at least one promising coincidence of theory and data that has been recently noted: species with equal rates of recombination between sexes tend to show an excess of sex-linked genes with heterogametic bias (e.g., birds and mammals), while in Drosophila, where males do not recombine, a paucity of male-biased genes on the X is often reported (Connallon and Clark 2010). Since lepidopteran females lack recombination, the paucity of female-biased genes on the Z in Heliconius is consistent with this pattern.
Conclusion
Our results are consistent with an increasing body of evidence that many species of moths and butterflies possess a sex chromosome dosage compensating mechanism that operates by reducing Z chromosome expression in males. However, this mechanism appears to be imperfect in Heliconius, resulting in a moderate Z chromosome dosage effect. These results counter the emerging view that female-heterogametic ZW taxa have incomplete dosage compensation because they lack a chromosome-wide epigenetic mechanism mediating sex chromosome dosage compensation. In the case of Heliconius, sex chromosome dosage effects apparently persist despite such a mechanism. This result adds additional complexity to patterns of dosage compensation observed in Lepidoptera. Finally, patterns of sex-biased expression in our data highlight the impact of sexually antagonistic selection in shaping genome evolution.
Supplementary Material
Supplementary figures S1–S3 and table S1–S5 are available at Genome Biology and Evolution online (http://www.gbe.oxfordjournals.org/).
Acknowledgments
This research was supported in part by a NSF postdoctoral fellowship to J.R.W. (DBI-0905698). RNA sequencing was funded by the “Capacity and Capability Challenge Program” from The Genome Analysis Centre, Norwich, UK. The computing for this project was performed on the Community Cluster at the Center for Research Computing at the University of Kansas. Luiqi (Aloy) Gu provided valuable comments on the manuscript.
Appendix: Analysis of Z-Linked Expression Quartiles between Male and Female
Harrison et al. (2012) analyzed patterns of sex chromosome dosage compensation in the Indian meal moth, Plodia interpunctella. One aspect of their analysis contrasted male and female expression of Z-linked loci split by quartiles of expression magnitude. This analysis is intended to illustrate that dosage effects increase with gene expression level. Importantly, Harrison et al. defined quartiles of expression based solely on male expression; female expression was ignored when binning loci into subsets to assess dosage effects. Here, we demonstrate that, in the context of RNA-seq data, their approach potentially leads to an artifactual bias that would result in expression appearing greater in males than females for highly expressed loci, as reported by Harrison et al. (2012).
We judge it unlikely that this bias can completely explain the patterns reported for P. interpunctella. Therefore we have not reanalyzed the data of Harrison et al. and we do not question their qualitative conclusions regarding the relationship between relative dosage effects and the magnitude of gene expression. Nonetheless, for the sake of future analyses of sex chromosome dosage compensation, we feel it worthwhile to describe what we believe to be a better method of anlaysis. We suggest that quartile binning based on the maximum of male or female expression at each locus provides a simple adjustment to the analysis that removes bias imposed by binning on data from only one sex.
This analysis tests whether dosage effects (i.e., greater Z-linked expression in males) increases with magnitude of gene expression. It is based on the idea that, for any given locus, the maximum level of gene expression is limited by the rate of translation because the translational machinery becomes saturated. In the absence of sex chromosome dosage compensation, highly expressed genes at or near the point of maximum translation will exhibit a strong dosage effect; the single female gene copy cannot reach the transcription rate of two copies in male. In contrast, genes expressed at low to intermediate levels will exhibit little or no dosage effect because sufficient transcripts can be generated from a single female copy to balance transcript levels in males. The resulting pattern is a discrepancy between male and female Z-linked expression that increases with the magnitude of gene expression.
In principle, it should be possible capture this effect by comparing the distributions of male and female expression of Z-linked genes that are expressed at relatively high or low absolute expression levels. Following the approach of Harrison et al., binning loci by quartiles of expression should reveal increasingly greater relative expression in males with each additional quartile if translational saturation effects are occurring in the absence of dosage compensation.
However, “it is in the grouping of loci into bins of relative expression levels where a bias may arise.” Binning based on expression in only one sex can cause expression in that sex to appear relatively reduced among weakly expressed genes, but relatively high for strongly expressed genes, even if the distribution of gene expression is identical for both sexes. Thus grouping loci by expression quartiles using values in only one sex can cause biases in which sex appears to have relatively greater expression in each quartile. This phenomenon is best demonstrated with a simple simulation in which the average expression of males and females is identical.
Described briefly, the simulation begins by generating “true” expression values for 10,000 loci as random draws from a log-normal distribution. Variation in expression levels for male and female “observations” are created by independently adding values drawn from a normal distribution with a mean of 0 to each true expression value. Additionally, 1,000 loci are further modified to be differentially expressed between males and females, 500 in each direction. For the sake of brevity and clarity, we refer the reader seeking further details to the supplementary R script (Supplementary Material online) encoding the simulation. The “MA-plot” of simulated gene expression data (fig. A1) should suffice to convince most readers that the simulated data reasonably represents gene expression data.
Fig. A1.—

MA-plot of simulated male and female expression data.
Using these simulated values, we can split the data set into quartiles of expression and compare the distributions between sexes (fig. A2). Intuitively, since all differences between male and female expression are random and unbiased, we would expect no systematic differences between sexes at any expression level. However, this outcome is only observed if quartiles are based on the maximum of male or female expression for each locus. Ranking using only one sex clearly results in a strongly biased outcome that depends on which sex is used for ranking (fig. A2).
Fig. A2.—

Quartile comparisons of simulated gene expression distributions of simulated male and female expression levels. Comparison of male (blue) and female (red) expression levels for loci, divided into quartiles based on male expression (left panel), female expression (center panel), and the maximum male or female expression (right panel). Boxes indicate the interquartile range (IQR) around the median (black bar) and whiskers extend to 1.5 times the IQR. P values of an MWU of inequality between males and females are printed for each quartile along the x axis, with “0” indicating P < 0.0001.
We emphasize that this simulation has been created primarily to illustrate our point about biases that potentially arise from quartile analyses based on ranking on one sex alone. We do not claim that the simulation is highly realistic and we have not extensively explored the effect of changing simulation parameters. Our narrow aim is to communicate an intuitive and straightforward demonstration of why we have deviated from the precedent set by Harrison et al. (2012) for this type of analysis.
Literature Cited
- Ahola V, et al. 2014. The Glanville fritillary genome retains an ancientkaryotype and reveals selective chromosomalfusions in Lepidoptera. Nat Commun. 5:1–9. [DOI] [PMC free article] [PubMed] [Google Scholar]
- Allen SL, Bonduriansky R, Chenoweth SF. 2013. The Genomic distribution of sex-biased genes in Drosophila serrata: X chromosome demasculinization, feminization, and hyperexpression in both sexes. Genome Biol Evol. 5:1986–1994. [DOI] [PMC free article] [PubMed] [Google Scholar]
- Arunkumar KP, Mita K, Nagaraju J. 2009. The silkworm Z chromosome is enriched in testis-specific genes. Genetics 182:493–501. [DOI] [PMC free article] [PubMed] [Google Scholar]
- Bachtrog D. 2006. A dynamic view of sex chromosome evolution. Curr Opin Genet Dev. 16:578–585. [DOI] [PubMed] [Google Scholar]
- Bachtrog D. 2013. Y-chromosome evolution: emerging insights into processesof Y-chromosome degeneration. Nat Rev Genet. 14:113–124. [DOI] [PMC free article] [PubMed] [Google Scholar]
- Bachtrog D, et al. 2011. Are all sex chromosomes created equal? Trends Genet. 27:350–357. [DOI] [PubMed] [Google Scholar]
- Bates D, Machler M, bolker B, Walker S. 2014. Fitting linear mixed-effects models using lme4. arXiv:1406.5823. [Google Scholar]
- Birchler JA, Bhadra U, Bhadra MP, Auger DL. 2001. Dosage-dependent gene regulation in multicellular eukaryotes: implications for dosage compensation, aneuploid syndromes, and quantitative traits. Dev Biol. 234:275–288. [DOI] [PubMed] [Google Scholar]
- Briscoe AD, et al. 2013. Female behaviour drives expression and evolution of gustatory receptors in butterflies. PLoS Genet. 9:e1003620. [DOI] [PMC free article] [PubMed] [Google Scholar]
- Bullard JH, Purdom E, Hansen KD, Dudoit S. 2010. Evaluation of statistical methods for normalization and differential expression in mRNA-Seq experiments. BMC Bioinformatics 11:94. [DOI] [PMC free article] [PubMed] [Google Scholar]
- Catalán A, Hutter S, Parsch J. 2012. Population and sex differences in Drosophila melanogaster brain gene expression. BMC Genomics 13:654. [DOI] [PMC free article] [PubMed] [Google Scholar]
- Charlesworth B. 1978. Model for evolution of Y chromosomes and dosage compensation. Proc Natl Acad Sci U S A. 75:5618–5622. [DOI] [PMC free article] [PubMed] [Google Scholar]
- Charlesworth B. 1996. The evolution of chromosomal sex determination and dosage compensation. Curr Biol. 6:149–162. [DOI] [PubMed] [Google Scholar]
- Charlesworth B, Charlesworth D. 2000. The degeneration of Y chromosomes. Philos Trans R Soc Lond B Biol Sci. 355:1563–1572. [DOI] [PMC free article] [PubMed] [Google Scholar]
- Chen X, Zhang J. 2015. No X-chromosome dosage compensation in human proteomes. Mol Biol Evol. 32:1456–1460. [DOI] [PMC free article] [PubMed] [Google Scholar]
- Connallon T, Clark AG. 2010. Sex linkage, sex-specific selection, and the role of recombination in the evolution of sexually dimorphic gene expression. Evolution 64:3417–3442. [DOI] [PMC free article] [PubMed] [Google Scholar]
- Deng X, et al. 2011. Evidence for compensatory upregulation of expressed X-linked genes in mammals, Caenorhabditis elegans and Drosophila melanogaster. Nat Genet. 43:1179–1185. [DOI] [PMC free article] [PubMed] [Google Scholar]
- Disteche CM. 2012. Dosage compensation of the sex chromosomes. Annu Rev Genet. 46:537–560. [DOI] [PMC free article] [PubMed] [Google Scholar]
- Dunlap-Pianka H, Boggs CL, Gilbert LE. 1977. Ovarian dynamics in heliconiine butterflies: programmed senescence versus eternal youth. Science 197:487–490. [DOI] [PubMed] [Google Scholar]
- Ellegren H, et al. 2007. Faced with inequality: chicken do not have a general dosage compensation of sex-linked genes. BMC Biol. 5:40. [DOI] [PMC free article] [PubMed] [Google Scholar]
- Ellegren H, Parsch J. 2007. The evolution of sex-biased genes and sex-biased gene expression. Nat Rev Genet. 8:689–698. [DOI] [PubMed] [Google Scholar]
- Ferrari F, Alekseyenko AA, Park PJ, Kuroda MI. 2014. Transcriptional control of a whole chromosome: emerging models for dosage compensation. Nat Struct Mol Biol. 21:118–125. [DOI] [PMC free article] [PubMed] [Google Scholar]
- Gupta V, et al. 2006. Global analysis of X-chromosome dosage compensation. J Biol. 5:3. [DOI] [PMC free article] [PubMed] [Google Scholar]
- Hamada FN. 2005. Global regulation of X chromosomal genes by the MSL complex in Drosophila melanogaster. Genes Dev. 9:2289–2294. [DOI] [PMC free article] [PubMed] [Google Scholar]
- Hardcastle TJ. 2014. Generalised empirical Bayesian methods for discovery of differential data in high-throughput biology. bioRxiv. [Google Scholar]
- Hardcastle TJ, Kelly KA. 2010. baySeq: empirical Bayesian methods for identifying differential expression in sequence count data. BMC Bioinformatics 11:422. [DOI] [PMC free article] [PubMed] [Google Scholar]
- Hardcastle TJ, Kelly KA, Baulcombe DC. 2012. Identifying small interfering RNA loci from high-throughput sequencing data. Bioinformatics 28:457–463. [DOI] [PubMed] [Google Scholar]
- Harrison PW, et al. 2015. Sexual selection drives evolution and rapid turnover of male gene expression. Proc Natl Acad Sci U S A. 112, 4393–4398. [DOI] [PMC free article] [PubMed] [Google Scholar]
- Harrison PW, Mank JE, Wedell N. 2012. Incomplete sex chromosome dosage compensation in the Indian meal moth, Plodia interpunctella, based on de novo transcriptome assembly. Genome Biol Evol. 4:1118–1126. [DOI] [PMC free article] [PubMed] [Google Scholar]
- Heliconius Genome Consortium. 2012. Butterfly genome reveals promiscuous exchange of mimicry adaptations among species. Nature 487:94–98. [DOI] [PMC free article] [PubMed] [Google Scholar]
- Itoh Y, et al. 2007. Dosage compensation is less effective in birds than in mammals. J Biol. 6:2. [DOI] [PMC free article] [PubMed] [Google Scholar]
- Itoh Y, et al. 2010. Sex bias and dosage compensation in the zebra finch versus chicken genomes: general and specialized patterns among birds. Genome Res. 20:512–518. [DOI] [PMC free article] [PubMed] [Google Scholar]
- Jue NK, et al. 2013. Determination of dosage compensation of themammalian X chromosome by RNA-seq is dependent on analytical approach. BMC Genomics 14:1–1. [DOI] [PMC free article] [PubMed] [Google Scholar]
- Julien P, et al. 2012. Mechanisms and evolutionary patterns of mammalian and avian dosage compensation. PLoS Biol. 10:e1001328. [DOI] [PMC free article] [PubMed] [Google Scholar]
- Kaiser VB, Ellegren H. 2006. Nonrandom distribution of genes with sex-biased expression in the chicken genome. Evolution 60:1945–1951. [PubMed] [Google Scholar]
- Kawahara AY, Breinholt JW. 2014. Phylogenomics provides strong evidence for relationships of butterflies and moths. Proc R Soc B Lond Biol Sci. 281:20140970–20140970. [DOI] [PMC free article] [PubMed] [Google Scholar]
- Kharchenko PV, Xi R, Park PJ. 2011. Correspondence. Nat Genet. 43:1167–1169. [DOI] [PubMed] [Google Scholar]
- Khil PP, Smirnova NA, Romanienko PJ, Camerini-Otero RD. 2004. The mouse X chromosome is enriched for sex-biased genes not subject to selection by meiotic sex chromosome inactivation. Nat Genet. 36:642–646. [DOI] [PubMed] [Google Scholar]
- Kiuchi T, et al. 2014. A single female-specific piRNA is the primary determiner of sex in the silkworm. Nature 509:633–636. [DOI] [PubMed] [Google Scholar]
- Langmead B, Salzberg SL. 2012. Fast gapped-read alignment with Bowtie 2. Nat Methods. 9:357–359. [DOI] [PMC free article] [PubMed] [Google Scholar]
- Li B, Dewey CN. 2011. RSEM: accurate transcript quantification from RNA-Seq data with or without a reference genome. BMC Bioinformatics 12:323. [DOI] [PMC free article] [PubMed] [Google Scholar]
- Lin F, Xing K, Zhang J, He X. 2012. Expression reduction in mammalian X chromosome evolution refutes Ohno's hypothesis of dosage compensation. Proc Natl Acad Sci U S A. 109:11752–11757. [DOI] [PMC free article] [PubMed] [Google Scholar]
- Lin H, et al. 2011. Relative overexpression of X-linked genes in mouse embryonic stem cells is consistent with Ohno's hypothesis. Nat Genet. 43:1169–1170. [DOI] [PubMed] [Google Scholar]
- Lukhtanov VA. 2000. Sex chromatin and sex chromosome systems in nonditrysian Lepidoptera (Insecta). J Zool Syst Evol Res. 38:73–79. [Google Scholar]
- Mahajan S, Bachtrog D. 2015. Partial dosage compensation in Strepsiptera, a sister group of beetles. Genome Biol Evol. 7:591–600. [DOI] [PMC free article] [PubMed] [Google Scholar]
- Mank JE. 2009. The W, X, Y and Z of sex-chromosome dosage compensation. Trends Genet. 25:226–233. [DOI] [PMC free article] [PubMed] [Google Scholar]
- Mank JE. 2013. Sex chromosome dosage compensation: definitely not for everyone. Trends Genet. 29677–683. [DOI] [PubMed] [Google Scholar]
- Mank JE, Ellegren H. 2009. All dosage compensation is local: gene-by-gene regulation of sex-biased expression on the chicken Z chromosome. Heredity 102:312–320. [DOI] [PubMed] [Google Scholar]
- Mank JE, Hosken DJ, Wedell N. 2011. Some inconvenient truths about sex chromosome dosage compensation and the potential role of sexual conflict. Evolution 65:2133–2144. [DOI] [PubMed] [Google Scholar]
- Martin SH, et al. 2013. Genome-wide evidence for speciation with gene flow in Heliconius butterflies. Genome Res. 23:1817–1828. [DOI] [PMC free article] [PubMed] [Google Scholar]
- Meisel RP, Malone JH, Clark AG. 2012. Disentangling the relationship between sex-biased gene expression and X-linkage. Genome Res. 22:1255–1265. [DOI] [PMC free article] [PubMed] [Google Scholar]
- Mortazavi A, Williams BA, McCue K, Schaeffer L, Wold B. 2008. Mapping and quantifying mammalian transcriptomes by RNA-Seq. Nat Methods. 5:621–628. [DOI] [PubMed] [Google Scholar]
- Naurin S, Hansson B, Bensch S, Hasselquist D. 2010. Why does dosage compensation differ between XY and ZW taxa? Trends Genet. 26:15–20. [DOI] [PubMed] [Google Scholar]
- Naurin S, Hansson B, Hasselquist D, Kim Y-H, Bensch S. 2011. The sex-biased brain: sexual dimorphism in gene expression in two species of songbirds. BMC Genomics 12:37. [DOI] [PMC free article] [PubMed] [Google Scholar]
- Nguyen DK, Disteche CM. 2006. Dosage compensation of the active X chromosome in mammals. Nat Genet. 38:47–53. [DOI] [PubMed] [Google Scholar]
- Nozawa M, Fukuda N, Ikeo K, Gojobori T. 2014. Tissue- and stage-dependent dosage compensation on the neo-X chromosome in Drosophila pseudoobscura. Mol Biol Evol. 31:614–624. [DOI] [PubMed] [Google Scholar]
- Ohno S. 1967. Sex chromosomes and sex-linked genes. Berlin: Springer-Verlag. [Google Scholar]
- Parsch J, Ellegren H. 2013. The evolutionary causes and consequences of sex-biased gene expression. Nat Rev Genet. 14:83–87. [DOI] [PubMed] [Google Scholar]
- Pessia E, Engelstädter J, Marais GAB. 2013. The evolution of X chromosome inactivation in mammals: the demise of Ohno’s hypothesis? Cell Mol Life Sci. 71:1383–1394. [DOI] [PMC free article] [PubMed] [Google Scholar]
- Prince EG, Kirkland D, Demuth JP. 2010. Hyperexpression of the X chromosome in both sexes results in extensive female bias of X-linked genes in the flour beetle. Genome Biol Evol. 2:336–346. [DOI] [PMC free article] [PubMed] [Google Scholar]
- Pringle EG, et al. 2007. Synteny and chromosome evolution in the Lepidoptera: evidence from mapping in Heliconius melpomene. Genetics 177:417–426. [DOI] [PMC free article] [PubMed] [Google Scholar]
- Quek SP, et al. 2010. Dissecting comimetic radiations in Heliconius reveals divergent histories of convergent butterflies. Proc Natl Acad Sci U S A. 107:7365–7370. [DOI] [PMC free article] [PubMed] [Google Scholar]
- R Development Core Team. 2014. R: a language and environment for statistical computing. Available from: http://www.R-project.org/. [Google Scholar]
- Regier JC, et al. 2013. A large-scale, higher-level, molecular phylogenetic study of the insect order Lepidoptera (moths and butterflies). PLoS One 8:e58568. [DOI] [PMC free article] [PubMed] [Google Scholar]
- Reinke V, et al. 2000. A global profile of germline gene expression in C. elegans . Mol Cell. 6:605–616. [DOI] [PubMed] [Google Scholar]
- Rice W. 1984. Sex chromosomes and the evolution of sexual dimorphism. Evolution 38:735–742. [DOI] [PubMed] [Google Scholar]
- Sahara K, Yoshido A, Traut W. 2011. Sex chromosome evolution in moths and butterflies. Chromosome Res. 20:83–94. [DOI] [PubMed] [Google Scholar]
- Smith G, Chen YR, Blissard GW, Briscoe AD. 2014. Complete dosage compensation and sex-biased gene expression in the moth Manduca sexta. Genome Biol Evol. 6:526–537. [DOI] [PMC free article] [PubMed] [Google Scholar]
- Straub T, Becker PB. 2011. Transcription modulation chromosome-wide: universal features and principles of dosage compensation in worms and flies. Curr Opin Genet Dev. 21:147–153. [DOI] [PubMed] [Google Scholar]
- Suetsugu Y, et al. 2013. Large scale full-length cDNA sequencing reveals a unique genomic landscape in a Lepidopteran model insect, Bombyx mori. G3 3:1481–1492. [DOI] [PMC free article] [PubMed] [Google Scholar]
- Traut W, Marec F. 1996. Sex chromatin in Lepidoptera. Q Rev Biol. 71:239–256. [DOI] [PubMed] [Google Scholar]
- Veitia RA, Veyrunes F, Bottani S, Birchler JA. 2015. X chromosome inactivation and active X upregulation in therian mammals: facts, questions, and hypotheses. J Mol Cell Biol. 7:2–11. [DOI] [PubMed] [Google Scholar]
- Vicoso B, Bachtrog D. 2009. Progress and prospects toward our understanding of the evolution of dosage compensation. Chromosome Res. 17:585–602. [DOI] [PMC free article] [PubMed] [Google Scholar]
- Vicoso B, Bachtrog D. 2011. Lack of global dosage compensation in Schistosoma mansoni, a female-heterogametic parasite. Genome Biol Evol. 3:230–235. [DOI] [PMC free article] [PubMed] [Google Scholar]
- Vicoso B, Emerson JJ, Zektser Y, Mahajan S, Bachtrog D. 2013. Comparative sex chromosome genomics in snakes: differentiation, evolutionary strata, and lack of global dosage compensation. PLoS Biol. 11:e1001643. [DOI] [PMC free article] [PubMed] [Google Scholar]
- Vicoso B, Kaiser VB, Bachtrog D. 2013. Sex-biased gene expression at homomorphic sex chromosomes in emus and its implication for sex chromosome evolution. Proc Natl Acad Sci U S A. 110:6453–6458. [DOI] [PMC free article] [PubMed] [Google Scholar]
- Walters JR, Hardcastle TJ. 2011. Getting a full dose? Reconsidering sex chromosome dosage compensation in the silkworm, Bombyx mori. Genome Biol Evol. 3:491–504. [DOI] [PMC free article] [PubMed] [Google Scholar]
- Xia Q, et al. 2007. Microarray-based gene expression profiles in multiple tissues of the domesticated silkworm, Bombyx mori. Genome Biol. 8:R162. [DOI] [PMC free article] [PubMed] [Google Scholar]
- Xiong Y, et al. 2010. RNA sequencing shows no dosage compensation of the active X-chromosome. Nat Genet. 42:1043–1047. [DOI] [PubMed] [Google Scholar]
- Yang X, et al. 2006. Tissue-specific expression and regulation of sexually dimorphic genes in mice. Genome Res. 16:995–1004. [DOI] [PMC free article] [PubMed] [Google Scholar]
- Yue Z, et al. 2013. A heterozygous moth genome provides insights into herbivory and detoxification. Nat Genet. 45220–225. [DOI] [PubMed] [Google Scholar]
- Zha X, et al. 2009. Dosage analysis of Z chromosome genes using microarray in silkworm, Bombyx mori. Insect Biochem Mol Biol. 39:315–321 [DOI] [PubMed] [Google Scholar]
Associated Data
This section collects any data citations, data availability statements, or supplementary materials included in this article.