

Abstract
Despite the recent decline of natural product discovery programs in the pharmaceutical industry, approximately half of all new drug approvals still trace their structural origins to a natural product. Herein, we use principal component analysis to compare the structural and physicochemical features of drugs from natural product-based versus completely synthetic origins that were approved between 1981–2010. Drugs based on natural product structures display greater chemical diversity and occupy larger regions of chemical space than drugs from completely synthetic origins. Notably, synthetic drugs based on natural product pharmacophores also exhibit lower hydrophobicity and greater stereochemical content than drugs from completely synthetic origins. These results illustrate that structural features found in natural products can be successfully incorporated into synthetic drugs, thereby increasing the chemical diversity available for small-molecule drug discovery.
Keywords: Natural products, Synthetic drugs, Physicochemical properties, Cheminformatics, Principal component analysis
Graphical Abstract
Recent studies indicate that annual drug approvals have remained at a fairly low, constant level since the 1950s despite technological advancements1,2 and increased research and development expenditures. The current cost of developing a drug from concept to market is estimated at nearly $2.6 billion.3 A striking trend over the last 30 years is the marked increase in approvals of biologic therapeutics (e.g., monoclonal antibodies and vaccines) and decline in small-molecule drugs (Figure 1).4, 5 This trend is consistent with the pharmaceutical industry’s shift away from focusing exclusively on classical, small-molecule drug discovery and toward biologics.6,7
Figure 1. Approved drugs 1981–2010.

NCEs from 1981–2010 are binned in five-year groups and displayed in three series: total approved drugs (●), small molecules (■), and biologics (▲).
Despite this, small-molecule drugs remain an integral component of the drug discovery pipeline. Most notably, small molecules are still more effective at addressing intracellular targets than most biologics.8,9 However, small-molecule drugs address a rather limited range of targets. A 2006 study estimated that approved small-molecule drugs target only 207 proteins encoded by the human genome.10 Moreover, 50% of all drugs target only four protein classes: rhodopsin-like G-protein coupled receptors, nuclear receptors, voltage-gated ion channels, and ligand-gated ion channels.10
A potential factor contributing to the limited range of biological targets engaged by small-molecule drugs is the lack of chemical diversity in most discovery libraries. Small-molecule drug development often begins with screening campaigns using compound collections whose designs are impacted heavily by synthetic accessibility.11 Discovery libraries are also biased by conventions such as Lipinski’s Rule-of-five12 and Veber’s rules13 for oral bioavailability, which have been used to define ‘drug-like’ structures based on prescribed boundaries of certain physicochemical parameters. In addition, many combinatorial libraries are developed around the structural features of known compounds or previously successful drug candidates.11 Over time, these factors have led to screening collections replete with molecules sharing a high degree of structural similarity.
Broadening the scope of addressable targets and investigating new modes of action are important goals towards increasing the versatility of small-molecule therapeutics. Natural products are an important source of bioactive molecules for drug development and address a wide range of biological targets.14–17 Over half of all approved small-molecule drugs trace their structural origins to natural products.4,5 In addition, there are a considerable number of natural products and natural product-derived compounds currently in clinical trials.18 However, natural product drug discovery is often associated with challenges in purification, characterization, and chemical modification of complex natural product scaffolds.14,19 As such, natural product scaffolds are underrepresented in small-molecule libraries, with a recent study estimating that only 17% of the scaffolds found in natural products (with ≤11 heavy atoms) are present in commercially available screening collections.20
To investigate differences in the chemical properties of drugs from natural product versus synthetic origins, we report herein a principal component analysis (PCA) of the structural and physicochemical features found in new chemical entities (NCEs) approved between 1981–2010. Overall, we find that drugs based on natural product structures exhibit greater chemical diversity and interrogate larger regions of chemical space compared to drugs from completely synthetic origins (i.e.: structure not based upon a natural product). Relative to completely synthetic drugs, natural products and their semisynthetic derivatives have larger molecular size, greater three-dimensional complexity, lower hydrophobicity and increased polarity, and fewer aromatic rings. Moreover, drugs that are synthetic but based on natural product structures or pharmacophores are also somewhat larger, more complex, and less hydrophobic than completely synthetic drugs. These results illustrate that structural features found in natural products can be successfully incorporated into synthetic drugs as a means of increasing chemical diversity and, by extension, target diversity.
Thus, we parsed NCEs approved between 1981–2010 by compound source using categories established by Newman and Cragg:4,5,21
- NP=
Natural product.
- ND=
Derived from a natural product; usually a semisynthetic modification.
- S*=
Made by total synthesis, but the pharmacophore is from a natural product.
- S=
Synthetic drug; often found by HTS or modification of an existing agent.
- NM=
Natural product mimic.
The parsed NCEs indicate that approximately half of all small-molecule drugs approved over the last 30 years trace their structural origins to a natural product. Binning NCEs in five-year periods reveals that this pattern has remained consistent over time, with drugs based on natural product structures (NP, ND, S*, S*/NM) and completely synthetic drugs (S, S/NM) representing fairly equal shares of total small-molecule drug approvals in each time interval (Figure 2a). Examining relative approval numbers for natural product (NP), natural product-derived (ND), and natural product-inspired synthetic (S*, S*/NM) drugs highlights additional trends (Figure 2b). Approvals for NP drugs peaked in the late 1980s and declined in the 1990s, correlating with the decommissioning of many natural product discovery programs in the pharmaceutical industry.22 The uptick in NP drugs between 2001–2010 results, in part, from the approval of several botanical “defined mixtures”, which have become recognized as drugs by the FDA and similar organizations.5 In addition, approvals for ND drugs have remained fairly constant over time, whereas approvals for S* drugs increased in 1981–2000, then leveled off and declined in 2001–2010.
Figure 2. Small-molecule drug approvals between 1981–2010 parsed by compound class.

NCEs are binned in five-year periods and displayed as percentages of total small-molecule drug approvals in each time interval. (a) NCEs parsed as drugs based on natural product structures (i.e.: natural products (NP), natural product-derived (ND), natural product-inspired synthetics (S*, S*/NM)) versus drugs from completely synthetic origins (S, S/NM). (b) Drugs based on natural product structures parsed by individual compound classes.
Parameter selection
To gain a greater understanding of structural differences between approved drugs from natural product versus completely synthetic origins, we carried out a cheminformatic analysis of the NCEs from 1981–2010. Compounds were analyzed for our established set of 20 structural and physicochemical parameters (Table 1).23–29 Parameters were selected based on the considerations outlined below.
Table 1.
Structural and physicochemical parameters used to analyze NCEs between 1981–2010.
| Parameter | Description |
|---|---|
|
| |
| MW | molecular weight |
| N | number of nitrogen atoms |
| O | number of oxygen atoms |
| HBD | number of hydrogen bond donor atoms |
| HBA | number of hydrogen bond acceptor atoms |
| RotB | number of rotatable bonds |
| tPSA | topological polar surface area |
| VWSA | Van der Waals surface area |
| relPSA | tPSA ÷ VWSA (relative polar surface area) |
| nStereo | number of stereocenters |
| nStMW | nStereo ÷ MW (stereochemical density) |
| Fsp3 | sp3 carbon count ÷ total carbon count (fraction sp3) |
| Rings | number of rings |
| RngAr | number of aromatic rings |
| RngSys | number of ring systems |
| RngLg | number of atoms in the largest ring |
| RRSys | Rings ÷ RngSys (ring complexity) |
| ALOGPs | calculated n-octanol/water partition coefficient |
| ALOGpS | calculated aqueous solubility |
| LogD | calculated n-octanol/water distribution coefficient |
Lipinski’s Rule-of-five (molecular weight (MW) ≤ 500; hydrogen bond acceptors (HBA) ≤ 10; hydrogen bond donors (HBD) ≤ 5; calculated octanol/water partition coefficient (CLogP) ≤ 5) has prescribed limits on parameters correlated with oral bioavailability.12 Subsequent studies correlated increased oral bioavailability with rotatable bond count (RotB ≤ 10) and topological polar surface area (tPSA ≤ 140 Å).13,30 Such chemical conventions have guided drug discovery in the pharmaceutical industry for many years and have strongly influenced the chemical features found in current small-molecule drugs. Notably, many natural products, including approved drugs that are orally bioavailable, violate these conventions.31 Thus, we included MW, HBA, HBD, ALOGPs,32 RotB, and tPSA in our analysis, as these parameters were predicted to highlight differences between natural products and synthetic drugs.
Several additional descriptors were included to complement these standard parameters, including: calculated n-octanol/water distribution coefficient (LogD), calculated aqueous solubility (ALOGpS), Van der Waals surface area (VWSA), relative polar surface area (relPSA), and heteroatom counts (number of nitrogens, N; number of oxygens, O). LogD (pH 7.4) was included as an alternative measure of hydrophobicity as many of the drugs in this analysis contain ionizable functional groups. ALOGpS32 is a calculated measure of aqueous solubility and was included because solubility is often a challenge for synthetic drug-like compounds. VWSA and relPSA were included as additional measures of molecular surface properties due to the correlation of such features with passive membrane diffusion.33 Finally, heteroatom counts (N, O) were included because natural products typically have fewer nitrogen atoms and more oxygen atoms than synthetic drug-like compounds.34, 35
Molecular complexity is an important feature differentiating natural products and synthetic compounds. Whereas synthetic drug-like compounds are commonly regarded as flat, rigid molecules with a high degree of aromatic character, natural products generally contain more complex scaffolds.16 This is particularly important in drug design as molecular complexity has been correlated with biological activity.36 An important metric for molecular complexity is stereochemical content as measured by the number of stereocenters in a molecule (nStereo). Previous cheminformatic analyses have shown that natural products have a greater number of stereocenters than synthetic drug-like compounds34 and increased stereochemical content has also been associated with improved binding selectivity16 and successful progression through clinical trials.37 As stereocenter count is correlated with molecular weight (vide infra), a normalized descriptor for stereochemical density (nStereo ÷ MW = nStMW) was also included. Another important measure of molecular complexity was defined by Lovering as fraction sp3 (Fsp3), where Fsp3 = total number of sp3 carbons ÷ total carbon count.37 Importantly, Fsp3 has been correlated with improved progression from lead discovery through clinical trials to drug approval.37 Subsequent statistical studies used Fsp3 to illustrate that natural products are more complex than the synthetic drug-like compounds found in commercial screening libraries.38 Accordingly, Fsp3 was included to complement the nStereo and nStMW descriptors.
Natural products are also differentiated from drug-like compounds by having larger, more complex ring systems.35,39 Thus, several parameters related to ring count and ring size were included in the analysis: number of rings (Rings), number of aromatic rings (RngAr), number of ring systems (RngSys), atom count of largest ring (RngLg), and rings per ring system (RRSys). RngAr is of particular importance as previous analyses have shown that synthetic drug-like compounds, on average, have more aromatic character than natural products,34 and aromatic content has been correlated with increased preclinical toxicity and attrition rates in drug candidate progression.40,41
Average values for structural and physicochemical parameters
We then determined average values of each structural and physicochemical descriptor for each drug category (Table 2). Molecular weight varies significantly between classes and both NP and ND drugs have higher average molecular weights than S* and S drugs. The large differences in mean molecular weight are due in part to the approval of several large peptide natural products; the difference in median molecular weights is less pronounced, although the same trend holds (Table S1). These results are consistent with previous cheminformatic studies.34, 35 The lower average molecular weight for completely synthetic S drugs is also consistent with the use of Lipinski parameters in the development of synthetic drugs. In addition, despite having structures based on natural product pharmacophores, the average molecular weight for S* drugs is lower than that of NP and ND drugs, closer to that of completely synthetic S drugs (Table 2).
Table 2.
Mean values for the structural and physicochemical parameters of approved small-molecule drugs. See Table S1 for median values and Table S2 for additional molecular weight-normalized values of size-dependent parameters.
| Natural product drugs (NP) | NP- derived drugs (ND) | NP-inspired synthetic drugs (S*, S*/NM) | Completely Synthetic drugs (S, S/NM) | |
|---|---|---|---|---|
| MW | 626 | 634 | 386 | 343 |
| N | 4.1 | 4.4 | 3.0 | 2.4 |
| O | 9.3 | 8.3 | 4.1 | 2.6 |
| HBD | 6.4 | 5.0 | 2.5 | 1.3 |
| HBA | 10.3 | 9.2 | 5.2 | 4.2 |
| RotB | 11.0 | 12.6 | 7.7 | 5.2 |
| nStereo | 8.2 | 6.7 | 1.9 | 0.8 |
| nStMW | 0.012 | 0.011 | 0.005 | 0.002 |
| Fsp3 | 0.68 | 0.60 | 0.47 | 0.37 |
| tPSA | 209 | 194 | 98 | 70 |
| VWSA | 933 | 917 | 573 | 487 |
| relPSA | 0.22 | 0.20 | 0.19 | 0.16 |
| Rings | 3.1 | 3.8 | 2.8 | 2.8 |
| RngAr | 0.8 | 1.3 | 1.9 | 1.9 |
| RngSys | 2.0 | 2.2 | 2.0 | 2.2 |
| RngLg | 9.6 | 7.5 | 6.1 | 5.9 |
| RRSys | 1.6 | 2.1 | 1.4 | 1.3 |
| ALOGPs | 1.5 | 2.0 | 1.8 | 2.7 |
| ALOGpS | −3.3 | −3.9 | −3.5 | −3.7 |
| LogD | −2.2 | −1.3 | 0.3 | 1.5 |
Relative to S* and S drugs, NP and ND drugs have higher average values for other parameters that correlate with molecular weight, such as heteroatom count (N, O), hydrogen bond donor/acceptor count (HBD, HBA), rotatable bond count (RotB), and stereocenter count (nStereo). To account for the influence of molecular weight on these parameters, we divided the average values of each descriptor by the average molecular weight for each compound class. The normalized values for heteroatom count, hydrogen bond donor/acceptor count, and rotatable bond count display little to no variation across compound classes (Table S2). Notably, the normalized values for stereocenter count (nStMW) for NP and ND drugs were 2- to 6-fold higher than those for S* and S drugs (Table 2). These data are consistent with previous cheminformatic studies indicating that natural products have a greater degree of stereochemical diversity relative to synthetic drug-like compounds.34,35
The values of Fsp3 are higher for NP and ND drugs relative to S* and S drugs. This is particularly important because increased molecular complexity, as measured by Fsp3, has been associated with the ability of molecules to interrogate larger regions of chemical space.37 Interestingly, although S* and S drugs have similar average molecular weights, S* drugs have higher values for both nStMW and Fsp3. Thus, natural product-based S* drugs exhibit greater molecular complexity than completely synthetic S drugs.
Overall, ring count (Rings), ring system count (RngSys), and rings per ring system (RRSys) are similar across compound classes. Mean values for the size of the largest ring (RngLg) suggest that, on average, NP drugs contain larger rings than S drugs (Table 2). However, the median value for largest ring size is equivalent (6 atoms) for all compound classes (Table S1), indicating that outliers may skew the mean value for NP drugs. The average and median number of aromatic rings is higher for S and S* drugs relative to NP and ND drugs. These data are consistent with previous analyses indicating that natural products have lower aromatic character than synthetic, drug-like compounds.34
Finally, the partition coefficient ALOGPs and distribution coefficient LogD both predict NP and S drugs to have the lowest and highest hydrophobicity, respectively, with ND and S* drugs having intermediate values. The increased lipophilicity of S drugs may result in part from higher aromatic content. Calculated aqueous solubility ALOGpS is similar across drug classes.
Principal component analysis comparison of compound classes
To visualize the distribution of NCEs in chemical space, we performed principal component analysis (PCA) on the set of structural and physicochemical descriptors described above. PCA is a statistical method for variable reduction that allows multidimensional data to be visualized using two- and three-dimensional plots with minimal loss of information from the original dataset. As several of the descriptors in this analysis are correlated, PCA uses a linear transformation to rotate the matrix of variables onto a set of orthonormal axes that define the dimensions of greatest variance for the dataset.42–44 The newly formed axes are called principal components and represent linear combinations of the original variables (descriptors). Importantly, the matrix rotation preserves Euclidean distances and maximizes the fraction of total variance from the original dataset on each successive principal component. Through this transformation, the first principal component (PC1) retains the greatest fraction of variance from the original dataset, the second principal component (PC2) contains the next largest fraction, and so on. In this way, an n-dimensional dataset can be visualized using an m-dimensional plot of principal components (where m ≪ n) with minimal loss of information.42–44
In the current analysis, drugs were evaluated for 20 structural and physicochemical properties (Table 1), with PCA resulting in rotation of the complete 20-dimensional dataset onto a set of principal components.23 Taken together, the first two principal components (PC1, PC2) in this analysis retain 64% of the information in the full 20-dimensional dataset (Table S3), whereas >90% of the information in the full dataset is represented in the first six principal components (PC1–PC6; Table S3). The PCA plot (PC1 vs PC2) from a single analysis encompassing all compounds is presented in Figure 3, although NP, ND, S* and S drugs are shown on separate plots for clarity. To maintain the orientation of these PCA plots with our previous analyses,23–28 PC2 scores for each compound were inverted; this is feasible because the signs and units of each principal component are arbitrary.
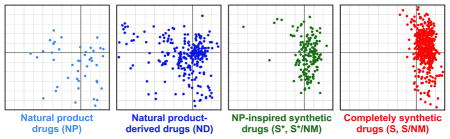
Figure 3. PCA plots of drugs approved between 1981–2010 parsed by compound class.

Data from a single analysis are shown on four separate PCA plots defined by the first two principal components, PC1 vs PC2, for (a) natural product drugs (NP), (b) natural product-derived drugs (ND), (c) natural product-inspired synthetic drugs (S*, S*/NM), and (d) completely synthetic drugs (S, S/NM).
The PCA plots indicate that NP (Figure 3a) and ND drugs (Figure 3b) are fairly evenly distributed across chemical space as defined by PC1 and PC2. The wide spread of NP and ND drugs on the PCA plots illustrates the high degree of physicochemical and structural diversity found in these molecules. Both S* (Figure 3c) and S drugs (Figure 3d) occupy tighter clusters in chemical space relative to NP and ND drugs. These data indicate that the structural and physicochemical features of synthetic drugs are more narrowly focused than natural products, and consequently these compounds exhibit less chemical diversity.
Component loadings in the PCA can be used to understand the influence of the original 20 parameters on the distribution of molecules in the PCA plots. A loading plot (Figure 4) illustrates how the original variables are rotated onto the plane defined by PC1 and PC2. The loading plot reveals that molecular weight (MW) and other size-based parameters such as heteroatom counts (N, O), hydrogen bond donor/acceptor count (HBD, HBA), rotatable bond count (RotB), and stereocenter count (nStereo) have a strong negative (leftward) influence along PC1. The high correlation of molecular weight with these parameters is illustrated on the loading plot by the small angles between the vectors representing each descriptor. This indicates that the large spread of NP and ND drugs along PC1, relative to S* and S drugs, is largely due to variance in molecular size (Figure 3). These data agree with previous analyses showing that natural products have, on average, higher molecular weights relative to synthetic drug-like compounds.34, 35
Figure 4. Component loadings for the PCA.

Vectors on the loading plot indicate the relative influence of each structural and physiochemical descriptor on the placement of molecules on the plot of PC1 vs PC2.
Although the distribution of S* and S drugs is constrained along PC1, the spread of these compounds is more pronounced on PC2 (Figure 3c,d). Positioning of compounds along PC2 is governed largely by ALOGPs and ALOGpS, which influence compounds in a positive (upward) and negative (downward) direction, respectively (Figure 4). In addition, RngAr, Rings and RngSys influence the positioning of compounds positively (upward) along PC2, and negatively (leftward) along PC1. Descriptors for molecular complexity Fsp3 and nStMW, as well as relPSA, influence the positioning of compounds negatively (downward) along PC2 and negatively (leftward) along PC1 (Figure 4).
Compared to the natural product-based NP, ND, and S* drugs, a larger portion of completely synthetic S drugs cluster in the upper right region of the PCA plot (Figure 3). The component loadings indicate that this results from the increased hydrophobic character of S drugs, as measured by ALOGPs and LogD. In contrast, a greater proportion of NP and ND drugs extend into the lower left region of the PCA plot (Figure 3), resulting from lower hydrophobicity (ALOGPs, LogD) and greater molecular complexity (nStMW and Fsp3). Interestingly, natural product-based S* drugs cluster lower on PC2 than completely synthetic S drugs (Figure 3c,d), due to the decreased hydrophobicity (ALOGPs) and increased stereochemical diversity (nStMW and Fsp3) of the former.
Time-resolved analysis of structural and physicochemical descriptors and PCA plots
To investigate relative changes in the properties of drugs over the last 30 years, average values of the 20 structural and physicochemical parameters for NP, ND, S*, and S drugs were parsed in five-year periods from 1981–2010 (Table S4). Although distinct trends are less clear in these data, molecular weight displays a noticeable increase for all NCEs from 1981–2010. A dramatic increase in molecular weight for NP drugs in 2001–2005 is in part due to the approval of several large peptide-based drugs, which skew the mean value. The influence of high molecular weight outliers is less pronounced on median values, though the pattern of increasing molecular weight is still observed (Table S5). These results are consistent with previous cheminformatic studies indicating that the molecular weight of drugs has increased since the early 1980s.45, 46 Parameters that correlate with molecular weight, such as heteroatom counts (N, O), hydrogen bond donor/acceptor count (HBD, HBA), rotatable bond count (RotB), and stereocenter count (nStereo), also increase over time. However, when normalized for molecular weight, these parameters have remained fairly consistent over the last 30 years.
When drugs in the PCA plot are parsed in five-year periods, little change is observed with respect to the relative regions of chemical space occupied by NP, ND, S*, and S drugs (Figure S1). These data suggest that the relative positions of natural products and synthetic drugs in chemical space has remained similar over the last 30 years. Although a recent analysis of the physicochemical features of drugs suggest that drugs approved since 2002 occupy different regions of chemical space compared to drugs approved before 1983,46 the current analysis considers only the relative diversity of drugs from natural product versus synthetic sources, and does not include structures of drugs approved prior to 1981.
Conclusions
Our cheminformatic analysis of NCEs approved between 1981–2010 indicates that drugs that are based on natural product structures exhibit a greater range of structural and physicochemical features compared to completely synthetic drugs. Furthermore, PCA using our established set of 20 structural and physicochemical parameters23–29 indicates that NP and ND drugs interrogate larger areas of chemical space that S drugs. NP and ND drugs are differentiated from S drugs by having, on average, larger molecular scaffolds with lower hydrophobicity and higher stereochemical content and molecular complexity. These results agree with previous studies indicating that synthetic drug-like compounds display less structural diversity and occupy a narrower region of chemical space compared to natural products.16,26,34,35,47
Such studies highlight fundamental differences between compounds from natural and synthetic origins. Whereas the structural features of many natural products have been tailored through evolution for binding to biological macromolecules, synthetic drugs derive their structural features from the scaffolds and building blocks used in their preparation. This becomes a limiting factor as many drug-like combinatorial libraries are constructed based on synthetic accessibility or structures of previously successful drug candidates.11 As such, this strategy has restricted the structural diversity of many discovery libraries, which may have contributed to the limited target diversity of current small-molecule synthetic drugs.
Our analysis also illustrates that drugs that are synthetic but based on natural product scaffolds (S*) are less hydrophobic and have greater stereochemical complexity than drugs of completely synthetic origins (S). This is of particular relevance to drug design as features such as increased molecular complexity and stereochemical content have been correlated with decreased preclinical toxicity40, 48 and increased progression through clinical trials.37 Moreover, these data underscore the general concept that the structural features found in natural products can be successfully leveraged to increase the structural diversity of synthetic drugs. Such information can now guide the development of synthetic methods that aim at enhancing diversity by exploiting the structural motifs and features of natural products.
Supplementary Material
Acknowledgments
This work is dedicated to the memory of our mentor and colleague, Professor David Y. Gin (1967–2011). Instant JChem was generously provided by ChemAxon. Financial support from the NIH (P41 GM076267 to D. S. T.), Tri-Institutional Stem Cell Initiative, William H. Goodwin and Alice Goodwin and the Commonwealth Foundation for Cancer Research, and the MSKCC Experimental Therapeutics Center is gratefully acknowledged.
Footnotes
Supplementary data associated with this article can be found, in the online version, at
Publisher's Disclaimer: This is a PDF file of an unedited manuscript that has been accepted for publication. As a service to our customers we are providing this early version of the manuscript. The manuscript will undergo copyediting, typesetting, and review of the resulting proof before it is published in its final citable form. Please note that during the production process errors may be discovered which could affect the content, and all legal disclaimers that apply to the journal pertain.
References
- 1.Munos B. Nat Rev Drug Discov. 2009;8:959. doi: 10.1038/nrd2961. [DOI] [PubMed] [Google Scholar]
- 2.Scannell JW, Blanckley A, Boldon H, Warrington B. Nat Rev Drug Discov. 2012;11:191. doi: 10.1038/nrd3681. [DOI] [PubMed] [Google Scholar]
- 3.DiMasi JA, Grabowski HG, Hansen RW. Cost to develop and win marketing approval for a new drug is $2.6 billion. http://csdd.tufts.edu.
- 4.Newman DJ, Cragg GM. J Nat Prod. 2007;70:461. doi: 10.1021/np068054v. [DOI] [PubMed] [Google Scholar]
- 5.Newman DJ, Cragg GM. J Nat Prod. 2012;75:311. doi: 10.1021/np200906s. [DOI] [PMC free article] [PubMed] [Google Scholar]
- 6.Prueksaritanont T, Tang C. AAPS J. 2012;14:410. doi: 10.1208/s12248-012-9353-6. [DOI] [PMC free article] [PubMed] [Google Scholar]
- 7.Projan SJ, Gill D, Lu Z, Herrmann SH. Expert Opin Biol Ther. 2004;4:1345. doi: 10.1517/14712598.4.8.1345. [DOI] [PubMed] [Google Scholar]
- 8.Mitragotri S, Burke PA, Langer R. Nat Rev Drug Discov. 2014;13:655. doi: 10.1038/nrd4363. [DOI] [PMC free article] [PubMed] [Google Scholar]
- 9.Smith AJ. J Biomol Screen. 2015;20:437. doi: 10.1177/1087057114562544. [DOI] [PubMed] [Google Scholar]
- 10.Overington JP, Al-Lazikani B, Hopkins AL. Nat Rev Drug Discov. 2006;5:993. doi: 10.1038/nrd2199. [DOI] [PubMed] [Google Scholar]
- 11.Eberhardt L, Kumar K, Waldmann H. Curr Drug Targets. 2011;12:1531. doi: 10.2174/138945011798109482. [DOI] [PubMed] [Google Scholar]
- 12.Lipinski CA, Lombardo F, Dominy BW, Feeney PJ. Adv Drug Deliv Rev. 1997;23:3. doi: 10.1016/s0169-409x(00)00129-0. [DOI] [PubMed] [Google Scholar]
- 13.Veber DF, Johnson SR, Cheng HY, Smith BR, Ward KW, Kopple KD. J Med Chem. 2002;45:2615. doi: 10.1021/jm020017n. [DOI] [PubMed] [Google Scholar]
- 14.Harvey AL. Drug Discov Today. 2008;13:894. doi: 10.1016/j.drudis.2008.07.004. [DOI] [PubMed] [Google Scholar]
- 15.Harvey AL, Edrada-Ebel R, Quinn RJ. Nat Rev Drug Discov. 2015;14:111. doi: 10.1038/nrd4510. [DOI] [PubMed] [Google Scholar]
- 16.Clemons PA, Bodycombe NE, Carrinski HA, Wilson JA, Shamji AF, Wagner BK, Koehler AN, Schreiber SL. Proc Natl Acad Sci USA. 2010;107:18787. doi: 10.1073/pnas.1012741107. [DOI] [PMC free article] [PubMed] [Google Scholar]
- 17.Dixon N, Wong LS, Geerlings TH, Micklefield J. Nat Prod Rep. 2007;24:1288. doi: 10.1039/b616808f. [DOI] [PubMed] [Google Scholar]
- 18.Butler MS, Robertson AA, Cooper MA. Nat Prod Rep. 2014;31:1612. doi: 10.1039/c4np00064a. [DOI] [PubMed] [Google Scholar]
- 19.O’Connor CJ, Laraia L, Spring DR. Chem Soc Rev. 2011;40:4332. doi: 10.1039/c1cs15053g. [DOI] [PubMed] [Google Scholar]
- 20.Hert J, Irwin JJ, Laggner C, Keiser MJ, Shoichet BK. Nat Chem Biol. 2009;5:479. doi: 10.1038/nchembio.180. [DOI] [PMC free article] [PubMed] [Google Scholar]
- 21.Cragg GM, Newman DJ, Snader KM. J Nat Prod. 1997;60:52. doi: 10.1021/np9604893. [DOI] [PubMed] [Google Scholar]
- 22.Dias DA, Urban S, Roessner U. Metabolites. 2012;2:303. doi: 10.3390/metabo2020303. [DOI] [PMC free article] [PubMed] [Google Scholar]
- 23.Wenderski TA, Stratton CF, Bauer RA, Kopp F, Tan DS. Methods Mol Biol. 2015;1263:225. doi: 10.1007/978-1-4939-2269-7_18. [DOI] [PMC free article] [PubMed] [Google Scholar]
- 24.Bauer RA, Wenderski TA, Tan DS. Nat Chem Biol. 2013;9:21. doi: 10.1038/nchembio.1130. [DOI] [PMC free article] [PubMed] [Google Scholar]
- 25.Kopp F, Stratton CF, Akella LB, Tan DS. Nat Chem Biol. 2012;8:358. doi: 10.1038/nchembio.911. [DOI] [PMC free article] [PubMed] [Google Scholar]
- 26.Bauer RA, Wurst JM, Tan DS. Curr Opin Chem Biol. 2010;14:308. doi: 10.1016/j.cbpa.2010.02.001. [DOI] [PMC free article] [PubMed] [Google Scholar]
- 27.Bauer RA, DiBlasi CM, Tan DS. Org Lett. 2010;12:2084. doi: 10.1021/ol100574y. [DOI] [PMC free article] [PubMed] [Google Scholar]
- 28.Moura-Letts G, DiBlasi HM, Bauer RA, Tan DS. Proc Natl Acad Sci U S A. 2011;108:6745. doi: 10.1073/pnas.1015268108. [DOI] [PMC free article] [PubMed] [Google Scholar]
- 29.Davis TD, Gerry CJ, Tan DS. ACS Chem Biol. 2014;9:2535. doi: 10.1021/cb5003015. [DOI] [PMC free article] [PubMed] [Google Scholar]
- 30.Lu JJ, Crimin K, Goodwin JT, Crivori P, Orrenius C, Xing L, Tandler PJ, Vidmar TJ, Amore BM, Wilson AG, Stouten PF, Burton PS. J Med Chem. 2004;47:6104. doi: 10.1021/jm0306529. [DOI] [PubMed] [Google Scholar]
- 31.Ganesan A. Curr Opin Chem Biol. 2008;12:306. doi: 10.1016/j.cbpa.2008.03.016. [DOI] [PubMed] [Google Scholar]
- 32.Tetko IV, Tanchuk VY, Kasheva TN, Villa AE. J Chem Inf Comput Sci. 2001;41:246. doi: 10.1021/ci000393l. [DOI] [PubMed] [Google Scholar]
- 33.Palm K, Luthman K, Ungell AL, Strandlund G, Artursson P. J Pharm Sci. 1996;85:32. doi: 10.1021/js950285r. [DOI] [PubMed] [Google Scholar]
- 34.Feher M, Schmidt JM. J Chem Inf Comput Sci. 2003;43:218. doi: 10.1021/ci0200467. [DOI] [PubMed] [Google Scholar]
- 35.Henkel T, Brunne RM, Muller H, Reichel F. Angew Chem, Int Ed. 1999;38:643. doi: 10.1002/(SICI)1521-3773(19990301)38:5<643::AID-ANIE643>3.0.CO;2-G. [DOI] [PubMed] [Google Scholar]
- 36.Selzer P, Roth HJ, Ertl P, Schuffenhauer A. Curr Opin Chem Biol. 2005;9:310. doi: 10.1016/j.cbpa.2005.04.001. [DOI] [PubMed] [Google Scholar]
- 37.Lovering F, Bikker J, Humblet C. J Med Chem. 2009;52:6752. doi: 10.1021/jm901241e. [DOI] [PubMed] [Google Scholar]
- 38.Dandapani S, Marcaurelle LA. Nat Chem Biol. 2010;6:861. doi: 10.1038/nchembio.479. [DOI] [PubMed] [Google Scholar]
- 39.Ertl P, Schuffenhauer A. Prog Drug Res. 2008;66:217. doi: 10.1007/978-3-7643-8595-8_4. [DOI] [PubMed] [Google Scholar]
- 40.Ritchie TJ, Macdonald SJ. Drug Discov Today. 2009;14:1011. doi: 10.1016/j.drudis.2009.07.014. [DOI] [PubMed] [Google Scholar]
- 41.Ritchie TJ, Macdonald SJ, Young RJ, Pickett SD. Drug Discov Today. 2011;16:164. doi: 10.1016/j.drudis.2010.11.014. [DOI] [PubMed] [Google Scholar]
- 42.Jackson JE. A User’s Guide to Principal Components. Hoboken, New Jersey: John Wiley & Sons, Inc; 2003. [Google Scholar]
- 43.Joliffe IT, Morgan BJ. Stat Methods Med Res. 1992;1:69. doi: 10.1177/096228029200100105. [DOI] [PubMed] [Google Scholar]
- 44.Jolliffe IT. Principal Component Analysis. New York, New York: Springer-Verlag, Inc; 2002. [Google Scholar]
- 45.Leeson PD, Davis AM. J Med Chem. 2004;47:6338. doi: 10.1021/jm049717d. [DOI] [PubMed] [Google Scholar]
- 46.Faller B, Ottaviani G, Ertl P, Berellini G, Collis A. Drug Discov Today. 2011;16:976. doi: 10.1016/j.drudis.2011.07.003. [DOI] [PubMed] [Google Scholar]
- 47.Singh SBaCJC. In: Natural product chemistry for drug discovery; Buss ADABAS, editor. RSC Publishing; Cambridge: 2010. p. 28. [Google Scholar]
- 48.Luker T, Alcaraz L, Chohan KK, Blomberg N, Brown DS, Butlin RJ, Elebring T, Griffin AM, Guile S, St-Gallay S, Swahn BM, Swallow S, Waring MJ, Wenlock MC, Leeson PD. Bioorg Med Chem Lett. 2011;21:5673. doi: 10.1016/j.bmcl.2011.07.074. [DOI] [PubMed] [Google Scholar]
Associated Data
This section collects any data citations, data availability statements, or supplementary materials included in this article.