

Abstract
Here, a matrix using two-dimensional (2D) graphene is demonstrated for the first time in the context of MALDI IMS using a Fourier transform ion cyclotron resonance (FT-ICR) mass spectrometer. While graphene flakes have been used previously in MALDI, it is described here how a single 2D layer of graphene is applied directly on top of rat brain sections and soybean leaves. Several classes of molecules are desorbed and ionized off of the surface of the tissues examined using 2D graphene, with minimal background interference from the matrix. Moreover, no solvents are employed in application of 2D graphene, eliminating the potential for analyte diffusion in liquid droplets during matrix application. Because 2D graphene is an elemental form of carbon, an additional advantage is its high compatibility with the long duration needed for many IMS experiments.
Keywords: graphene, MALDI, imaging mass spectrometry, Fourier transform ion cyclotron resonance, brain, soybean
Introduction
A major goal in IMS is to improve spatial resolution, which has prompted refinement of the matrix application process. Manual spraying (e.g., using an air brush) can be accomplished quickly, although it generally produces matrix crystals that can be hundreds of microns in size [1] and is not recommended for most applications of MALDI IMS. Automatic spray deposition controlled by robotics [2], electrospray [3], or acoustic spray [4] deposition can provide for more homogeneous coatings. Matrix crystals of 10–20 microns are produced using automated methods, but they are prone to forming regions of enhanced matrix and higher ionization yield or “hot spots.” A third approach that shows great promise for MALDI IMS is sublimation of matrix [5], which produces smaller crystals needed for high spatial resolution IMS [6], but is potentially problematic because the elevated temperatures used could promote lateral diffusion of analytes, thereby degrading spatial resolution. Sublimation followed by recrystallization of matrix in a humid atmosphere can produce matrix crystals down to 10 microns, and is a promising alternative [7].
To overcome limitations to spatial resolution imposed by traditional matrix applications, and to improve uniformity of signal response, we were motivated to pursue a two-dimensional (2D) matrix for IMS. Interestingly, 2D graphene [8] has many features suggesting high potential for MALDI IMS. Graphene was introduced as a matrix for MALDI MS [9]; administered as flakes admixed with the sample, the initial report [9] showed that graphene serves to desorb and ionize both polar and nonpolar compounds without significant fragmentation of the molecular ions. Moreover, graphene promotes a high desorption/ionization efficiency for nonpolar compounds in comparison to traditional MALDI matrixes. In addition, graphene shows a high tolerance for salt and a lack of background signal in the mass spectra, which is especially crucial in the analysis of low m/z species [9] that may be the focus of metabolomics.
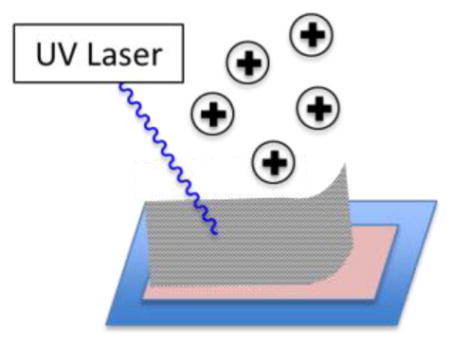
Here, we apply a 2D sheet of graphene directly on top of tissue samples via a “dry transfer” process without the necessity of a conventional matrix or any solvents for IMS. The 2D graphene matrix is shown to be effective in ionizing molecules from the surfaces of both plant and animal tissues with negligible background interference. Application of 2D graphene provides an environment that is stable under vacuum for prolonged periods of time needed for MALDI IMS.
Experimental
Materials
Indium-tin oxide (ITO) coated slides were purchased from Bruker Daltonics (Billerica, MA, USA).α-cyano-4-hydroxycinnamic acid (CHCA) and 2,5-dihydroxybenzoic acid (DHB) were from Sigma-Aldrich (St. Louis, MO, USA). All solvents used in MS analyses were HPLC grade or better. Conventional matrices were nebulized by a Bruker ImagePrep system using compressed nitrogen gas. Soybean leaves were collected mid-summer from a family farm in Northern Indiana. Rat brain tissue was graciously provided by Dr. Alexis Thompson of the Research Institute on Addictions, Buffalo, NY, USA.
Methods
Standard imaging protocols are followed for preparing tissue prior to matrix application [10]. In this case, 12 μm mouse brain sections and soybean leaves were used to illustrate the variety of tissues compatible with graphene. Plant tissue was attached to the ITO slide using Mount-Quick adhesive.
The graphene synthesis makes use of chemical vapor deposition at atmospheric pressure [11, 12]. Graphene was prepared on 25-μm thick polycrystalline Cu foils (Alfa Aesar, >99.8% purity) in a tube furnace consisting of a fused silica tube (22-mm internal diameter). The Cu foil was placed in the middle of the reactor (hot zone). It was first annealed for at least 30 minutes at 1000 °C under 300 sccm of argon and 10 sccm of hydrogen. The furnace was slowly cooled to 980 °C before introducing the precursor, methane (Jackson Welding and Gas Products, Buffalo, NY), at 10 sccm while the flow rates of argon and hydrogen (Praxair) were held constant. The growth process was performed for 5 minutes, after which the furnace was slowly cooled to 950 °C. The sample was then rapidly cooled by sliding the reactor upstream from the hot zone. During the entire cooling process, all three gases were kept on with constant flow rate.
The graphene-Cu strips were then rolled flat, with gentle pressure, onto the adhesive sides of thermal release tapes (319Y-4LS, Nitto Denko America, Inc.). This assembly was then flipped over, and floated on an aqueous solution of 0.2 M FeCl3/4 M HCl, to etch away Cu. The graphene-tape strips were then washed with distilled water and dried under a stream of air. These were then transferred on top of tissue sample on ITO slides by a brief thermal treatment with a heat gun, in which the adhesion of graphene to the thermal tape is significantly lost upon reaching 90 C [13]; once detached from the tape, the graphene is placed directly over the tissue sample to be imaged using tweezers.
MS parameters were optimized for each matrix. In addition to graphene, conventional matrices were used, including DHB and CHCA. All experiments were conducted on a Bruker SolariX 12T FT-ICR mass spectrometer, equipped with a SmartBeam Nd:YAG Laser, λ = 355 nm. Imaging experiments were conducted using Bruker FlexImaging software; analysis was done on FlexImaging software and the freeware BioMap (www.maldi-msi.org). Atomic force microscopy (AFM) was carried out using an AIST-NT SmartSPM-1000-2 and a Si probe (k= 5.3 N/m) in tapping mode with a 50 nm stepsize at a scan rate of 0.5 Hz.
Results and Discussion
Laser ablation of graphene
A clean ITO glass slide was coated with 2D graphene and placed in the mass spectrometer. A laser ablation experiment was conducted in which the laser was fired at the graphene surface until it was ablated, exposing the glass below. This was replicated, increasing the laser focus. Subsequent AFM of the slide illustrates that the focusing limits of the instrument are readily achieveable, allowing for a pixel size of ≤ 10 μm (Figure 1). When using DHB and CHCA matrices deposited using a Bruker ImagePrep system, ablated regions are typically 25–40 μm.
Figure 1.

3D AFM image of graphene on ITO slide after laser ablation. A: Laser focus setting small, B: Laser focus setting minimum. Ablated area marked with dashed line and dimensions of ablated regions are noted in projection. All dimensions shown are provided in micrometers.
MALDI IMS of soybean leaves
A MALDI IMS image of ion intensity atop a digital image of the soybean leaf is shown in Figure 2. The lightened box over the leaf image represents the area interrogated by MALDI IMS. What is of particular note is that in this image, each of the four m/z correlate extremely well with the vascular architecture of the soybean leaf, a phenomenon others have noted in MALDI IMS for a cyclotide in the leaf vasculature of petunias [14]. Figure 3 represents an FT-ICR mass spectrum collected at a pixel on a vein in the soybean leaf. A series of ions (m/z 585, 747, 909, 1071, and 1233) separated by successive mass differences of 162 Da suggests various levels of glycosylated metabolites. A second series separated by 162 Da is observed 60 Da above this series. Knowledge of soybean metabolites is relatively sparse, although reports exist of species extracted from root hairs [15] or soybean seeds [16]. However, higher resolution MALDI CID FT-ICR mass spectra acquired without performing imaging can be used to provide insight into molecular structure. CID of the peak at m/z 747.2 (not shown) indicates structural components consistent with a kaempferol (loss of C6H10O5, C9H6O3, and C15H10O6). The other ions in this series could also be kaempferols with different levels of glycosylation. The series shifted 60 Da above this one may be due to pelargonidins, although liquid chromatography coupled with MS/MS of putative standards and solvent extracts of the leaves would be needed for establishing absolute identities. Nevertheless, MALDI IMS can be an important tool in metabolic profiling and nutrient transport throughout the plant, and will only become more powerful as plant metabolite databases are expanded and made publically available.
Figure 2.

MALDI IMS FT-ICR using a 2D graphene layer matrix on a soybean leaf section. The lightened area represents the area examined. Bright white represents high ion intensity, using summed ion abundance of only four m/z at 868.9, 873.1, 887.4, and 1109.2.
Figure 3.

MALDI IMS FT-ICR using a 2D graphene layer matrix for a pixel located on a soybean leaf vein.
MALDI IMS of rat brain tissue
Visualizing the graphene layer over the tissue on an ITO slide is difficult, if not impossible with the naked eye. Nevertheless, as with soybean leaves, the 2D graphene matrix generates ions from a variety of different compounds at the surface of rat brain tissue, including lower mass ions that would have been difficult to distinguish from low mass background due to conventional organic matrix clusters and fragments. The spatial distributions of several of these ions are shown in Figure 4. In the brain tissue, both small peptides and lipids are detected. For example, the peak at m/z 429.1 (Figure 4A) may be due to a 3-amino acid peptide composed of Lys, Phe, and Ile/Leu; notably, another species with a peak shifted 28 Da higher corresponds to C2H4, possibly due to demethylation of the Lys. Figure 4D and 4E represent images of [M+2Na]+ and [M+Na+K]+ of the lipid 18:0/15-HETE-PE (18:0/15-HETE-PE, C43H78NO9P); the [M+Na]+ is also detected with 4 ppm mass error, corroborating this assignment.
Figure 4.

MALDI IMS using a 2D graphene layer matrix on a mouse hemisphere section. Images represent selected ion current as a function of position for ions at m/z A) 429.1, B) 494.7, C) 612.6, D) 828.5, E) 844.4, and F) 868.4. White represents high intensity ion signals while black represents low intensity ion signals.
Conclusions
While conventional MALDI matrices, such as DHB and CHCA, have been—and continue to be—crucial to the MALDI community, their use includes a number of significant drawbacks that limit their effectiveness in IMS. Unlike the overwhelming low mass background produced by conventional matrix clusters, fragments, and salt adducts, graphene produces virtually no background in those regions, allowing for small molecule detection and tandem MS experiments (MALDI mass spectra of these on ITO slides is shown in Supplementary Figure 1). At very high laser powers, the formation of C60 and other even-numbered carbon clusters can be induced and these are detected in the mass spectrum, which has utility in instrument calibration at high m/z.
In the push to maximize spatial resolution with conventional matrices, recent efforts have focused on sublimation and then crystallization on the sample [17,18]. While this method has decreased matrix crystal size and thereby increased attainable spatial resolution, it comes at the price of potential thermal degradation. This is because the matrix is heated under mTorr pressure and sublimed onto tissue sections mounted on microscope slides. Thus, there is a risk that some thermally fragile analytes may degrade when exposed to warm temperatures used for sublimation (> 100 C) for extended time periods during sublimation. 2D graphene can be released onto the sample with a quick exposure to a stream of warm air or, though more challenging to do, it can be released onto another surface and subsequently transferred onto the sample. In effect, the sample can move from the freezer to the mass spectrometer in as little as a few minutes. In turn, spatial resolution is maximized, as a uniform sheet of graphene does not have the crystal size characteristic of the array of organic matrices currently in use. In addition, because of the uniform thickness and elasticity of a 2D graphene sheet and its ability to conformally adopt the contours of the substrate [19], all parts of the underlying tissue have equal coverage of matrix. Additionally, the π cloud of graphene tends to facilitate electronic interactions with a diverse range of underlying substrates enabling charge and energy transfer [20]. These characteristics facilitate uniform desorption and ionization, a major goal in MALDI IMS investigations.
Supplementary Material
Acknowledgments
The project described was supported by Award Number S10RR029517 from the National Center For Research Resources. The content is solely the responsibility of the authors and does not necessarily represent the official views of the National Center For Research Resources or the National Institutes of Health. AFM was performed using an instrument acquired through support from the National Science Foundation under MRI: 1126301. We thank Dr. Alexis Thompson for donation of the rat brain tissue and use of a microtome, and Roger and Beverly Wood for permitting the harvest of soybean leaves.
References
- 1.Zaima N, Matsuyama Y, Setou M. Principal component analysis of direct matrix-assisted laser desorption/ionization mass spectrometric data related to metabolites of fatty liver. Journal of oleo science. 2009;58:267–273. doi: 10.5650/jos.58.267. [DOI] [PubMed] [Google Scholar]
- 2.Morita Y, Ikegami K, Goto-Inoue N, Hayasaka T, Zaima N, Tanaka H, Uehara T, Setoguchi T, Sakaguchi T, Igarashi H, Sugimura H, Setou M, Konno H. Imaging mass spectrometry of gastric carcinoma in formalin-fixed paraffin-embedded tissue microarray. Cancer science. 2010;101:267–273. doi: 10.1111/j.1349-7006.2009.01384.x. [DOI] [PMC free article] [PubMed] [Google Scholar]
- 3.Kruse R, Sweedler JV. Spatial profiling invertebrate ganglia using maldi ms. Journal of the American Society for Mass Spectrometry. 2003;14:752–759. doi: 10.1016/S1044-0305(03)00288-5. [DOI] [PubMed] [Google Scholar]
- 4.Aerni HR, Cornett DS, Caprioli RM. Automated acoustic matrix deposition for maldi sample preparation. Analytical chemistry. 2006;78:827–834. doi: 10.1021/ac051534r. [DOI] [PubMed] [Google Scholar]
- 5.Hankin JA, Barkley RM, Murphy RC. Sublimation as a method of matrix application for mass spectrometric imaging. Journal of the American Society for Mass Spectrometry. 2007;18:1646–1652. doi: 10.1016/j.jasms.2007.06.010. [DOI] [PMC free article] [PubMed] [Google Scholar]
- 6.Dekker LJ, van Kampen JJ, Reedijk ML, Burgers PC, Gruters RA, Osterhaus AD, Luider TM. A mass spectrometry based imaging method developed for the intracellular detection of hiv protease inhibitors. Rapid communications in mass spectrometry : RCM. 2009;23:1183–1188. doi: 10.1002/rcm.3981. [DOI] [PubMed] [Google Scholar]
- 7.Yang J, Caprioli RM. Matrix sublimation/recrystallization for imaging proteins by mass spectrometry at high spatial resolution. Analytical chemistry. 2011;83:5728–5734. doi: 10.1021/ac200998a. [DOI] [PMC free article] [PubMed] [Google Scholar]
- 8.Novoselov KS, Geim AK, Morozov SV, Jiang D, Zhang Y, Dubonos SV, Grigorieva IV, Firsov AA. Electric field effect in atomically thin carbon films. Science. 2004;306:666–669. doi: 10.1126/science.1102896. [DOI] [PubMed] [Google Scholar]
- 9.Dong X, Cheng J, Li J, Wang Y. Graphene as a novel matrix for the analysis of small molecules by maldi-tof ms. Analytical chemistry. 2010;82:6208–6214. doi: 10.1021/ac101022m. [DOI] [PMC free article] [PubMed] [Google Scholar]
- 10.Yuki Sugiura MS. In: Imaging mass spectrometry: Protocols for mass microscopy. Setou M, editor. Springer; New York: 2010. [Google Scholar]
- 11.Li X, Cai W, An J, Kim S, Nah J, Yang D, Piner R, Velamakanni A, Jung I, Tutuc E, Banerjee SK, Colombo L, Ruoff RS. Large-area synthesis of high-quality and uniform graphene films on copper foils. Science (Washington, DC, United States) 2009;324:1312–1314. doi: 10.1126/science.1171245. [DOI] [PubMed] [Google Scholar]
- 12.Wu W, Liu Z, Jauregui LA, Yu Q, Pillai R, Cao H, Bao J, Chen YP, Pei SS. Wafer-scale synthesis of graphene by chemical vapor deposition and its application in hydrogen sensing. Sensors and Actuators, B: Chemical. 2010;150:296–300. [Google Scholar]
- 13.Bae S, Kim H, Lee Y, Xu X, Park JS, Zheng Y, Balakrishnan J, Lei T, Kim HR, Song YI, Kim YJ, Kim KS, Oezyilmaz B, Ahn JH, Hong BH, Iijima S. Roll-to-roll production of 30-inch graphene films for transparent electrodes. Nature Nanotechnology. 2010;5:574–578. doi: 10.1038/nnano.2010.132. [DOI] [PubMed] [Google Scholar]
- 14.Poth AG, Mylne JS, Grassl J, Lyons RE, Millar AH, Colgrave ML, Craik DJ. Cyclotides associate with leaf vasculature and are the products of a novel precursor in petunia (solanaceae) The Journal of biological chemistry. 2012;287:27033–27046. doi: 10.1074/jbc.M112.370841. [DOI] [PMC free article] [PubMed] [Google Scholar]
- 15.Brechenmacher L, Lei Z, Libault M, Findley S, Sugawara M, Sadowsky MJ, Sumner LW, Stacey G. Soybean metabolites regulated in root hairs in response to the symbiotic bacterium Bradyrhizobium japonicum. Plant Physiol. 2009;153:1808–1822. doi: 10.1104/pp.110.157800. [DOI] [PMC free article] [PubMed] [Google Scholar]
- 16.Wu W, Zhang Q, Zhu Y, Lam HM, Cai Z, Guo D. Comparative metabolomic profiling reveals secondary metabolites correlated with soybean salt tolerance. J Agric Food Chem. 2008;56:11132–11138. doi: 10.1021/jf8024024. [DOI] [PubMed] [Google Scholar]
- 17.Hankin JA, Barkley RM, Murphy RC. Sublimation as a method of matrix application for mass spectrometric imaging. J Am Soc Mass Spctrom. 2007;18:1646–1652. doi: 10.1016/j.jasms.2007.06.010. [DOI] [PMC free article] [PubMed] [Google Scholar]
- 18.Yang JH, Caprioli RM. Matrix sublimation/recrystallization for imaging proteins by mass spectrometry at high spatial resolution. Anal Chem. 2011;83:5728–5734. doi: 10.1021/ac200998a. [DOI] [PMC free article] [PubMed] [Google Scholar]
- 19.Schultz BJ, Patridge CJ, Lee V, Jaye C, Lysaght PD, Smith C, Barnett J, Fisher DA, Pendergrast D, Banerjee S. Imaging local electronic corrugations and doped regions in graphene. Nature Commun. 2011;2:372/1–378/8. doi: 10.1038/ncomms1376. [DOI] [PubMed] [Google Scholar]
- 20.Schultz BJ, Dennis RV, Lee V, Banerjee S. An Electronic Structure Perspective of Graphene Interfaces. Nanoscale. 2014;6:3444–3466. doi: 10.1039/c3nr06923k. [DOI] [PubMed] [Google Scholar]
Associated Data
This section collects any data citations, data availability statements, or supplementary materials included in this article.