

Abstract
Background: I examined age patterns and the role of shifting educational distributions in driving trends in educational gradients in life expectancy among non-Hispanic Whites between 1991 and 2005.
Methods: Data were from the 1986–2004 National Health Interview Survey with mortality follow-up through 2006. Life expectancies were computed by sex, period and education. Age decompositions of life expectancy gradients and composition-adjusted life expectancies were computed to account for age patterns and shifting educational distributions.
Results: Life expectancy at age 25 among White men increased for all education groups, decreased among the least-educated White women and increased among White women with college degrees. Much of the decline in measured life expectancy for White women with less than a high school education comes from the 85+ age group. Educational gradients in life expectancy widened for White men and women. One-third of the gradient is due to ages below 50. Approximately 26% (0.7 years) and 87% (0.8 years) of the widening of the gradient in life expectancy between ages 25 and 85 for White women and men is attributable to shifting education distributions. Over half of the decline in temporary life expectancy among the least-educated White women is due to compositional change.
Conclusions: Life expectancy has increased among White men for all education groups and has decreased among White women with less than a high school education, though not to the extent reported in previous studies. The fact that a large proportion of the change in education-specific life expectancy among women is due to the 85+ age group suggests changes in institutionalization may be affecting estimates. Much of the change in education-specific life expectancy and the growth in the educational gradient in life expectancy is due to the shifting distribution of individuals across education categories.
Keywords: Life expectancy, mortality, education, gradients, demography, inequality
Key Messages
Between 1991 and 2005, life expectancy increased among White men across the educational distribution and White women with some college or more, but declined among White women with less than a high-school education.
Most of the change in educational gradients in life expectancy is due to deaths above age 50. At any given time, one-third of the gradient is attributable to deaths below age 50.
Over half of the decline among the least-educated White women and much of the widening of gradients is due to the changing distribution of population across education categories.
Introduction
A wealth of research over the past four decades has documented enduring educational gradients in American mortality.1–4 This line of enquiry has recently led to claims that the widening gradient in mortality now encompasses actual declines in life expectancy among the least-educated non-Hispanic Whites (henceforth Whites) over the past twodecades.5 If true, this could indicate a reversal in life expectancy gains spanning more than a century.
Despite the importance of understanding educational gradients in life expectancy, there remain two limitations in contemporary assessments of these gradients.
First, some studies use dual data sources5—death counts from death certificates and population counts from census data—to calculate education-specific mortality rates. This is problematic when the assumed population at risk does not match the population accumulating deaths.6–8 For example, among those who died in 1989 and were reported as high-school graduates on their death certificates, 38% previously self-reported having less than a high-school education.7 This has previously led to overestimates of changes in mortality gradients for women.6 The National Center for Health Statistics recommends against using dual data sources to compute education-specific mortality estimates above age 64, which is limiting since roughly 84% of deaths occur above this age in the 2008 US life table.9,10 Also, death certificate data are based on a non-random sample of the 50 states since not all states record educational attainment on death certificates.
A better strategy uses survey data linked to mortality follow-up. Such data typically exclude young people living on the margins and older institutionalized persons, but they allow us to make consistent comparisons over time devoid of dual data source bias. However, recent studies using follow-up data report highly variable and often inaccurate mortality estimates or only report hazard ratios without a baseline hazard. Because of these shortcomings, there are no recent and accurate published estimates of education-specific life expectancy at age 25 () for Whites.
A second limitation is that the social categories encompassing the less educated have grown increasingly select. The same education category today represents a lower segment of the socioeconomic stratum than in the past. Even if mortality was reduced at every percentile of the educational distribution, compositional change—changes in the distribution of the population across educational categories—can lead to the conclusion that the educational gradient in life expectancy has widened or that the less educated are worse off today than in the past (see Appendix A, Section 1 for a detailed description of this process, available as Supplementary data at IJE online). Educational upgrading as a health policy could widen the gap in between the lowest and highest education groups simply by making the lowest education category even more select. It could also artificially narrow the gap by making the highest education category less select. If educational differences are used to proxy for inequality, it is more appropriate to use a composition-adjusted measure of education to estimate gradients rather than variable, socially constructed categories like ‘less than high school’ or ‘some college’.3,6,11–14
This article contributes to the debate by computing accurate education-specific life expectancy trends and confidence intervals for Whites from 1990 to 2006 to determine whether life expectancy gradients have widened and whether among the least-educated Whites has actually declined. Previous studies have focused on mortality inequality at older ages, leaving unclear whether younger-age mortality also plays a role.15–19 I decompose gradients and trends into age-specific contributions to determine at which ages the life expectancy disadvantage of the least-educated is concentrated. Finally, I estimate composition-adjusted life expectancy measures to assess the extent to which changes in educational gradients in a are attributable to changing educational composition.
Data and Methods
I use the 1986–2004 waves of the National Health Interview Survey (NHIS),20,21 which are linked to the National Death Index through 2006, to generate a person-quarter-year file. The NHIS is a nationally representative sample survey which is comparable across time and measures mortality among the civilian non-institutionalized US population. There are 811 711 respondents experiencing 67 037 deaths and 4 533 125 person-years of exposure (see Appendix B pages 1–18 for a description of the NHIS data and comparisons with vital statistics data, available as Supplementary data at IJE online). Respondents are left-censored at interview date and right-censored at the earlier of 31 December 2006 or date of death (see Appendix B pages 21–24 for a robustness check using a fixed 5-year follow-up time). Educational attainment was measured as years of schooling completed for survey years before 1997, and as highest degree attained in later survey years. I compute occurrence-exposure ratios for 5-year age intervals to produce period life tables by sex for non-Hispanic Whites in three periods (1990–92, 1997–99 and 2004–06) for those with less than a high-school education, a high-school diploma or general educational development credential (GED), some college, and a college degree or more, since this education categorization has been used in previous studies of educational mortality gradients.5,15,22,23 In addition to , I compute , a measure of the educational gradient in life expectancy defined as the difference in between the less than high school and college or more groups.
I restrict analyses to individuals aged 25 years and older at interview, since college completion often occurs by this age.1 I focus on non-Hispanic Whites because of their larger sample size and because of differential representativeness and poor linkage quality in NHIS for Hispanics and non-Hispanic Blacks relative to Whites.24,25
I decompose educational differences in into age-specific contributions using Arriaga’s decomposition.26 This decomposition takes into account the impact of mortality both within a given age group and on the accumulation of person-years in subsequent age groups and is thus preferable to focusing only on age-specific mortality.27
I also report temporary life expectancy between ages 25 and 85 (), since the NHIS may not be representative of the 85+ population due to greater institutionalization at those ages.
I produce composition-adjusted measures of life expectancy at age 25 for the 1997–99 and 2004–06 periods. Within each age-sex group, I randomly reassign individuals from these periods to adjacent education categories (e.g. a high-school graduate may be reassigned to less than high school) so that the population-weighted age-sex-specific education distributions in each of these periods match the corresponding distributions in 1990–92. I then compute composition-adjusted period life tables by sex for each reassigned education category. This method assumes that reassigned individuals are representative of people who, in earlier times, would have been in the reassigned category (see Appendix A, Section 2, for more detail on the composition adjustment procedure, available as Supplementary data at IJE online).
I also estimate an alternative measure of the life expectancy gradient: the slope index of inequality (SII). The SII is a measure of the average difference in between the least educated (0th percentile) and most educated (100th percentile) individuals in a population and, under a linearity assumption, is impervious to changes in educational composition.6,14
Analyses are conducted in Stata 11. Estimates are adjusted for complex survey design. Confidence intervals are computed using delta method.28,29
Results
Table 1 shows education-specific estimates of for 1990–92, 1997–99 and 2004–06 and estimates of changes between the first and last periods. Among White men, increased from 46.9 to 47.9 years (0.9 year increase) for those with less than high school, from 50.8 to 52.9 years (2.0 year increase) for high-school graduates, from 52.1 to 53.4 years (1.3 year increase) for those with some college and from 55.4 to 58.1 years (2.7 year increase) for college graduates. Among White women, decreased from 55.0 to 51.9 years (3.2 year decline) for those with less than high school, from 58.5 to 57.8 years (0.7 year decline) for high-school graduates and from 60.4 to 59.0 years (1.4 year decline) for those with some college. College graduates experienced an increase from 60.9 to 61.6 years (0.7 year increase).
Table 1.
Life expectancy at age 25 by sex and education for non-Hispanic Whites, 1990–2006
| Males |
Females |
|||||||
|---|---|---|---|---|---|---|---|---|
| 1990–92 | 1997–99 | 2004–06 | ’91-’05 | 1990–92 | 1997–99 | 2004–06 | ’91-’05 | |
| Less than high school | 46.9 | 47.9 | 47.9 | 0.9 | 55.0 | 53.3 | 51.9 | −3.2 |
| [45.9, 47.9] | [47.3, 48.6] | [47.0, 48.7] | [−0.4, 2.3] | [54.1, 55.9] | [52.6, 53.9] | [50.7, 53.1] | [−4.7, −1.7] | |
| High school or GED | 50.8 | 51.8 | 52.9 | 2.0 | 58.5 | 57.5 | 57.8 | −0.7 |
| [50.2, 51.4] | [51.4, 52.3] | [52.5, 53.2] | [1.3, 2.7] | [57.9, 59.0] | [57.1, 58.0] | [57.5, 58.1] | [−1.3, 0.0] | |
| Some college | 52.1 | 52.3 | 53.4 | 1.3 | 60.4 | 59.0 | 59.0 | −1.4 |
| [51.2, 53.1] | [51.5, 53.1] | [52.9, 53.9] | [0.2, 2.4] | [59.5, 61.3] | [58.4, 59.5] | [58.5, 59.6] | [−2.5, −0.3] | |
| College or more | 55.4 | 56.0 | 58.1 | 2.7 | 60.9 | 60.5 | 61.6 | 0.7 |
| [54.6, 56.2] | [55.5, 56.5] | [57.7, 58.5] | [1.8, 3.6] | [59.8, 61.9] | [59.9, 61.0] | [61.1, 62.0] | [−0.4, 1.8] | |
| 8.5 | 8.1 | 10.2 | 1.7 | 5.8 | 7.2 | 9.7 | 3.9 | |
| [7.2, 9.8] | [7.3, 8.9] | [9.3, 11.2] | [0.1, 3.3] | [4.4, 7.2] | [6.3, 8.1] | [8.4, 11.0] | [2.0, 5.7] | |
| Slope index of inequality | 9.8 | 8.7 | 10.6 | 0.7 | 7.0 | 7.6 | 9.2 | 2.2 |
| [8.4, 11.3] | [7.7, 9.6] | [9.7, 11.5] | [−1.0, 2.4] | [5.5, 8.5] | [6.7, 8.5] | [8.1, 10.2] | [0.3, 4.0] | |
Source: author’s calculations based on NHIS 1986–2004. ’91-’05 indicates change between the 1990–92 period and the 2004–06 period. refers to the life expectancy of the ‘college or more’ group less the life expectancy of the ‘less than high school’ group. The slope index of inequality is the estimated difference in life expectancy between ages 25 and 85 between the least educated (0th percentile) and the most educated (100th percentile). Approximate 95% confidence intervals are given in brackets.
In addition to life expectancy, the NHIS-based estimates allow us to assess educational gradients in that are not subject to dual data source bias. Table 1 indicates that among men, was 8.5 years in 1991 and widened to 10.2 years by 2005. For women, was 5.8 years in 1991 and widened to 9.7 years by 2005. The gap thus widened by 1.7 years for men and 3.9 years for women over the 14-year period between 1991 and 2005. Using the SII, an alternative measure of life expectancy gradients that takes into account compositional change, I find that the gradient in life expectancy between the least and most educated widened by 0.7 years for men and 2.2 years for women.
Table 2 shows that these values are higher than those reported in a previous study using dual data sources,5 except for the ‘Some College’ group for whom they are lower. The Olshansky et al. estimates also show a decline in among White men with less than high school that is not replicated in the NHIS-based estimates. The NHIS-based estimates indicate a widening in that is 6.4 and 4.7 years smaller than the widening reported by Olshansky et al. for White men and women, respectively.
Table 2.
Comparison of educational differentials in life expectancy at age 25: Estimates based on the National Health Interview Survey (NHIS) 1986–2004 vs estimates from Olshansky et al. 2012 (MCD) 1990–2008, non-Hispanic White males and females
| Males | Early 1990s |
Late 1990s |
Mid 2000s |
||||||
|---|---|---|---|---|---|---|---|---|---|
| 1990 (MCD) | 1991 (NHIS) | Difference | 2000 (MCD) | 1998 (NHIS) | Difference | 2008 (MCD) | 2005 (NHIS) | Difference | |
| Less than high school | 47.0 | 46.9 | 0.1 | 45.3 | 47.9 | −2.6 | 43.6 | 47.9 | −4.3 |
| High school or GED | 46.5 | 50.8 | −4.3 | 47.9 | 51.8 | −3.9 | 48.2 | 52.9 | −4.7 |
| Some college | 53.5 | 52.1 | 1.4 | 55.0 | 52.3 | 2.7 | 55.3 | 53.4 | 1.9 |
| College or nore | 52.1 | 55.4 | −3.3 | 54.7 | 56.0 | −1.3 | 56.7 | 58.1 | −1.4 |
| 5.1 | 8.5 | −3.4 | 9.4 | 8.1 | 1.3 | 13.2 | 10.2 | 3.0 | |
| Females | Early 1990s |
Late 1990s |
Mid 2000s |
||||||
|---|---|---|---|---|---|---|---|---|---|
| 1990 (MCD) | 1991 (NHIS) | Difference | 2000 (MCD) | 1998 (NHIS) | Difference | 2008 (MCD) | 2005 (NHIS) | Difference | |
| Less than High School | 54.5 | 55.0 | −0.5 | 51.4 | 53.3 | −1.9 | 49.2 | 51.9 | −2.7 |
| High School or GED | 53.6 | 58.5 | −4.9 | 53.8 | 57.5 | −3.7 | 54.0 | 57.8 | −3.8 |
| Some College | 58.2 | 60.4 | −2.2 | 58.9 | 59.0 | −0.1 | 59.2 | 59.0 | 0.2 |
| College or More | 56.4 | 60.9 | −4.5 | 58.4 | 60.5 | −2.1 | 59.7 | 61.6 | −1.9 |
| 1.9 | 5.8 | −3.9 | 7.0 | 7.2 | −0.2 | 10.5 | 9.7 | 0.8 | |
Source: estimates for 1990, 2000 and 2008 come from Olshansky et al.’s (2012) Appendix Exhibit A7 and are based on data from the Multiple Cause of Death file and the American Community Survey. Estimates for 1991, 1998 and 2005 are the author’s calculations using the National Health Interview Survey (1986–2004) linked to mortality follow-up through 31 December 2006. is defined as the difference in between those with less than high school and those with college or more.
Figure 1 plots age decompositions of gradients, which indicate that almost all of the widening in life expectancy gradients for White men can be attributed to ages above 50. For White women, this figure is four-fifths. At any given time, however, roughly one-third of the life expectancy gradient for both White men and women can be attributed to ages below 50. Figure 2 plots age decompositions of education-specific changes in in 1991–2005. For men, much of the increase is concentrated in the prime ages for mortality—60–84 years. The 85+ age group accounts for 40–100% of the decline in for White women in the lower three education groups. This large age-specific contribution could be due to actual mortality changes or to changes in patterns of old-age institutionalization (see Appendix B, pp. 19–20, available as Supplementary data at IJE online).30 If the latter process were operating, NHIS-based estimates for 85+ mortality would not be comparable over time. To address this possibility, I estimate temporary life expectancy between ages 25 and 85, which is less affected by old-age institutionalization.
Figure 1.

Age decompositions of difference in life expectancy at age 25 between high school non-completers and college graduates, non-Hispanic White males and females, 1990–2006.
Source: author’s calculations based on NHIS 1986–2004 with mortality follow-up through 2006. Bars in each graph sum to the total sex and period-specific difference in life expectancy at age 25 between those with less than high school and those with college or more; LTHS and C+ are life expectancies for the less than high school and college or more groups, respectively, and is the difference in life expectancy at age 25 between these two groups.
Figure 2.

Age decompositions of changes in education-specific life expectancy at age 25 by sex, non-Hispanic Whites, 1991–2005.
Source: author’s calculations based on NHIS 1986–04 with mortality follow-up through 2006. Bars in each graph sum to the total sex and education-specific change in life expectancy at age 25; ’91 and ’05 are life expectancies in 1991 and 2005, respectively, and is the change in life expectancy at age 25 between 1991 and 2005.
Table 3 shows estimates by education for each of the three time periods under examination and estimates of changes in between the first and last periods. Among White men, increased from 45.7 to 46.5 years (0.8 year increase) for those with less than high school, from 49.1 to 50.6 years (1.5 year increase) for high-school graduates, from 49.7 to 51.1 years (1.4 year increase) for those with some college and from 52.4 to 54.1 years (1.7 year increase) for college graduates. Among White women, decreased from 50.7 to 49.2 years (1.4 year decline) for those with less than high school and from 53.5 to 53.4 years (0.2 year decline) for high-school graduates; remained unchanged at 54.1 years for those with some college. White female college graduates experienced an increase from 54.5 to 56.0 years (1.5 year increase).
Table 3.
Life expectancy between ages 25 and 85 by sex and education for non-Hispanic Whites, 1990–2006
|
Males |
Females |
|||||||
|---|---|---|---|---|---|---|---|---|
| 1990–92 | 1997–99 | 2004–06 | ’91-’05 | 1990–92 | 1997–99 | 2004–06 | ’91-’05 | |
| Less than high school | 45.7 | 46.8 | 46.5 | 0.8 | 50.7 | 50.4 | 49.2 | −1.4 |
| [44.7, 46.7] | [46.2, 47.4] | [45.6, 47.4] | [−0.5, 2.1] | [49.8, 51.6] | [49.7, 51.0] | [48.0, 50.4] | [−2.9, 0.1] | |
| High school or GED | 49.1 | 49.9 | 50.6 | 1.5 | 53.5 | 53.2 | 53.4 | −0.2 |
| [48.5, 49.7] | [49.5, 50.3] | [50.2, 51.0] | [0.8, 2.2] | [53.0, 54.1] | [52.8, 53.6] | [53.0, 53.7] | [−0.8, 0.5] | |
| Some college | 49.7 | 50.2 | 51.1 | 1.4 | 54.1 | 54.0 | 54.1 | 0.0 |
| [48.8, 50.7] | [49.4, 50.9] | [50.6, 51.6] | [0.3, 2.5] | [53.2, 55.0] | [53.5, 54.6] | [53.6, 54.7] | [−1.1, 1.1] | |
| College or more | 52.4 | 53.0 | 54.1 | 1.7 | 54.5 | 55.2 | 56.0 | 1.5 |
| [51.6, 53.2] | [52.5, 53.5] | [53.7, 54.5] | [0.8, 2.6] | [53.4, 55.5] | [54.6, 55.7] | [55.5, 56.4] | [0.4, 2.6] | |
| 6.7 | 6.2 | 7.6 | 0.9 | 3.8 | 4.8 | 6.7 | 2.9 | |
| [5.4, 8.0] | [5.4, 7.0] | [6.6, 8.6] | [−0.7, 2.5] | [2.5, 5.2] | [3.9, 5.7] | [5.5, 8.0] | [1.0, 4.8] | |
| Slope index of inequality | 7.6 | 6.3 | 7.3 | −0.3 | 4.0 | 4.6 | 5.8 | 1.8 |
| [6.1, 9.1] | [5.4, 7.2] | [6.5, 8.2] | [−2.0, 1.4] | [2.5, 5.6] | [3.6, 5.5] | [4.9, 6.7] | [−0.0, 3.5] | |
Source: author’s calculations based on NHIS 1986–2004. ’91-’05 indicates change between the 1990–92 period and the 2004–06 period. refers to the life expectancy of the ‘College or more’ group less the life expectancy of the ‘less than high school’ group. The slope index of inequality is the estimated difference in life expectancy between ages 25 and 85 between the least educated (0th percentile) and the most educated (100th percentile). Approximate 95% confidence intervals are given in brackets.
Table 3 indicates that among men, for temporary life expectancy was 6.7 years in 1991 and widened to 7.6 years by 2005. For women, for temporary life expectancy was 3.8 years in 1991 and widened to 6.7 years by 2005. The gap thus widened by 0.9 years for men and 2.9 years for women between 1991 and 2005. Using the SII, I find that the gradient in life expectancy between the least and most educated narrowed by 0.3 years for men and widened by 1.8 years for women.
Figure 3 shows age-education distributions of the White population by sex and period. The most striking feature of this figure is the shrinking share of the less than high school group as a proportion of the population. The less than high school and high-school graduate groups have grown smaller and more select and the some college and college or more groups have grown larger and potentially less select between 1990 and 1992 and 2004 and 2006. This is particularly the case at ages where mortality rates are highest. The next set of results addresses this compositional change by computing composition-adjusted life expectancies and gradients.
Figure 3.
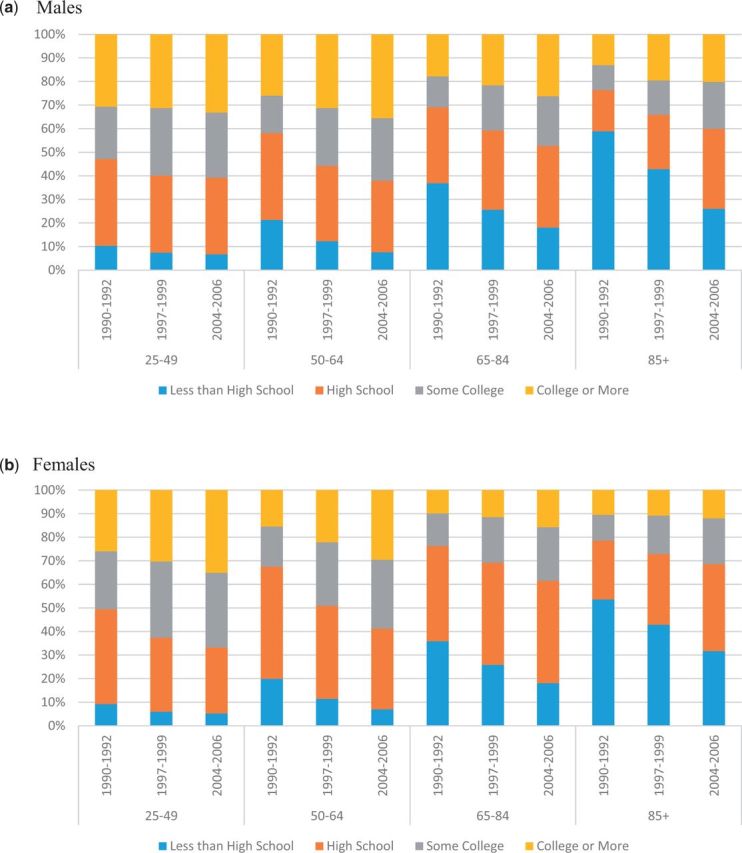
Education distribution by age, sex, and period, non-Hispanic Whites, NHIS 1990–2006.
Source: author’s calculations based on NHIS 1990–92, 1997–99 and 2004–06.
Table 4 presents the estimates of composition-adjusted life expectancy between ages 25 and 85 () for each of the three periods under analysis (see Appendix B, pp. 25–26 for estimates of composition-adjusted , available as Supplementary data at IJE online). It also presents estimates of changes in between the first and last periods. Among White men, i increased from 45.7 to 47.3 years (1.6 year increase) for those with less than high school, from 49.1 to 50.7 years (1.5 year increase) for high-school graduates, from 49.7 to 51.5 years (1.8 year increase) for those with some college and from 52.4 to 54.1 years (1.8 year increase) for college graduates. Among White women, decreased from 50.7 to 50.0 years (0.7 year decline) for those with less than high school, remained constant at 53.5 years for high-school graduates and increased from 54.1 to 54.5 years (0.4 year increase) for those with some college and from 54.5 to 56.0 years (1.5 year increase) for college graduates.
Table 4.
Composition-adjusted life expectancy between ages 25 and 85 by sex and education for non-Hispanic Whites, 1990–2006
| Males |
Females |
|||||||
|---|---|---|---|---|---|---|---|---|
| 1990–1992 | 1997–1999 | 2004–2006 | ’91-’05 | 1990–1992 | 1997–1999 | 2004–2006 | ’91-’05 | |
| Less than high school | 45.7 | 47.1 | 47.3 | 1.6 | 50.7 | 50.7 | 50.0 | −0.7 |
| [44.7, 46.7] | [46.5, 47.7] | [46.5, 48.1] | [0.4, 2.9] | [49.8, 51.6] | [50.1, 51.4] | [48.9, 51.1] | [−2.1, 0.7] | |
| High school or GED | 49.1 | 50.0 | 50.7 | 1.5 | 53.5 | 53.3 | 53.5 | 0.0 |
| [48.5, 49.7] | [49.6, 50.4] | [50.3, 51] | [0.8, 2.2] | [53, 54.1] | [52.8, 53.7] | [53.2, 53.8] | [−0.6, 0.6] | |
| Some college | 49.7 | 50.1 | 51.5 | 1.8 | 54.1 | 54.2 | 54.5 | 0.4 |
| [48.8, 50.7] | [49.3, 50.9] | [51, 52.1] | [0.7, 3.0] | [53.2, 55] | [53.6, 54.8] | [53.9, 55.1] | [−0.7, 1.5] | |
| College or more | 52.4 | 53.0 | 54.1 | 1.8 | 54.5 | 55.1 | 56.0 | 1.5 |
| [51.6, 53.2] | [52.5, 53.6] | [53.7, 54.5] | [0.8, 2.7] | [53.4, 55.5] | [54.5, 55.7] | [55.5, 56.5] | [0.4, 2.6] | |
| 6.7 | 6.0 | 6.8 | 0.1 | 3.8 | 4.3 | 6.0 | 2.2 | |
| [5.4, 8.0] | [5.1, 6.8] | [5.9, 7.7] | [−1.5, 1.7] | [2.5, 5.2] | [3.5, 5.2] | [4.8, 7.2] | [0.3, 4.0] | |
| Slope index of inequality | 7.6 | 6.7 | 7.9 | 0.3 | 4.0 | 4.8 | 6.5 | 2.5 |
| [6.1, 9.1] | [5.7, 7.7] | [6.9, 8.9] | [−1.5, 2.1] | [2.5, 5.6] | [3.9, 5.8] | [5.3, 7.7] | [0.5, 4.4] | |
Source: author’s calculations based on NHIS 1986–2004. ’91-’05 indicates change between the 1990–92 period and the 2004–06 period. refers to the life expectancy of the ‘college or more’ group less the life expectancy of the ‘less than high school’ group. The slope index of inequality is the estimated difference in life expectancy between ages 25 and 85 between the least educated (0th percentile) and the most educated (100th percentile). Approximate 95% confidence intervals are given in brackets.
Among men, for w was 6.7 years in 1991 and widened to 6.8 years by 2005. For women, for w was 3.8 years in 1991 and widened to 6.0 years by 2005. The gap thus widened by 0.1 years for men and 2.2 years for women between 1991 and 2005. The SII increased by 0.3 and 2.5 years for White men and women, respectively.
Discussion
This article contributes several findings to the debate over life expectancy gradients in the past two decades. Life expectancy has increased among White men across the socioeconomic spectrum and for the most-educated White women, but has declined for the least-educated White women. Educational gradients in life expectancy have also widened for women far more than for men. In a recent study, Olshansky et al.5 report that educational gradients in life expectancy widened by 8.1 and 8.6 years and that life expectancy among the least-educated declined by 3.4 and 5.3 years for White men and women, respectively. By contrast, my estimates show that gradients widened by only 1.7 and 3.9 years for White men and women, life expectancy increased for the least-educated White men and the decrease in life expectancy for the least-educated White women was 3.2 years. Part of the discrepancy between these estimates lies in the types of data used—the Olshansky et al. study relied on data which are non-representative and are subject to dual data source bias. This results in downward-biased mortality estimates for the least-educated group, and could generate the above pattern if the bias dramatically diminished over time. The data used in this study are representative of the non-institutionalized population and are not subject to numerator-denominator biases.
Whereas the growth in the gradient has come mostly from ages above 50, roughly one-third of the gradient at any given time is due to ages 25–49. Recent studies have concentrated on mortality above age 45 or 50, where the cause of death profile differs from that at younger ages.15–17,19 The age decompositions in this article suggest that causes of death more prevalent at younger ages may also play a role in maintaining socioeconomic gradients and merit greater attention in future research.
Another concern with temporal comparisons of educational gradients in mortality is compositional change. As the education distribution shifts rightward over time, the worry is that a given education category comes to represent a lower SES group. I address this possibility by estimating both composition-adjusted life temporary life expectancies and slope indices of inequality. I focus on temporary life expectancies because I find evidence suggesting that changing patterns of old-age institutionalization may be driving artefactual changes in mortality above age 85. These two independent methods of accounting for compositional change produce highly consistent estimates of the magnitudes of and trends in educational gradients in mortality. I find that compositional change explains 53% of the decline in temporary life expectancy for the least-educated White women, and, for White men and women respectively, 87% and 26% of the widening in life expectancy gradients. These numbers reflect dramatic changes in educational attainment over the 20th century. For example, the ‘high-school movement’ of the 1920s made high-school completion the new modal category.31 People in later cohorts who did not complete high school were a more negatively selected group than those who did not complete high school in earlier cohorts. These results suggest that compositional change explains much, but not all, of the steepening of educational gradients in life expectancy.
The gradient has grown much more quickly for women than for men, though the magnitude of the gradient is still larger for men. Part of the explanation for the convergence of the female gradient towards the male gradient is the differential timing of the emergence of socioeconomic status (SES) gradients in smoking. SES differences in smoking emerged much earlier for men than for women, and for women the emergence of the gradient was more rapid. This is consistent with a recent study which finds that smoking explains half of the recent widening of the educational gradient in life expectancy for women but not for men.19 Another factor that may explain the faster steepening among women is the fact that education has only recently become a reliable marker of SES for women. Education used to be a very noisy measure of SES for women relative to men. As education became increasingly aligned with SES for women, that noise dissipated, causing the relationship between education and mortality to grow stronger for women relative to men.
Whereas this article presents new estimates that do not suffer from the drawbacks of prior studies, it presents its own limitations. Using NHIS results in underestimates of early-adult and old-age mortality. The composition-adjusted measures rely on assumptions which may not always hold and are not easily tested. Finally, because of poor linkage quality this study does not consider mortality among non-White racial/ethnic groups.
That compositional change plays a central role in explaining changing educational gradients in life expectancy suggests the need for novel measures of socioeconomic inequalities in mortality.11–13 Failure to account for compositional change may result in policy recommendations yielding unexpected results. Educational upgrading as a health policy may actually widen measured educational gradients in life expectancy by leaving the least-educated group increasingly negatively select. Still, compositional change does not fully account for the alarming life expectancy declines among the least-educated White women and stagnation among high school-educated women. This trend is heretofore unseen in other high-income countries, suggesting a need for policies in the USA addressing high mortality among the less advantaged.
Supplementary Data
Supplementary data are available at IJE online.
Funding
This work was supported by the National Institute on Aging [T32 AG000177] >and the National Institute of Child Health and Human Development [T32 HD007242].
Supplementary Material
Acknowledgements
Thanks to Sam Preston, Irma Elo, Michel Guillot, Jessica Ho, Iliana Kohler, Jennifer Montez, Emilio Parrado and participants in the Penn Demography Club and Penn Population Studies Center Colloquium for helpful comments and suggestions.
Conflict of interest: None declared.
References
- 1.Elo I, Preston S. Educational differentials in mortality: United States, 1979–1985. Soc Sci Med 1996;42:47–57. [DOI] [PubMed] [Google Scholar]
- 2.Kitagawa EM, Hauser PM. Differential Mortality in the United States: A Study in Socioeconomic Epidemiology . Cambridge, MA: Harvard University Press, 1973. [Google Scholar]
- 3.Meara ER, Richards S, Cutler DM. The gap gets bigger: changes in mortality and life expectancy, by education, 1981–2000. Health Aff (Millwood) 2008;27:350–60. [DOI] [PMC free article] [PubMed] [Google Scholar]
- 4.Miech R, Pampel F, Kim J, Rogers RG. The enduring association between education and mortality: the role of widening and narrowing disparities. Am Sociol Rev 2011;78:913–34. [DOI] [PMC free article] [PubMed] [Google Scholar]
- 5.Olshansky SJ, Antonucci T, Berkman L, et al. Differences in life expectancy due to race and educational differences are widening, and many may not catch up. Health Aff (Millwood) 2012;31:1803–13. [DOI] [PubMed] [Google Scholar]
- 6.Preston S, Elo I. Are educational differentials in adult mortality increasing in the United States? J Aging Health 1995;7:476–96. [DOI] [PubMed] [Google Scholar]
- 7.Sorlie PD, Johnson NJ. Validity of education information on the death certificate. Epidemiology 1996;7:437–39. [DOI] [PubMed] [Google Scholar]
- 8.Rostron BL, Boies JL, Arias E. Education reporting and classification on death certificates in the United States. Vital Health Stat 2010;2:1–21. [PubMed] [Google Scholar]
- 9.Miniño AM, Murphy SL, Xu J, Kochanek KD. Deaths: final data for 2008. Natl Vital Stat Rep 2011;59:1–126. [PubMed] [Google Scholar]
- 10.Arias E. United States Life Tables, 2008. Natl Vital Stat Rep 2012;61:1–63. [PubMed] [Google Scholar]
- 11.Begier B, Li W, Maduro G. Life expectancy among non-high school graduates. Health Aff (Millwood) 2013;32:822. [DOI] [PubMed] [Google Scholar]
- 12.Preston SH. When people behave badly. Epidemiology 2014;25:191–93. [DOI] [PubMed] [Google Scholar]
- 13.Dowd JB, Hamoudi A. Is life expectancy really falling for groups of low socio-economic status? Lagged selection bias and artefactual trends in mortality. Int J Epidemiol 2014;43:983–88. [DOI] [PubMed] [Google Scholar]
- 14.Pamuk ER. Social class inequality in mortality from 1921 to 1972 in England and Wales. Popul Stud (NY) 1985;39:17–31. [DOI] [PubMed] [Google Scholar]
- 15.Montez JK, Zajacova A. Trends in mortality risk by education level and cause of death among US White women from 1986 to 2006. Am J Public Health 2013;103:473–79. [DOI] [PMC free article] [PubMed] [Google Scholar]
- 16.Crimmins EM, Preston SH, Cohen B. (eds); Panel on Understanding Divergent Trends in Longevity in High-Income Countries, Committee on Population D of B and SS and E. International Differences in Mortality at Older Ages . Washington, DC: National Academies Press, 2010. [PubMed] [Google Scholar]
- 17.Crimmins EM, Preston SH, Cohen B. Explaining Divergent Levels of Longevity in High-Income Countries. Washington, DC: National Academies Press, 2011. [PubMed] [Google Scholar]
- 18.Montez JK, Berkman LF. Trends in the educational gradient of mortality among US adults aged 45 to 84 years: bringing regional context into the explanation. Am J Public Health 2014;104:e82–90. [DOI] [PMC free article] [PubMed] [Google Scholar]
- 19.Ho JY, Fenelon A. The contribution of smoking to educational gradients in U.S. life expectancy. J Health Soc Behav 2015; (Forthcoming). [DOI] [PMC free article] [PubMed] [Google Scholar]
- 20.Minnesota Population Center and State Health Access Data Assistance Center. Integrated Health Interview Series: Version 5.0. Minneapolis, MO: University of Minnesota, 2012. [Google Scholar]
- 21.National Center for Health Statistics Office of Analysis and Epidemiology. The National Health Interview Survey (1986–2004) Linked Mortality Files, Mortality Follow-Up Through 2006: Matching Methodology. Hyattsville, MD; NCHS, 2009. [Google Scholar]
- 22.Montez JK, Hummer RA, Hayward MD, Woo H, Rogers RG. Trends in the educational gradient of U.S. adult mortality from 1986 to 2006 by race, gender, and age group. Res Aging 2011;33:145–71. [DOI] [PMC free article] [PubMed] [Google Scholar]
- 23.Montez JK, Zajacova A. Explaining the widening education gap in mortality among U.S. White women. J Health Soc Behav 2013;54:165–81. [DOI] [PMC free article] [PubMed] [Google Scholar]
- 24.Liao Y, Cooper RS, Cao G, et al. Mortality patterns among adult Hispanics: Findings from the NHIS, 1986 to 1990. Am J Public Health 1998;88:227–32. [DOI] [PMC free article] [PubMed] [Google Scholar]
- 25.Lariscy JT. Differential record linkage by Hispanic ethnicity and age in linked mortality studies: implications for the epidemiologic paradox. J Aging Health 2011;23:1263–84. [DOI] [PMC free article] [PubMed] [Google Scholar]
- 26.Arriaga EE. Measuring and explaining the change in life expectancies. Demography 1984;21:83–96. [PubMed] [Google Scholar]
- 27.Preston SH, Heuveline P, Guillot M. Demography: Measuring and Modeling Population Processes . Malder, MA: Blackwell, 2001. [Google Scholar]
- 28.Chiang CL. The Life Table and Its Applications. Malabar, FL: Robert E Krieger, 1984. [Google Scholar]
- 29.Greene WH. Econometric Analysis . Sixth edn. Upper Saddle River, NJ: Pearson Prentice Hall, 2008. [Google Scholar]
- 30.He W, Muenchrath MN. 90+ in the United States: 2006–008. American Community Survey Reports. Washington, DC; U.S. Government Printing Office, 2011. [Google Scholar]
- 31.Goldin C. America’s graduation from high school: the evolution and spread of secondary schooling in the twentieth century. J Econ Hist 1998;58:345–74. [Google Scholar]
Associated Data
This section collects any data citations, data availability statements, or supplementary materials included in this article.