

Abstract
Aversive experiences can lead to complex behavioral adaptations including increased levels of anxiety and fear generalization. The neuronal mechanisms underlying such maladaptive behavioral changes, however, are poorly understood. Here, using a combination of behavioral, physiological and optogenetic approaches in mouse, we identify a specific subpopulation of central amygdala neurons expressing protein kinase C δ (PKCδ) as key elements of the neuronal circuitry controlling anxiety. Moreover, we show that aversive experiences induce anxiety and fear generalization by regulating the activity of PKCδ+ neurons via extrasynaptic inhibition mediated by α5 subunit-containing GABAA receptors. Our findings reveal that the neuronal circuits that mediate fear and anxiety overlap at the level of defined subpopulations of central amygdala neurons and demonstrate that persistent changes in the excitability of a single cell type can orchestrate complex behavioral changes.
Introduction
Anxiety disorders comprise a very prevalent and complex set of pathologies associated with inappropriate fear reactions in response to specific stimuli, but also with less specific, more generalized states of apprehension and vigilance, i.e. anxiety1. The terms fear and anxiety refer to two ethologically different defensive behavioral programs. Studies in rodents indicate that depending on the physical distance to a predator, acute fear responses or more sustained anxiety behavior are observed1, 2. When presented with an immediate, imminent and predictable threat, rodents respond with acute freezing, flight or fight responses. In contrast, situations providing unspecific and diffuse cues for threat predictions, such as contextual stimuli or brightly illuminated and unprotected spaces, promote sustained avoidance and risk assessment behavior1. As a consequence, in animals and in humans, anxiety states are often associated with fear generalization3, 4, i.e. the generation of acute fear responses to stimuli, which do not predict an aversive outcome.
The neuronal circuits underlying the acquisition and expression of acute fear responses have been extensively studied using classical auditory fear conditioning as a model paradigm5, in which animals learn to associate an initially neutral conditioned stimulus (CS; a tone) with an aversive unconditioned stimulus (US; a foot shock). These studies indicate that the acquisition of conditioned fear responses depends on activity-dependent plasticity in the lateral (LA) and central (CEA) nuclei of the amygdala. The expression of acute fear responses depends on output projections from the CEA to downstream targets in the brain stem including the periaqueductal gray (PAG)5.
Recent studies combining mouse genetics and viral expression techniques with in vivo electrophysiological, pharmacogenetic and optogenetic approaches have begun to shed light on the exquisite anatomical and functional organisation of the neuronal circuitry mediating and controlling the acquisition, expression, and extinction of conditioned fear responses5,6. In the CEA, for instance, distinct cell types have been identified based on functional and genetic criteria7-11. In the lateral subdivision of CEA (CEl), PKCδ+ neurons exhibit inhibitory CS responses (CSoff responses)8,9. PKCδ+ neurons receive local inhibitory inputs from CS-activated PKCδ- neurons and in turn make inhibitory synaptic connections onto PAG-projecting CEA output neurons thereby gating acute CEA output through dis-inhibition8,9.
In contrast to fear circuits, the neuronal circuitry mediating sustained anxiety is poorly understood6. In vivo pharmacological and behavioural studies suggest an important role for the so-called “extended amygdala”, an extensively interconnected system comprising the bed nucleus of the stria terminalis (BNST), the CEA, and parts of the basal forebrain12. Even though it has been suggested that acute fear and sustained anxiety responses are mediated by separate neuronal systems, strong anatomical connections between the CEA and the BNST exist, and anxiety behavior can be regulated by optogenetic manipulations of both basolateral amygdala (BLA) and BNST12-14 inputs to the CEA. In vivo single unit recordings in the CEA showed that fear conditioning induced increases in the spontaneous activity of CSoff neurons, which largely overlap with PKCδ+ neurons, strongly correlate with fear generalization8,9, a hallmark of anxiety states. This suggests that CEA PKCδ+ neurons might not only be involved in gating acute conditioned fear responses, but also in mediating sustained states of anxiety. However, the causal contribution of PKCδ+ neuron activity to fear generalization and the underlying mechanism of their change in firing behavior remains unknown.
Results
PKCδ+ neurons regulate anxiety behavior
Fear generalization often correlates with states of anxiety4. Consistent with this, 24 hours after differential fear conditioning, we found a negative correlation between fear generalization and time spent on the open arms of the Elevated Plus Maze (EPM), a standard behavioral test of rodent anxiety (Fig. 1)13-15.
Figure 1.

Fear conditioning enhances anxiety. a, Schematic illustrating the experimental paradigm. Animals were exposed to five CSs or five CS-US pairings. Twenty four hrs later, anxiety behavior was assessed on the EPM, and fear generalization was quantified in a retrieval test carried out in a novel context. b, Freezing values (percent of time) of the two experimental groups (CS only, n =11 mice, and CS-US, n =12 mice) during CS+ and CS- exposure. ***P < 0.001, paired t-test for the CS-US group, t = 8.599, 11 degree of freedom. c, Left, Example EPM trajectories of animals previously exposed to CS only or to CS-US pairings. Right, Animals subjected to CS-US pairings (n = 12 mice) exhibit enhanced anxiety behavior on the EPM as compared to animals exposed to CS only (n = 11 mice; ***P < 0.001, Mann-Whitney rank sum unpaired t-test). d, Overall EPM track length is the same for CS only and CS-US groups (P = 0.865, unpaired t-test, t = 0.144, 21 degrees of freedom). e, Regression analysis reveals a significant correlation between EPM anxiety behavior and fear generalization for individual animals. White symbols represent values from individual animals. Black symbols represent binned averages of animals exhibiting different levels of fear generalization (0-0.2, 0.2-0.4, and > 0.4). Linear regression: R = 0.6, P = 0.003, n = 12 mice (CS-US group). f, There was no correlation between EPM anxiety behavior and freezing to the CS+ and CS- for the CS only group (n = 11 mice, CS only group; freezing to the CS- vs. time spent in open arms: R = 0.298, P = 0.260; freezing to the CS+ vs. time spent in open arms: R = 0.287, P = 0.335. White symbols represent values from individual animals. All error bars indicate mean ± s.e.m.
To test whether rapid and reversible modulation of the spontaneous activity of PKCδ+ neurons in vivo is sufficient to drive changes in fear generalization, we used an optogenetic approach. PKCδ-Cre mice were bilaterally injected with conditional recombinant adeno-associated virus (rAAV) vectors expressing either Channelrhodopsin 2 (ChR2) or Archaerhodopsin (ARCH) in a Cre-dependent manner (Fig. 2a-i; Supplementary Fig. 1). Four to five weeks after injection, mice underwent discriminative fear conditioning using a tone (CS+) paired with footshock (US) and another, non-reinforced tone (CS-) (Fig. 2j-k). Twenty-four hours later, retrieval of fear memory, assessed by tone-induced freezing behavior, was tested in the presence or absence of a constant 30 s light pulse, which induced a marked and sustained increase in the firing rate of PKCδ+ neurons (Fig. 2; Supplementary Fig. 1). We found that consistent with the previously observed correlation between fear generalization and activity of PKCδ+ neurons8, blue light stimulation of PKCδ+ neurons increased fear generalization, calculated as the ratio of CS- and CS+ freezing (Fig. 2k).
Figure 2.
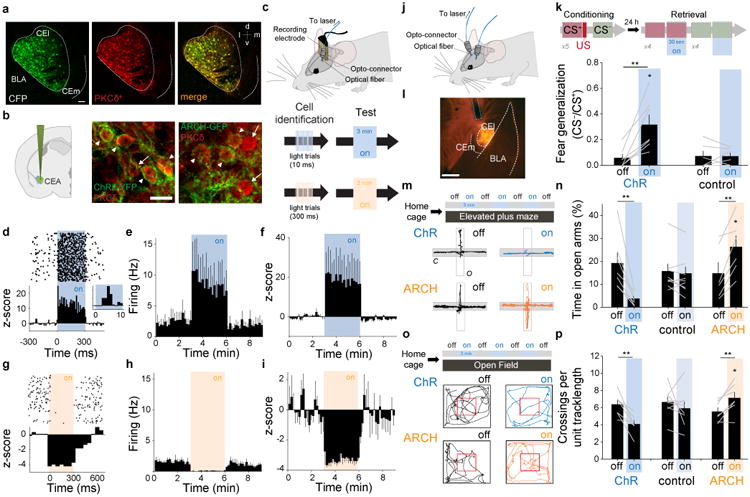
Bi-directional regulation of fear generalization and anxiety through optogenetic control of CEA PKCδ+ neurons. a, Stainings for Cyan Fluorescence Protein (CFP, green) and endogenous PKCδ(red) confirm overlap of CFP with endogenous PKCδ (98% CFP+ cells were PKCδ+; 100% PKCδ+ cells were CFP+). White dashed lines denote the contour of CEA (CEl and CEm). b, Left, Representative cartoon illustrating the injection of conditional AAVs expressing ChR2-YFP or ARCH-GFP into CEA. Middle, Overlap of endogenous PKCδ (red) and ChR2-YFP (green). Right, Overlap of endogenous PKCδ (red) and ARCH-GFP (green). Arrows indicate cells with overlap, red triangles point to cells stained only for PKCδ. Scale bar: 20 μm. c, Top, Experimental configuration illustrating in vivo optrode implants; Bottom, Light-responsive units were identified using 300 ms light pulses followed by 3 min continued test stimulations as used during behavioral experiments. d, Top, Raster plot illustrating firing of an identified ChR2-expressing PKCδ+ neuron before, during and after 300 ms blue light stimulation; Bottom, PSTH of the z-score shows a marked increase in firing during the 300 ms light pulse. Inset, z-score of the short-latency light-induced responses. e, Rate histogram average before, during and after 3 min light stimulation on identified ChR2-expressing PKCδ+ neurons (n = 5 cells/2 mice). f, z-score histogram illustrating increased firing of ChR2-expressing PKCδ+ neurons during 3 min light stimulation (n = 5 cells/2 mice). g, Top, Raster plot illustrating firing of an identified ARCH-expressing PKCδ+ neuron before, during and after 300 ms yellow light stimulation; Bottom, PSTH of the z-score shows a marked decrease in firing during the 300 ms light pulse. h, Rate histogram average before, during and after 3 min light stimulation on identified ARCH-expressing PKCδ+ neurons (n = 6 cells/3 mice). i, z-score histogram illustrating increased firing of ARCH-expressing PKCδ+ neurons during 3 min light stimulation (n = 6 cells/3 mice). All error bars indicate mean ± s.e.m. j, Schematic representation of a freely moving mouse bilaterally implanted with optical fibers after injection of DIO-AAVs expressing either ChR2 or ARCH. k, Coronal sections of a mouse brain indicating the location of CEA and the expression of a conditional rAAV expressing ChR2 and mCherry. White dashed lines indicate anatomical boundaries of BLA, CEl and CEm. The blue dashed line indicates the insertion of the optical fiber. Scale bar: 500 μm. l, Top, Schematic of the experimental paradigm. Bottom, Bar graph illustrating increased fear generalization upon stimulation with blue light in PKCδ-Cre animals infected with DIO-AAV-ChR2 (n = 7 mice), but not in control animals (n = 6 mice; Two way ANOVA: F(1,11) = 11.83, P= 0.005 for the interaction injection × light stimulation; post-hoc Sidak's multiple comparison test: P = 0.01 for lighton vs. lightoff in DIO-AAV-ChR2 injected mice). **P = 0.008, paired t-test between lightoff and lighton in ChR group, t = -3.952, 6 degrees of freedom. = 0.946, paired t-test between lightoff and lighton in control group, t = 0.0707, 5 degrees of freedom. m, Top, Schematic representation of the experimental protocol used for analyzing optogenetic manipulations of PKCδ+ neurons during EPM behavior. EPM and open field behaviour was analyzed prior to subjecting animals to fear conditioning. Bottom, Example EPM trajectories of PKCδ-Cre animals injected with rAAV 2/7 EF1α∷DIO-ChR2(H134R)-2A-NpHR-2A-Venus (top) or rAAV 2/5 CBA∷DIO-ARCH-GFP (bottom) under lighton or lightoff conditions. n, Enhancing the activity of PKCδ+ neurons decreases the percentage of time animals spend on open arms (n = 7 mice, **P = 0.006, paired t-test, t = -3.952, 6 degrees of freedom between lightoff and lighton for ChR2 group.), whereas decreasing the activity of PKCδ+ neurons has the opposite effect (n = 6 mice, **P = 0.005, paired t-test, t = -4.702, 5 degrees of freedom between lightoff and lighton for ARCH group.). The behavior of control animals was not altered by light stimulation (n = 9 mice, P = 0.214, aired t-test, t = 1.349, 8 degrees of freedom between lightoff and lighton for control group.). Two-way ANOVA: F(2, 19) = 26.72, P < 0.001 for the interaction injection × light stimulation; post-hoc pairwise Sidak's tests revealed significant differences between lighton in the ARCH group, lighton in the ChR2 and control group. o, Top, Schematic representation of the experimental protocol used for analyzing optogenetic manipulations of PKCδ+ neurons during open field behavior. Bottom, Example open field trajectories of PKCδ-Cre animals injected with rAAV 2/7 EF1α∷DIO-ChR2(H134R)-2A-NpHR-2A-Venus (top) or rAAV 2/5 CBA∷DIO-ARCH-GFP (bottom) under lighton or lightoff conditions. p, Enhancing the activity of PKCδ+ neurons decreases the number of center crossings (red square) per unit track length (n = 7 mice, **P = 0.006, paired t-test between lightoff and lighton for ChR group, t = 4.124, 6 degrees of freedom), whereas decreasing the activity of PKCδ+ neurons has the opposite effect (n = 8 mice, **P = 0.007, aired t-test between lightoff and lighton for ARCH group, t = -3.956, 6 degrees of freedom.). The behavior of control animals was not altered by light stimulation (n = 7 mice, P = 0.408, paired t-test between lightoff and lighton for control group, t = 0.880, 7 degrees of freedom.). Two-way ANOVA: Two-way ANOVA: F(2, 19) = 8.587, P = 0.002 for the interaction injection × light stimulation; post-hoc pairwise Sidak's tests revealed significant differences between lighton in the ARCH group, lighton in the ChR2 and control group. All error bars indicate mean ± s.e.m.
Next, we examined whether optogenetic manipulation of PKCδ+ neurons would also cause changes in EPM behavior in naïve animals. In keeping with the effect on fear generalization, blue light stimulation of PKCδ+ neurons decreased the relative time spent on open arms, corresponding to an anxiogenic effect, whereas yellow light stimulation was anxiolytic (Fig. 2m,n; Supplementary Fig. 2). To further support the notion that increasing or decreasing the spontaneous activity of PKCδ+ neurons has anxiogenic or anxiolytic effects, respectively, we assessed light-induced behavioral changes in the Open Field Test (OFT), in which anxious animals tend to avoid the center area of an open field arena13,14. Consistent with the effect on EPM behavior, we observed that in naïve animals, even though blue light stimulation of PKCδ+ neurons decreased the overall locomotion without increasing freezing behavior (Supplementary Fig. 2), this resulted in a reduction in the number of visits to the center area (per unit track length) and to a decrease in the overall time spent in the center area (Fig. 2o,p; Supplementary Fig. 2). Conversely, optogenetic inhibition of PKCδ+ neurons resulted in increased locomotion, an increase in the number of visits to the center area and an increase in the overall time spent in the center area (Fig. 2o,p; Supplementary Fig. 2). Taken together, these data suggest that basal activity of PKCδ+ neurons in CEA exerts bidirectional control over anxiety behavior. Moreover, given that in the absence of any optogenetic intervention, the degree of fear generalization correlates with both the spontaneous activity of PKCδ+ neurons and with anxiety behavior8, suggesting that, under physiological conditions, the activity of PKCδ+ neurons might be actively regulated by endogenous mechanisms.
Extrasynaptic inhibition regulates PKCδ+ neurons
Because the neuronal circuitry of the CEA is comprised of spontaneously active GABAergic neurons, we hypothesized that, similar to the cerebellum, activation of extrasynaptic GABAA receptors (GABAARs) may be an important factor controlling the excitability and spontaneous activity of CEA neurons16,17. Whole-cell patch clamp recordings from identified PKCδ+ neurons in acute CEA slices revealed the existence of a tonic GABAA receptor-mediated conductance which could be blocked by picrotoxin (100 μM), but not with the selective competitive GABAAR antagonist SR95531 (2-(3-Carboxypropyl)-3-amino-6-(4-methoxyphenyl)pyri-dazinium bromide; 1 – 50 μM)18, or with the selective GABABR antagonist CGP 52432 (1 – 50 μM)(Fig. 3a; Supplementary Fig. 3). The charge transfer mediated by tonically active, extrasynaptic GABAARs, as measured by a change in the holding current, was substantially larger compared to the charge transfer of synaptically activated GABAARs, as measured by the blockade of spontaneous inhibitory postsynaptic currents (sIPSCs)(Fig. 3b). Consistent with this marked difference in charge transfer, blocking synaptic GABAARs had no significant effect on the excitability of PKCδ+ neurons, whereas blocking both synaptic and tonically active extrasynaptic receptors with PTX resulted in a robust increase in spontaneous firing rate recorded in cell-attached configuration (Fig. 3c). Additional whole-cell recordings of PKCδ+ neurons revealed that blockade of extrasynaptic, but not synaptic, GABAARs led to an increase in input resistance, a slight depolarising shift in the resting membrane potential, and an increase in the input-output function as measured by depolarising current steps or by random current fluctuations (Supplementary Fig. 3). These data support the idea that a tonic extrasynaptic GABAAR conductance is an endogenous mechanism regulating basal PKCδ+ neuron activity.
Figure 3.
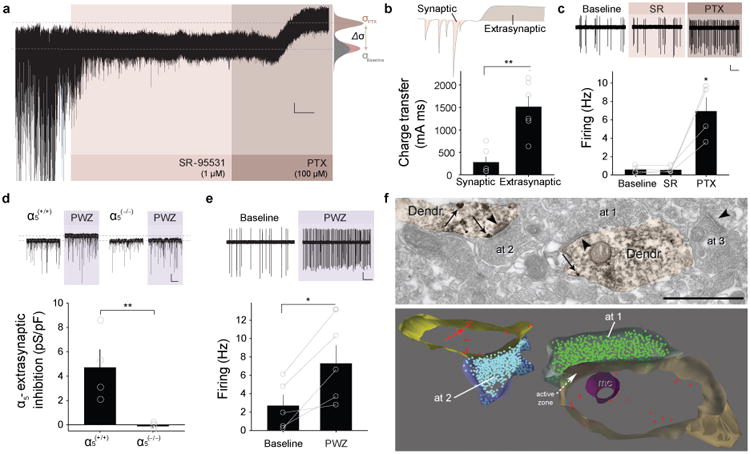
Extrasynaptic inhibition mediated by α5-GABAARs controls the spontaneous firing of PKCδ+ neurons. a, Representative whole-cell current trace (Vh = -75.5 mV) recorded from a PKCδ+ neuron in vitro illustrating the successive blockade of phasic (synaptic) and tonic (extrasynaptic) GABAergic currents (scale bar: 5 pA, 2 min.). Application of 1 μM SR-95531 and 100 μM PTX is indicated by the pink and brown areas, respectively. Lower dashed line indicates baseline holding current that fits with the average mean of two all-point histograms for baseline (gray) and SR-95531 (pink). PTX caused a shift of the holding current indicated by the upper dashed line that fits the average of a Gaussian distribution (brown). b, Charge transfer of synaptic and extrasynaptic GABAergic currents (n = 6 cells/6 slices/3 mice each; **P = 0.005, two-tailed paired t-test, t = -4.691, 5 degrees of freedom). c, Top, Traces show spontaneous firing of PKCδ+ neurons recorded in cell-attached configuration (scale bar: 100 pA, 5 s). Bottom, Spontaneous firing of PKCδ+ neurons is enhanced by PTX but not by SR-95531 (n = 4 cells/4 slices/2 mice; *P = 0.028, One-Way ANOVA followed by Dunn's multiple comparisons test between baseline and PTX, P = 1.000 between baseline and SR-95531). d, Top, Representative recordings illustrating the shift in the holding current induced by PWZ-029 (1 μM) in wild-type (α5+/+), but not in mice lacking α5 receptors in PKCδ+ neurons (α5-/-: PKCδ-Cre × Gabra5fl/fl)(scale bar:- 10 pA, 10 s). Bottom, α5GABAAR mediated extrasynaptic inhibition is completely absent in PKCδ+ neurons recorded in slices from PKCδ-Cre × Gabra5fl/fl mice (n = 5 cells/5 slices/2 KO mice and n = 4 cells/4 slices/2 wild type mice; *P = 0.003, two-tailed unpaired t-test, t = 4.172, 6 degrees of freedom). e, Top, Spontaneous firing of a representative PKCδ+ neuron recorded in cell-attached configuration before and during the application of PWZ-029 (scale bar: 100 pA, 5 s). Bottom, Spontaneous firing of PKCδ+ neurons is enhanced by application of PWZ-029 (1 μM; n = 5 cells/5 slices/3 mice; **P = 0.015, two-tailed paired t-test, t = -4.049, 4 degrees of freedom). f, Pre-embedding double-labeling electron microscopy reveals extrasynaptic α5GABAAR expression (gold/silver particles) in dendrites of PKCδ+ neurons (shown in orange; HRP-DAB reaction) of the CEl. Immunometal particles were observed both at the plasma membrane (indicated by arrows) and at cytoplasmic locations. Synapses are indicated by arrowheads. The axon terminal at1 forms a symmetric (Type II) synapse whereas axon terminals at2 and at3 form asymmetric (Type I) synapses. Scale bar: 1 μm. The lower panel shows a reconstruction of segments (from 5 sections) of the two PKCδ+ dendrites and of the axon terminals at1 (blue) and at2 (green). Surface immunometal particle density on PKCδ+ dendrites was 0.17 ± 0.02 particles/μm, n = 70 segments. It can be appreciated that the immunometal particles, shown as red dots, are not associated with synaptic specializations. mc: mitochondrion. All error bars indicate mean ± s.e.m.
Our observation, that extrasynaptic inhibition in CEA PKCδ+ neurons was largely insensitive to the competitive GABAAR antagonist SR95531 (1 – 50 μM) suggests either that extrasynaptic GABAARs exhibit a very high affinity for GABA18,19 and/or that they can open in a spontaneous, ligand-independent manner20,21. Consistent with the latter scenario, we found that SR95531 (20 μM) partially antagonised the inverse agonist effect of bicuculline (20 μM) on the holding current20 (Supplementary Fig. 4). To further address whether extrasynaptic GABAARs in CEA PKCδ+ neurons could additionally report spill-over of synaptically released GABA, we blocked action-potential-mediated release with tetrodotoxin (TTX; 1 μM). Application of TTX reduced the sIPSC frequency in PKCδ+ neurons and resulted in a slight reduction in extrasynaptic inhibition, which correlated with the effect on sIPSC frequency (Supplementary Fig. 4). These findings suggest that both ligand independent receptor opening and GABA spill over contribute to endogenous extrasynaptic GABAAR inhibition in these neurons.
Extrasynaptic GABAARs in other brain areas have been shown to contain α4/δ, α6/δor α5subunits22. Because α5-containing GABAARs (α5-GABAARs) are abundant in CEA23, 24, and their expression level decreases both after fear conditioning24 and in a mouse model of increased trait anxiety25, we hypothesised that α5-GABAARs contribute to extrasynaptic inhibition in CEA PKCδ+ neurons. Immunohistochemical double labeling of CEA sections from PKCδ+-Cre-CFP mice with an anti-α5 subunit antibody and an anti-CFP antibody9 revealed that about 70% of the PKCδ+ neurons expressed the α5 subunit (Supplementary Fig. 5). No α5 immunohistochemical labeling could be detected in CEA sections obtained from mice lacking the gene encoding the α5 subunit (Gabra5-/-) (Supplementary Fig. 5). Next, to test for the presence of functional α5-GABAARs in CEA PKCδ+ neurons, we applied two distinct α5 inverse agonists. Both L-655,708 (50 nM – 50 μM) and the more specific inverse agonist methyl (8-chloro-5,6-dihydro-5-methyl-6-oxo-4H-imidazo[1,5-α][1,4] benzodiazepin-3-yl)methyl ether or PWZ-029 (100 nM - 1 μM)22 significantly reduced the extracellular GABAAR conductance (Fig. 3d, Supplementary Fig. 6). In contrast, the neurosteroid 3α,5α- tetrahydrodeoxycorticosterone (THDOC; 10 – 100 nM), a modulator of δ-containing GABAARs, and Zolpidem (20 – 300 nM), an agonist of α1-containing GABAARs, had no significant effect (Supplementary Fig. 6). The effect of PWZ-029 (1 μM) was specific for α5-GABAARs, because it was absent in PKCδ+ neurons recorded in slices obtained from mice lacking α5 receptors in PKCδ+ neurons (α5(-/-):PKCδ/CrexGabra5fl/fl mice)(Fig. 3d). Similar to PTX, application of PWZ-029 increased the spontaneous activity of PKCδ+ neurons recorded in the cell-attached configuration in acute CEA slices (Fig. 3e).
Consistent with the notion that α5-GABAARs underlie a tonically active conductance mediated by extrasynaptic receptors, two different inverse agonists of α5-GABAARs, L-655,708 and PWZ-029, had no effect on sIPSC frequency or amplitude in PKCδ+ neurons (Supplementary Fig. 6). To unequivocally demonstrate the extrasynaptic localization of α5-GABAARs in PKCδ+ neurons, we performed a pre-embedding electron microscopical analysis. Consistent with the electophysiological data, this electron microscopical analysis revealed that immunometal particles labelling α5-GABAARs in identified PKCδ+ neurons localized predominantly to extrasynaptic dendritic regions with very little synaptic labelling (Fig. 3f). Compared to PKCδ+ neurons, PKCδ- neurons exhibited significantly higher levels of extrasynapticα5-GABAARs as measured with electrophysiological or electron microscopical approaches (Supplementary Fig. 7).
Finally, we performed extracellular single unit recordings in the CEA of freely moving animals8 and locally applied PWZ-029 using glass micro pipettes. Local application of PWZ-029 significantly increased the spontaneous firing rate of CEA units compared to vehicle controls (Supplementary Fig. 8) providing further evidence that endogenous α5 GABAAR-mediated inhibition controls spontaneous activity of CEA neurons in vivo.
Experience-dependent reduction of extrasynaptic inhibition
To test whether the previously described8, fear conditioning-induced increases in PKCδ+ neuron firing rate are paralleled by changes in endogenous, functional extrasynaptic GABAAR-mediated inhibition, we compared extrasynaptic GABAAR conductance in PKCδ+ neurons recorded in ex vivo slices obtained from fear conditioned animals or from control animals, which were only exposed to non-reinforced CSs (Fig. 4a). PKCδ+ neurons recorded from animals subjected to CS-US pairings exhibited a marked reduction in the total extrasynaptic GABAAR conductance and in the tonic conductance mediated by α5-containing receptors, with no changes in sIPSC frequency or amplitude, nor in the tonic conductance mediated by δ-containing receptors (Fig. 4b,c; Supplementary Fig. 9). In addition, this reduction in α5-GABAAR-mediated extrasynaptic inhibition was cell type-specific, as PKCδ- neurons exhibited the opposite effect (Supplementary Fig. 9).
Figure 4.

Experience-dependent reduction of extrasynaptic inhibition predicts fear generalisation. a, Freezing levels before (baseline) and during the presentation of the CS- and the CS+ 24 hrs after training for animals exposed to CS only (n = 8 mice) and animals subjected to CS+-US pairings (n = 8 mice; ***P < 0.001 for CS+ in CS-US group, H = 81.715, 2 degrees of freedom; P = 0.412 for CS only group, H = 1.771, 2 degrees of freedom; Kruskal-Wallis One-Way ANOVA followed by Dunn's pairwise multiple comparison test). b, Representative current traces recorded in vitro from PKCδ+ neurons in slices obtained from control (CS only) and fear conditioned (CS-US) animals. Traces illustrate the sequential application of L-655 (50 nM) and PTX (100 μM). Scale bar: 50 pA, 10 s. c, Left, Total extrasynaptic inhibition is reduced in PKCδ+ neurons of fear conditioned animals (n = 26 cells/26 slices/8 mice) compared to control animals (CS only, n = 14 cells/14 slices/8 mice). ***P < 0.001 by Mann-Whitney Rank Sum unpaired t-test. Right, α5-mediated extrasynaptic inhibition is reduced in PKCδ+ neurons of fear conditioned animals (n = 28 cells/28 slices/8 mice) compared to control animals (CS only, n = 14/14 slices/8 mice). ***P < 0.001, Mann-Whitney Rank Sum unpaired t-test. d, Total extrasynaptic inhibition inversely correlates with fear generalization. Each dot represents the average of the extrasynaptic inhibition recorded from several PKCδ+ neurons for an individual animal (n = 2-4 cells per animal; n = 8 animals). Linear regression: R = 0.7; P = 0.041. All error bars indicate mean ± s.e.m.
A similar reduction in α5-GABAAR-mediated extrasynaptic inhibition in PKCδ+ neurons along with increased EPM anxiety was observed in animals exposed to a contextual fear conditioning paradigm (US only; Supplementary Fig. 9), indicating that these changes are not specifically induced by auditory CS-US associations acquired during cued fear conditioning, but are rather a consequence of US exposure. Importantly, in animals subjected to discriminative cued or contextual fear conditioning, we observed a striking negative correlation between fear generalization, as measured by CS+/CS- or context discrimination, and the amplitude of the extrasynaptic GABAAR conductance (Fig. 4d; Supplementary Fig. 9). These data suggest that an experience-dependent reduction in extrasynaptic inhibition of PKCδ+ neurons may contribute to fear generalization at the behavioral level.
Reducing α5-GABAAR expression is anxiogenic
We therefore directly examined whether interfering with the expression of the α5 subunit in CEA would be causally related to fear generalization. First, we used a brain area specific approach by injection of a pAAV expressing Cre-recombinase bilaterally into CEA of conditional α5-floxed animals (α5(fl/fl))(Fig. 5a). Whole-cell recordings from AAV-Cre infected neurons in slices obtained from α5(fl/fl) animals, α5-GABAAR-mediated extrasynaptic inhibition was completely abolished, whereas it was normal in neighboring non-infected neurons, or in infected neurons in slices from α5(+/+) animals (Fig. 5b). Behavioral analysis of pAAV-Cre infected α5(fl/fl) animals showed that genetic deletion of α5-GABAARs in CEA was anxiogenic as measured by increased EPM anxiety and enhanced fear generalization (Fig. 5c,d). Even though these data are consistent with the notion that α5-GABAARs regulate anxiety by controlling the activity of PKCδ+ neurons, an obvious caveat of this genetic approach is the fact that it is not cell type-specific. Given that upon fear conditioning, the α5-GABAAR-mediated extrasynaptic conductance changes in opposite directions in PKCδ+ and PKCδ- cells, and consistent with the notion that PKCδ+ cells thought to be largely downstream of PKCδ- cells8,9, this also suggests that the conductance decrease in PKCδ+ neurons is dominant with regard to the manipulation of PKCδ- cells, and possibly sufficient to induce anxiety behavior.
Figure 5.
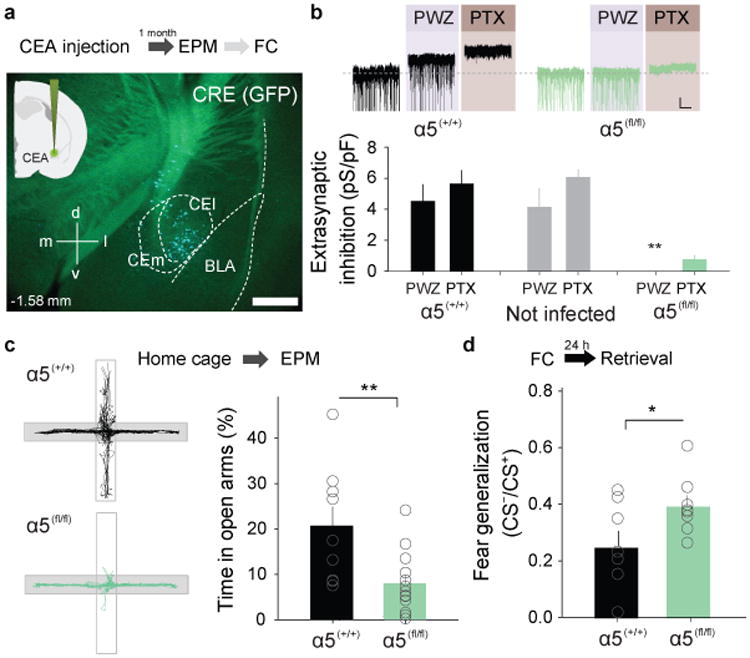
Brain area-specific conditional genetic deletion of α5-GABAAR expression induces fear generalization and anxiety behavior. a, Top, Scheme showing the experimental protocol. Anxiety tests were performed before subjecting animals to fear conditioning. Bottom, AAV-mediated expression of Cre recombinase and GFP (green staining) in CEA neurons after injection of α5-floxed animals (α5(fl/fl)) with AAV-Cre. Scale bar: 50 μm. b, Top, Representative current traces illustrating Cre-induced loss of extrasynapticα5-mediated inhibition in infected CEA neurons of α5-floxed animals (right,α5(fl/fl), green) compared to wild-type animals injected with the same virus (left, α5(+/+), black). Scale bar: 20 pA, 15 s. Bottom, PTX- and PWZ-sensitive extrasynaptic inhibition in CEA neurons is strongly reduced by expression of Cre-GFP (n = 6 cells/6 slices/3 mice, **P = 0.006, One-Way ANOVA followed by Dunnett's multiple comparisons test vs. PTX in α5(+/+)) compared to control (n = 5 cells/5 slices/3 mice,α5(+/+)) and non-infected cells in α5(fl/fl)animals (n = 5 cells/5 slices/2 mice). c, Top, Schematic representation of the behavioral protocol. Bottom, Brain area-specific genetic deletion of α5-GABAARs (n = 13 mice, α5(fl/fl)) in CEA reduces the time spent in the open arms on the EPM compared to control animals injected with the same virus (n = 9 mice, α5(+/+)). **P = 0.008, Mann-Whitney rank sum two-tailed unpaired t-test. d, Top, Schematic representation of the behavioral protocol. Bottom, Brain area-specific genetic deletion of α5-GABAARs (n = 8 mice, α5(fl/fl)) in CEA enhances fear generalization compared to controls (n = 9 mice, α5(+/+)). *P = 0.04, two-tailed unpaired t-test, t = -2.269, 14 degrees of freedom. All error bars indicate mean ± s.e.m.
In order to manipulate α5 subunit expression in a brain area- and cell type-specific manner, we devised a Cre-conditional shRNA construct targeting Gabra5 mRNA (Supplementary Fig. 10). In HEK293T cells, expression of Gabra5-shRNA strongly reduced Gabra5 protein levels (Supplementary Fig. 10). We then specifically expressed this shRNA construct in CEA PKCδ+ neurons by local injection of a DIO-AAV (DIO, double floxed inverted open reading frame) expressing the Gabra5-shRNA or scrambled control shRNA into the CEA of PKCδ-Cre mice (Fig. 6a). Comparison of the remaining extrasynaptic GABAAR conductance in PKCδ+ neurons infected with Gabra5-shRNA or with scrambled control shRNA revealed that expression of the Gabra5-shRNA strongly decreased both total and α5-mediated extrasynaptic inhibition (Fig. 6b-d), further indicating that extrasynaptic GABAAR currents are predominantly mediated by α5-containing GABAARs in these neurons.
Figure 6.
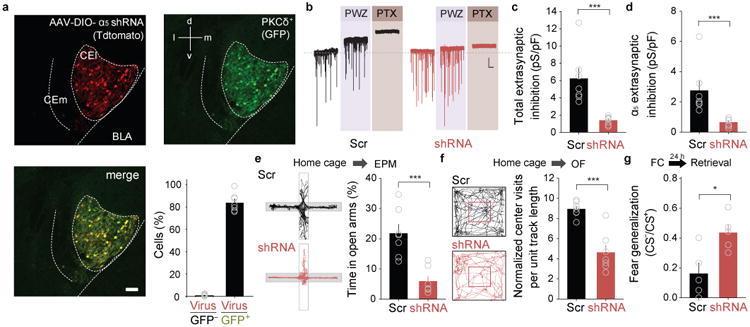
Brain area- and cell type-specific knock-down of α5-GABAAR expression induces anxiety behaviour and fear generalization. a, Conditional expression of Tdtomato and shRNA in PKCδ+ neurons (CFP staining, green) after infection of PKCδ-Cre-CFP mice with an AAV containingDIO-α5-shRNA. Scale bar: 50 μm. b, Representative current traces illustrating shRNA-induced knock-down of extrasynaptic inhibition in PKCδ+ neurons (α5-shRNA) compared to control animals injected with a virus expressing scrambled shRNA. Scale bar: 20 pA, 15 s. c, PTX-sensitive total extrasynaptic inhibition in PKCδ+ neurons is strongly reduced by expression of α5-shRNA (n = 8) compared to cells expressing scrambled shRNA (n = 7). ***P < 0.001, Mann-Whitney Rank Sum unpaired t-test. d, PWZ-029-sensitive α5-GABAAR-mediated extrasynaptic inhibition in PKCδ+ neurons is strongly reduced by expression of α5-shRNA (n = 8 cells/8 slices/3 mice) compared to cells expressing scrambled shRNA (n = 7 cells/7 slices/3 mice). ***P < 0.001 by Mann-Whitney Rank Sum unpaired t-test. e, Top, Schematic representation of the experimental protocol. Bottom, Cell-type specific expression of α5-shRNA (n = 7 mice) in PKCδ+ neurons reduces the percentage of time spent in the open arms of the EPM compared to animals infected with an AVV expressing scrambled shRNA (n = 7 mice). ***P < 0.001, two-tailed unpaired t-test, t = 5.514, 12 degrees of freedom. f, Top, Schematic representation of the experimental protocol. Bottom, Cell-type specific expression of α5-shRNA (n = 7 mice) in PKCδ+ neurons reduces the normalized number of center crossings in the open field paradigm compared to animals injected with an AAV expressing scrambled shRNA (n = 7 mice). ***P < 0.001, two-tailed unpaired t-test, 4.611, 12 degrees of freedom. g, Top, Schematic representation of the experimental protocol. Bottom, Cell-type specific expression of α5-shRNA (n = 5 mice) in PKCδ+ neurons enhances fear generalization compared to animals infected with an AAV expressing scrambled shRNA (n = 5 mice). **P = 0.015, two-tailed unpaired t-test, t = -3.088, 8 degrees of freedom. All error bars indicate mean ± s.e.m.
To test whether reducing the expression of α5-GABAAR subunits specifically in CEA PKCδ+ neurons impacts anxiety behavior and fear generalization, we bilaterally injected PKCδ-Cre animals with DIO-AAV Gabra5-shRNA or scrambled control shRNA. Four weeks after injection, mice underwent EPM and open field behavior testing and were subsequently subjected to discriminative fear conditioning. Animals injected with Gabra5-shRNA spent significantly less time on the open arms of the EPM, exhibited fewer center crossings and spent less time in the center area in the OFT, and showed enhanced fear generalization compared to animals injected with a vector expressing control shRNA (Fig. 6e-g; Supplementary Fig. 2), thus indicating that reducing α5-GABAAR expression in PKCδ+ neurons was sufficient to cause increased anxiety behavior.
Discussion
Together, our results identify the regulation of cellular excitability through extrasynaptic inhibition mediated by α5-GABAARs in CEA PKCδ+ neurons as an important mechanism for the orchestration of a behavioral program associated with generalized fear and sustained anxiety. In principle, regulation of extrasynaptic inhibition might be achieved by changes in the numbers and/or properties of α5-GABAARs expressed by CEA PKCδ+ neurons. Alternatively, alterations in ambient GABA concentration might also contribute. However, given our observations that part of the tonic conductance was mediated by spontaneous ligand-independent receptor openings, that fear conditioning induced opposite changes in distinct cell types, and that there are α5-GABAARs associated with intracellular compartments, an experience-dependent change in the expression and/or trafficking of α5-GABAARs is the most parsimonious explanation. Previous studies involving genetic or systemic pharmacological manipulations leading to reduced or completely absent α5-mediated extrasynaptic inhibition revealed an improved performance in a number of cognitive learning tasks and mild anxiogenic behavior22,26-28. Given that fear conditioning and trait anxiety are associated with decreased Gabra5 mRNA levels24,25, this suggests that the cell type-specific regulation of α5-GABAARs controls the excitability of CEA PKCδ+ neurons in an experience-dependent manner.
Our present findings demonstrate that PKCδ+ neurons are a central gateway not only to the circuitry controlling acute fear responses8,9, but also to the circuitry underlying sustained anxiety. Moreover, our results suggest that regulation of the cellular excitability of PKCδ+ neurons, or upstream CEA neurons, could be a general mechanism by which external or internal stimuli, such as aversive experience, stress, nausea, satiety, or drugs of abuse such as ethanol, modulate complex behavioral states including anxiety and feeding behavior23,29,30. This might involve additional, α5-GABAAR-independent mechanisms, such as the regulation of potassium channels through neuropeptide- or neuromodulator-activated G-protein coupled receptors29.
Studies on cerebellar granule cells indicate that the level of tonic inhibition modulates the gain, and hence the signal-to-noise ratio, of sensory-evoked phasic responses16,17,31. Future experiments will have to address how tonic inhibition mediated by extrasynaptic GABAARs in CEA interacts with phasic responses elicited by acute conditioned or unconditioned sensory stimuli. A further important open question is, whether the phasic and sustained signals are read out by the same population of downstream neurons, or by different populations of neurons, possibly even located in different downstream brain regions.
In conclusion, our study not only identifies a molecular mechanism underlying the regulation of an entire repertoire of concerted behavioral changes associated with anxiety states, but also provides a defined cellular entry point into the neuronal circuitry underlying a complex behavioral state such as anxiety.
Methods
Animals
Two to three month-old male wild-type C57BL6/J (Harlan Ltd) and mutant mice (all with C57BL6/J genetic background) were individually housed for 7 days before behavioral experiments prior to ex vivo experiments and anxiety tests. Mice were kept under a 12 h light/dark cycle, and provided with food and water ad libitum. For optogenetic and shRNA experiments, animals were housed one month before behavioral testing and electrophysiological recordings to allow for virus expression. Experiments were performed 3-11 hours after lights on. All animal procedures were executed in accordance with institutional guidelines and were approved by the Veterinary Department of the Canton of Basel-Stadt.
Behavior
Auditory and contextual fear conditioning
Fear conditioning and fear retrieval took place in two different contexts (context A and B). The conditioning and retrieval boxes and the floor were cleaned before and after each session with 70% ethanol or 1% acetic acid before and after each session, respectively. To score freezing behaviour, an automatic infrared beam detection system placed on the bottom of the experimental chambers (Coulbourn Instruments) was used. Mice were considered to be freezing if no movement was detected for 2 s and the measure was expressed as a percentage of time spent freezing. To ensure that our automatic system scores freezing rather than just immobility, we previously compared the values obtained with those measured using a classical time-sampling procedure during which an experimenter blind to the experimental conditions determined the mice to be freezing or not freezing every 2 s (defined as the complete absence of movement except for respiratory movements). The values obtained were 95% identical and the automatic detection system was therefore used throughout the experimental sessions. Tones were presented as CS+ and the CS− (total CS duration of 30 s, consisting of 50 ms pips repeated at 0.9 Hz, 2 ms rise and fall; pip frequency: 7.5 kHz or white noise, 80 dB sound pressure level). Discriminative fear conditioning was performed on day 1 by pairing the CS+ with a US (1-s foot shock, 0.6 mA, 5 CS+/US pairings; inter-trial interval: 20–180 s) (CS-US group). The onset of the US coincided with the offset of the CS+. The CS− was presented after each CS+/US association but was never reinforced (5 CS− presentations, inter-trial interval: 20–180 s). The frequencies used for CS+ and CS− were counterbalanced across animals. On day 2, conditioned mice were submitted to fear retrieval in context B, during which they received four presentations of the CS− and the CS+ each. Control animals (CS only) were treated in the same manner but were not exposed to the US and they did not freeze during exposure of the tones (Fig. 4a, b). The US only group was exposed to 5 USs. Auditory fear generalization was quantified by calculating the ratio between the freezing values during the CS- and CS+ presentations. Contextual fear generalization was quantified by calculating the ratio between the freezing values during exposure to a novel context CTX-, and to the conditioning context CTX+.
Open field test
All anxiety tests (open field and elevated plus maze) shown in figure 1 and 4 were performed before subjecting animals to fear conditioning paradigms. Mice were always placed at the periphery of an open field arena (50 cm × 50 cm) placed in a larger, sound-attenuated box. Light intensity inside the open field arena was 1.2 LUX. Movements were monitored by a camera (Logitech) located on top of the arena. AVI files were analysed using ViewerII 5.1 software (BIOBSERVE GmbH). The open field was divided in center area (20 cm × 20 cm) and peripheral area. Total track length was calculated with the center of the animal's body as the reference while the number of visits to the center area was scored when all four paws were located in the center area. Behaviour was scored and statistically analysed during the first 5 min.
Elevated plus maze (EPM)
The EPM was composed of two arms enclosed by light gray walls and two open arms (length: 230 mm each; elevated 300 mm above ground). Mice were placed in the center area between the arms and their behavior was monitored for 10 min with a camera (Logitech, Newark, CA, USA) placed on the top of the maze. After every behavioral session, the maze was cleaned with an ethanol-based disinfectant solution (Fugaten®-Spray, Lysoform Dr. Hans Roseann GmbH, Germany). This solution has a different smell than ethanol or acetic acid used for cleaning the fear conditioning context. Video tracking software (ViewerII 5.1 software, BIOBSERVE GmbH) was used to track the animal's location. Compartment visits were scored only when the animal had all the four paws in one area. For all the behavioral sessions, the experimental groups were tested in an interleaved manner in order to avoid batch effects.
Virus injections and optogenetic experiments
Deeply anaesthetised animals (Isoflurane) were fixed in a stereotactic frame (Kopf Instruments) and the skin above the skull was cut. Glass pipettes (tip diameter 10–20 μm) connected to a Picospritzer III (Parker Hannifin Corporation) were lowered with a Micropositioner (Kopf Instruments) to a depth of 4 mm. About 300 nl virus solution was pressure-injected into CEl. For optical activation of PKCδ+ neurons, animals were injected into CEl with an rAAV 2/7 EF1α∷DIO-ChR2(H134R)-2A-NpHR-2A-Venus (UPenn, Vector Core), at −1.2 mm posterior (AP) and ±2.9 mm lateral to bregma (LAT) at a depth of −4 mm (D/V)32. For optogenetic inhibition, animals were injected with rAAV 2/5 CBA∷DIO-ARCH-GFP. To visualize PKCδ+ neurons in PKCδ-Cre animals, some animals were co-injected with an rAAV 2/1 CAG∷DIO-tdTomato.
Optic fibers with a diameter of 200 μm (Thorlabs GmbH) were chronically implanted bilaterally above CEl (bregma coordinates: AP, -1.2; LAT, +/- 2.9; D/V, -3.5) at a depth of −3.5 mm (S1) and optical connectors were fixed on the skull with cyanoacrylate glue (Ultra Gel©, Henkel, Düsseldorf, Germany) and dental cement (Paladur©, Heraeus, Hanau, Germany). Mice were given two weeks to recover from surgery. Afterwards they were handled daily for five consecutive days (five min each day) to habituate them to the behavioral and optogenetic experimental procedures.
For the fear generalization experiment, mice were placed into a behavioral context B and the implanted optic fibers were connected to a blue laser (λ = 473 nm, 100 mW, Extreme Lasers) by an optic fiber (Thorlabs GmbH) attached to the connector with a cap nut. During retrieval, the mice received a block of 8 CS- and 8 CS+ and eight 30-s pulses of blue light were given for four of each tone. Light stimulation during CSs was intermixed for each animal to avoid artifact effects. The light started 50 ms before the first pip and ended 50 ms after each pip. Freezing with and without light stimulation was quantified as described above. For elevated plus maze and open field tests, optical fibers were connected to the implanted optical connectors and the animals were monitored for 18-20 min while light stimulation was delivered 3 times for 3 min with 3 min intervals. Light power at the tip of the optical fiber was ranging between 18-20 mW. After the experiment, optic fibers were removed and animals were perfused with PFA (4%) for histological analysis of the injection site as previously described5. The brain was removed and cut into 80 μm coronal slices.
Electrophysiology
Slice electrophysiology
Standard procedures were used to prepare 300 μM thick coronal slices from 6- to 12-week-old male wild-type, PKCδ-Cre, and Gabra5-/- mice. Briefly, the brain was dissected in ice-cold artificial cerebrospinal fluid (ACSF), mounted on an agar block, and sliced with a vibrating-blade microtome (HM 650 V, Carl Zeiss, Jena, Germany) at 4°C. Slices were maintained for 45 min at 37°C in an interface chamber containing ACSF equilibrated with 95% O2/5% CO2 and containing the following (in mM): 124 NaCl, 2.7 KCl, 2 CaCl2, 1.3 MgCl2, 26 NaHCO3, 0.4 NaH2PO4, 18 glucose, 4 ascorbate. 15 min after incubation, slices were transferred to another chamber for at least 60 min at room temperature in another physiological ACSF (pACSF) containing the following (in mM): 125 NaCl, 3.5 KCl, 1.2 CaCl2, 1 MgSO4, 26 NaHCO3, 1.25 NaH2PO4, 11 D-glucose. Recordings were performed with pACSF in a recording chamber at a temperature of 35°C at a perfusion rate of 1-2 ml/min. Neurons were visually identified with infrared video microscopy using an upright microscope equipped with a 40× objective (Olympus, Tokyo, Japan). Patch electrodes (3–5 MΩ) were pulled from borosilicate glass tubing. For current clamp experiments, patch electrodes were filled with a solution containing the following (in mM): 120 K-gluconate, 20 KCl, 10 HEPES, 10 phosphocreatine, 4 Mg-ATP, and 0.3 Na-GTP (pH adjusted to 7.25 with KOH, respectively, 295 mOsm). The phasic and extrasynaptic GABAergic postsynaptic currents were recorded using an internal solution containing the following (in mM): 110 CsCl, 30 K-gluconate, 1.1 EGTA, 10 HEPES, 0.1 CaCl2, 4 Mg-ATP, 0.3 Na-GTP (pH adjusted to 7.3 with CsOH, 280 mOsm) and 4 N-(2,6-Dimethylphenylcarbamoylmethyl)triethylammonium bromide (QX-314; Tocris-Cookson, Ellisville, MO). For cell-attached recordings, pACSF was used inside the recording pipette. To exclude glutamatergic inputs, CNQX (6-cyano-7-nitroquinoxaline-2,3-dione, 10 μM: AMPA receptor antagonist) and (R)-CPP ((RS)-3-(2-Carboxypiperazin-4-yl)-propyl-1-phosphonic acid, 10 μM: NMDA receptor antagonist) were added to the pACSF. For all patch-clamp recordings, only one cell was recorded per slice to avoid contamination from prior drug applications. Whole cell patch-clamp recordings were excluded if the access resistance exceeded 13 MΩ and changed more than 20% during the recordings. Seal resistance, for cell-attached recordings, was around 20 to 50 MΩ and data were excluded if it changed more that 20% from the initial value. Data were recorded with a MultiClamp 700B (Molecular Devices) amplifier, filtered at 0.2 kHz, and digitised at 10 kHz. Data were acquired and analysed with Clampex 10.0, Clampfit 10.0 (Molecular Devices) and the Mini Analysis Program (Synaptosoft, Decatur, GA). All chemicals for the internal and external solutions were purchased from Fluka/Sigma (Buchs, Switzerland). Glutamatergic blockers were purchased from Tocris Bioscience (Bristol, UK). TTX was from Latoxan (Valence, France). Firing frequency elicited by injection of square current pulses shown34 was normalised by the maximum value evoked by the maximum current step for each cell.
Single unit recordings and in vivo pharmacology
Single unit recordings and in vivo pharmacology were performed in chronically implanted animals. Three to four-month old mice were anesthetised with isoflurane (induction: 4%, maintenance: 1.5%, Attane™, Minrad Inc., Buffalo, NY, USA) in oxygen-enriched air (Oxymat 3©, Weinmann, Hamburg, Germany) and fixed in a stereotaxic frame (Kopf Instruments, Tujunga, USA). Core body temperature was maintained at 36.5°C by a feed-back controlled heating pad (FHC, Bowdoinham, ME, USA). Analgesia was provided by local injection of ropivacain (200 μl of 2 mg/ml, s.c., Naropin©, AstraZeneca, Switzerland) and systemic injection of meloxicam (100μl of 5mg/mL, i.p., Metacam©, Boehringer-Ingelheim, Ingelheim, Germany). Mice were unilaterally implanted in the CEA with a custom built injectrode consisting of a multi-wire electrode attached to a guide cannula (26 gauge, with dummy screw caps, Plastics One, Roanoke, USA) and aimed at the following coordinates: 1.3 mm posterior to bregma; ±2.9 mm lateral to midline; and 4 mm to 4.1 mm deep from the cortical surface. The electrodes consisted of 16 individually insulated, gold-plated nichrome wires (13 μm inner diameter, impedance 30–100 kΩ, Sandvik, Stockholm, Sweden) contained in a 26-gauge stainless steel guide canula and attached to a 18-pin connector (Omnetics Connector Corporation, Minneapolis, MN, USA). Implants were fixed to the skull with cyanoacrylate glue (Ultra Gel©, Henkel, Düsseldorf, Germany) and dental cement (Paladur©, Heraeus, Hanau, Germany). Mice were given one week to recover from surgery, during which they were handled daily to habituate them to the recording and injection procedures.
Ten minutes before injections, 33 gauge stainless steel injectors attached to 2.5 ml Hamilton syringes were inserted into the guide canulae. Electrodes were connected to a headstage (Plexon Inc, Dallas, TX, USA) containing sixteen unity-gain operational amplifiers. The head stage was connected to a 16-channel computer-controlled preamplifier (gain ×100, band-pass filter from 150 Hz to 9 kHz, Plexon). Neuronal activity was digitised at 40 kHz and band-pass filtered from 250 Hz to 8 kHz, and was isolated by time–amplitude window discrimination and template matching using a Multichannel Acquisition Processor system (Plexon Inc, Dallas, TX, USA). Perfusion of Vehicle (78 ng DMSO in ACSF, AMRESCO, USA) or PWZ (10 μM PWZ-029 in ACSF, Prof. James Cook, University of Wisconsin)was performed using a micro-infusion pump (Stoelting, Wood Dale, IL, USA) and consisted of an injection volume of 1 μl delivered within 10-20 min. After completion of the experiment, recording sites were marked with electrolytic lesions before mice were transcardially perfused with 4% paraformaldehyde in phosphate-buffered saline (PFA), their brains extracted and post-fixed in PFA overnight. For histological verification of the injection site, 80 μm coronal brain sections were made on a vibratome (Leica Microsystems) and imaged on a stereo microscope (Leica Microsystems).
Single-unit spike sorting was performed using an Offline Sorter (Plexon). Principal component scores were calculated for unsorted waveforms and plotted on three-dimensional principal component spaces, and clusters containing similar valid waveforms were manually defined. A group of waveforms was considered to be generated from a single neuron if it defined a discrete cluster in principal component space that was distinct from clusters for other units and if it displayed a clear refractory period (>1 ms) in the auto-correlogram histograms. To avoid analysis of the same neuron recorded on different channels, we computed cross-correlation histograms (NeuroExplorer, Nex Technologies, Madison, AL, USA). If a target neuron presented a peak of activity at a time that the reference neuron fires, only one of the two neurons was considered for further analysis.
Optogenetic identification of single units in vivo
Optogenetic identification of single units was carried out as already described33. Briefly, PKCδ-Cre mice were injected with either AAV 2/5 EF1α DIO ChR2(H134R)-mCherry, AAV 2/5 EF1α DIO ChR2(H134R)-eYFP or AAV 2/5 CAG FLEX ARCH-GFP as described above. After two weeks, the mice were implanted with optrodes allowing for simultaneous single unit recordings and light application. The recordings were performed after a minimum recovery period of 2 weeks. Units were isolated using standard techniques (see above). Following unit isolation, brief pulses of blue (≥60 × 10ms and 60 × 300ms for ChR2) or yellow light (120 × 300ms; for ARCH) were given to identify PKCδ+ neurons in the recorded population. The neurons were classified as PKCδ+, if they responded to the blue light with an increase in firing (z-score ≥ 2) within less than 8 ms after light onset.
In order to select the most efficient optogenetic stimulation protocols, we performed in vivo single unit recordings from optogenetically identified PKCδ+ neurons and subsequently compared ChR2-mediated excitation using either continuous or pulsed30 light stimulation protocols. In 5 PKCδ+ neurons from 2 animals, we observed that continued stimulation with blue light (> 3 min, 20 mW) induced a marked and sustained increase in firing rate (light off: 2.4 ± 1.2 Hz; light on: 8.5 ± 3.9 Hz; z-score light on vs. light off: 78.4). In contrast, pulsed stimulation (10 ms pulses, 10 Hz, 20 mW) induced a much smaller increase in firing rate (light off: 1.3 ± 0.7 Hz; light on: 2.7 ± 0.8 Hz; z-score light on vs. light off: 27.2, 4 neurons from 1 animal), which is below the endogenous firing rate of CSoff neurons, which strongly overlap with PKCδ+ neurons, in fear conditioned animals (6.1 ± 1.4 Hz, n = 41)8.
Immunohistochemistry
Mice were transcardially perfused with phosphate buffered saline (PBS) followed by 4% paraformaldehyde (PFA) in PBS. For the staining of GABAA receptor α5 subunit, brains were post-fixed in PFA for 4 hrs at 4°C and then transferred to 30% sucrose in PBS. The brains were cut into 50 μm thick coronal slices on a vibratome (Leica Microsystems, Heerbrugg, Switzerland). Free-floating sections were rinsed in PBS. Subsequently, sections were incubated in blocking solution (20% bovine serum albumin (BSA) and 0.5% Triton X-100 in PBS (PBST)) for 2 hrs. Sections were then incubated in blocking solution (3% BSA and 0.5% PBST) containing the primary polyclonal rabbit anti-α5 antibody (5 μg/ml, gift from W. Sieghart, Medical University of Vienna, Vienna, Austria)33,34 and goat anti-GFP antibody for PKCδ+-Cre-CFP (1:1000, abcam) for 48 hrs at 4°C. Subsequently, sections were washed with PBS three times (5 min each) and incubated for 4 hrs at room temperature with fluorescent donkey anti-rabbit alexa fluor 594 and donkey anti-goat alexa fluor 488 (Invitrogen; both are 1:500 in 3% BSA and 0.5% PBST). Finally, immuno-labeled sections were rinsed three times with PBS, mounted on gelatin-coated slides, dehydrated and coverslipped6. The brains from wild type and Gabra5-/- mice were treated with the same staining procedures and imaged with the same settings using a LSM 700 confocal microscope (Carl Zeiss AG, Germany). For the other stainings, the brains were post-fixed in PFA for 4 hrs at 4°C and then cut into 80 μm thick coronal slices in PBS. Sections were then incubated in blocking solution (3% BSA and 0.5% PBST). The immunostaining for PKCδ+-Cre-CFP were performed on free-floating brain sections by overnight incubation at 4°C with goat anti-GFP antibody (1:1000, abcam) and then 2 hrs incubation at room temperature with anti-goat alexa 488. The endogenous PKCδ+were stained by overnight incubation with mouse anti-PKCδ+ antibody (1:500, BD Transduction Laboratories) at 4°C and then overnight incubation at 4°C with goat anti-mouse alexa 568. The NeuN were stained by overnight incubation at 4°C with mouse anti-NeuN antibody (1:500, Millipore) and then overnight incubation at 4°C with goat anti-mouse alexa 568. Finally, slices were imaged with a LSM 700 confocal microscope (Carl Zeiss AG, Germany). The fluorescence intensity of AAV tags is strong enough for acquiring clear pictures at the confocal microscope without using the specific immuno-staining. Antibodies used: goat anti-GFP antibody for PKCδ+-Cre-CFP (1:1000, abcam), catalog number: 194017-1; mouse anti-PKCdelta, BD Transduction Laboratories, catalog number: 610398; GABAARα5 antibody, kindly provided by from W. Sieghart (as in electron microscopy section, below); donkey anti-goat alexa fluor 488. Invitrogen, catalog number: A11055; donkey anti-rabbit alexa fluor 594. Invitrogen, catalog number: A-21207; Donkey anti-Mouse IgG Secondary Antibody, Alexa Fluor® 568 conjugate, Invitrogen, catalog number: A10037.
Electron microscopy
EM analysis was carried out on adult male C57Bl/6 mice (n = 3; 25–30 g; Charles River, Sulzfeld, Germany). Before use, the animals were housed in groups of four to five under controlled laboratory conditions (12:12 hrs light/dark cycle with lights on at 07:00 h; 21 ± 1°C; 60% humidity) with food and water ad libitum for at least 2 weeks after delivery from the supplier. Animals were deeply anesthetized by intraperitoneal injection of thiopental (100 mg/kg, i.p.) and perfused transcardially with phosphate buffered saline (PBS; 0.9% NaCl, pH 7.4) followed by ice-cold fixative made of 4% w/v paraformaldehyde, 0.05% v/v glutaraldehyde and 15% v/v of a saturated solution of picric acid in phosphate buffer (PB; 0.1 M, pH 7.4) for 10 min. Brains were immediately removed from the skull, washed in 0.1 M PB, and stored in 0.1 M PB containing 0.05% sodium azide at 6°C until immunohistochemical experiments were performed. Tissue blocks were cryo-protected in 20% sucrose in 0.1 M PB overnight at 6°C, and freeze-thawed once to allow antibody penetration. The brain tissue blocks were sliced coronally in 70 μm thick sections on a Leica VT1000S vibratome (Leica Microsystems, Vienna, Austria). The free floating sections were incubated in mouse Ig Blocking Reagent (diluted 1:27.7; Vector Laboratories, Burlingame, CA, USA) in tris-buffered saline (TBS; 50 mM, 0.9% NaCl, pH 7.4) for 1 hr at room temperature (RT), and then incubated in a blocking solution containing 20% normal goat serum (NGS) in TBS for 1 hr at RT. The sections were incubated 3 overnights at 6°C in primary antibodies diluted in TBS, containing 2% normal goat serum. The primary antibodies were: rabbit antibody against the α5-GABAAR subunit (kindly provided by Dr. W. Sieghart, Medical University of Vienna, Austria)33 and mouse monoclonal antibody against PKCδ (Catalog number; 610397, BD Biosciences, Franklin Lakes, NJ, USA), and were diluted at 1:200 and 1:300 respectively. After 3 × 10 min washes with TBS, 1.4 nm nanogold-conjugated goat anti-rabbit (Nanoprobes, Yaphank, NY, USA) and biotinylated goat anti-mouse antibodies (Vector Laboratories) were applied overnight at 6°C at a dilution of 1:100 in a buffer with the same composition as for the primary antibody. The sections were then washed and incubated in 1% glutaraldehyde and 4% PFA in PB 0.1 M for 10 min at RT. After the additional fixation, the sections were rinsed with ultra-pure water. Nanogold particles were amplified with silver using the HQ silver™ Enhancement kit (Nanoprobes) for 8+5 min at RT under light microscopy control. The sections were washed extensively in milliQ water and then with TB, and reacted with 0.015% 3,3′-diaminobenzidine (DAB; Sigma, Munich, Germany) and 0.4% Nickel (II) sulphate hexahydrate (Sigma) as chromogen and 0.01% H2O2 as the electron donor. The sections were subsequently washed with 0.1 M PB and treated with 2% OsO4 in 0.1 M PB for 40 min at RT. After several rinses with 0.1 M PB and then with milliQ water, the sections were contrasted with 1% uranylacetate in 50% ethanol for 30 min at RT protected from light. The dehydration steps were done with graded ethanol (50, 70, 90, and 100%) and propylene oxide at RT prior to embedding in epoxy resin. The sections were transferred into weighting boats containing epoxy resin (durcupan ACM-Fluka, Sigma) and kept overnight at RT. The sections were transferred onto siliconized slides, coverslipped with ACLAR®-film coverslips (Ted Pella, Inc., Redding, CA, USA) and incubated for 3 days at 60°C. Pieces containing central nucleus of amygdala were trimmed and re-embedded in the resin for 2 days at 60°C. Ultrathin sections at 60 nm were examined in a Philips CM120 TEM, equipped with a Morada CCD camera (Soft Imaging Systems, Muenster, Germany). Whole images were level adjusted, sharpened and cropped in Photoshop (Adobe) without changing any specific feature.
Cre regulated knockdown of α5 subunits
Four pairs of DNA oligos targeting the mouse α5GABAAR were designed using RNAi Explorer, and tested in HEK293T cells by cotransfecting the rat α5 subunit with the knock-down constructs. Sequence no. 2 (tccattgcacacaacatgac - NM_176942.4 (765-784)) showed the best knockdown (Supplementary Fig. 10). For conditional expression, the RNAi construct was inserted into a modified lentilox 3.7 (pLL3.7) dsRed (pSICO) that contains loxP sites within the TATAbox sequence35. The oligo for the shRNA was cloned into pSICO digested with Xho and Hpa. A scrambled control oligo (catacggtcaatcctcaaca) was also synthesised and constructed in the same vector. All constructs were verified by sequencing. To test conditional expression HEK293T cells were plated into 24-well plate with a density of 8.0×10⁴ cells per well and were transfected with constructs expressing the rat α5subunit, α5-GABAAR knock-down or the scrambled control and Cre at a ratio of 1:1:1. The cells were washed with PBS and lysed in 200 μl 1× sample buffer. Twenty microliters of each sample were used for SDS-PAGE and Western blots. The α5 antibody (Novus) was diluted with the ratio of 1:1000.
Generation of conditional AAV Gabra5-iRNA constructs
The AAV shRNA constructs allow for conditional (Cre-LoxP), stable expression of both short hairpin RNAs (shRNAs) for RNA interference under the promoter U6, and reporter protein tdTomato driven by the promoter EF1a. The sequences of both Gabra5-shRNA and control-shRNA were first synthesised with EcoRI/EcoRV restriction sites at each end and inserted into pBMH vector (Biomatik USA, LLC).
Gabra5-shRN
TGTCCATTGCACACAACATGACTTCAAGAGAGTCATGTTGTGTGCAATGGACTTTTTTC.
Control-shRNA
TGCATACGGTCAATCCTCAACATTCAAGAGATGTTGAGGATTGACCGTATGCTTTTTT.
The pBMH-shRNA constructs were digested with EcoRI/EcoRV initially and the shRNA-containing segments were recycled and purified for ligation with the pAAV-EF1α-DIO-hChR2YFP (Deisseroth Lab, Stanford University) to insert the shRNA sequences after the second lox2711/loxP site. Mouse U6 promoter was synthesised with EcoRI and EcoRV for inserting into pAAV-EF1α-tdTomato-WPRE-pA to generate segment of mU6-Tdtomato, which later replaced the hChR2YFP of pAAV-EF1α-DIO-hChR2YFP-shRNA-WPRE-pA backbone designed with Asc1 and Nhe1 restriction sites. The expression of both tdTomato and shRNA driven by EF1 and mU6 respectively is achieved at the same time upon Cre recombination33 (Supplementary Fig. 10). The constructs were sequenced before being amplified with endonuclease-free column (Macherey-nagel; Germany) and were further validated in cultured cells by co-transfecting a Cre construct (data now shown). Two AAVs (serotype9; Vector Core; University of Pennsylvania) for the expressions of Gabra5-shRNA (pAAV-EF1α-DIO-tdTomato-U6-Gabra5.shRNA) and control shRNA (pAAV-EF1α-DIO-tdTomato-U6-control.shRNA) were injected into the CEA of the PKCδ-Cre-EYFP transgenic animals, to ensure cell-type specific knockdown of α5 subunit in PKCδ+ cells in CEl.
Statistics
Normal data distribution and equal variance was formally tested using SigmaPlot 13.0 or GraphPad Prism 6 for all statistical analyses. No statistical methods were used to predetermine sample sizes but our sample sizes are similar to those reported in previous publications8,13,30,31. Data collection and analysis were not performed blind to the conditions of the experiments. Data were collected and processed randomly apart from the data collected from grouped animals. SigmaPlot does not allow to extract precise P values if P < 0.001 for every statistical analyses reported in the manuscript. GraphPad Prism does not allow to extract precise P values when performing post- hoc multiple comparison tests.
Supplementary Material
Acknowledgments
We thank all members of the Lüthi lab for discussions and critical comments on the manuscript. In particularly, we thank P. Tovote, S. Wolff, S. Ciocchi, F. Grenier, J. Gruendemann, C. Müller, K. Bylund, and A. Loche for comments and for technical support, and W. Sieghart (Med. Univ. Vienna, Austria) and D. Anderson (Caltech, Pasadena, CA, USA) for antibodies and mice. This work was supported by the Novartis Research Foundation, by the National Center of Competences in Research: ‘SYNAPSY — The Synaptic Bases of Mental Diseases’ (financed by the Swiss National Science Foundation) as well as by an SNSF core grant to A.L. J.P.F. was supported by a NARSAD fellowship. C.X. was supported by an EMBO Long-Term Fellowship. P.S. and L.X. were supported by the Australian National Health and Medical Research Council. U.R. was supported by grant R01MH080006 from the US National Institute of Mental Health, National Institutes of Health. Funding for J.M.C. was provided by the National Institute of Neurological Disorders and Stroke (R01NS076517) and the National Institute of Mental Health (R01MH096463), National Institutes of Health. Y.K. and F.F. were supported by Austrian Science Fund (Fonds zur Förderung der Wissenschaftlichen Forschung) Sonderforschungsbereich grant F44-17.
The content is solely the responsibility of the authors and does not necessarily represent the official views of the funding agencies.
Footnotes
Author Contributions: The manuscript was prepared by A.L, and P.B. Electrophysiological recordings in vitro, behavioral experiments and viral injections were performed by P.B. Pharmacology combined with single units recordings in freely moving animals were designed and achieved by L.D. In vivo recordings from optogenetically identified neurons were performed by M.M. and J.F. Immunohistochemistry was accomplished by C.X. T.L. cloned the conditional shRNA plasmide. M.M.P. and J.MC. provided the PWZ-029. L.X. and P.S. tested the shRNA efficacy on α5GABAAR protein in HEK293T cells and provided the plasmid expressing shRNA, respectively. R.U. sent us the perfused brains of α5GABAARs KO mice. All EM experiments were performed and analysed by Y.K. and F.F.
Author Information: The other authors declare that they have no competing financial interest.
References
- 1.Davis M, Walker DL, Miles L, Grillon C. Phasic vs sustained fear in rats and humans: role of the extended amygdala in fear vs anxiety. Neuropsychopharmacol. 2010;35:105–135. doi: 10.1038/npp.2009.109. [DOI] [PMC free article] [PubMed] [Google Scholar]
- 2.Blanchard DC. If it reduces stress (hormones), do it! Horm Behav. 2008;54:582–583. doi: 10.1016/j.yhbeh.2008.06.004. [DOI] [PubMed] [Google Scholar]
- 3.Lissek S, et al. Classical fear conditioning in the anxiety disorders: a meta-analysis. Behav Res Ther. 2005;43:1391–1424. doi: 10.1016/j.brat.2004.10.007. [DOI] [PubMed] [Google Scholar]
- 4.Duvarci S, Bauer EP, Paré D. The bed nucleus of the stria terminalis mediates inter-individual variations in anxiety and fear. J Neurosci. 2009;29:10357–10361. doi: 10.1523/JNEUROSCI.2119-09.2009. [DOI] [PMC free article] [PubMed] [Google Scholar]
- 5.LeDoux JE. Emotion circuits in the brain. Annu Rev Neurosci. 2000;23:155–184. doi: 10.1146/annurev.neuro.23.1.155. [DOI] [PubMed] [Google Scholar]
- 6.Tovote P, Fadok JP, Lüthi A. Neuronal circuits for fear and anxiety. Nat Rev Neurosci. 2015;16:317–331. doi: 10.1038/nrn3945. [DOI] [PubMed] [Google Scholar]
- 7.Johansen JP, Wolff SBE, Lüthi A, LeDoux JE. Controlling the elements: an optogenetic approach to understanding the neural circuits of fear. Biol Psychiat. 2012;71:1053–1060. doi: 10.1016/j.biopsych.2011.10.023. [DOI] [PMC free article] [PubMed] [Google Scholar]
- 8.Ciocchi S, et al. Encoding of conditioned fear in central amygdala inhibitory circuits. Nature. 2010;468:277–282. doi: 10.1038/nature09559. [DOI] [PubMed] [Google Scholar]
- 9.Haubensak W, et al. Genetic dissection of an amygdala microcircuit that gates conditioned fear. Nature. 2010;468:270–276. doi: 10.1038/nature09553. [DOI] [PMC free article] [PubMed] [Google Scholar]
- 10.Duvarci S, Popa D, Paré D. Central amygdala activity during fear conditioning. J Neurosci. 2011;31:289–294. doi: 10.1523/JNEUROSCI.4985-10.2011. [DOI] [PMC free article] [PubMed] [Google Scholar]
- 11.Li H, et al. Experience-dependent modification of a central amygdala fear circuit. Nat Neurosci. 2013;16:332–339. doi: 10.1038/nn.3322. [DOI] [PMC free article] [PubMed] [Google Scholar]
- 12.Alheid GF, Heimer L. New perspectives in basal forebrain organization of special relevance for neuropsychiatric disorders: the striatopallidal, amygdaloid, and corticopetal components of substantia innominata. Neurosci. 1988;27:1–39. doi: 10.1016/0306-4522(88)90217-5. [DOI] [PubMed] [Google Scholar]
- 13.Tye KM, et al. Amygdala circuitry mediating reversible and bidirectional control of anxiety. Nature. 2011;471:358–362. doi: 10.1038/nature09820. [DOI] [PMC free article] [PubMed] [Google Scholar]
- 14.Jennings JH, et al. Distinct extended amygdala circuits for divergent motivational states. Nature. 2013;496:224–228. doi: 10.1038/nature12041. [DOI] [PMC free article] [PubMed] [Google Scholar]
- 15.Pellow S, Chopin P, File SE, Briley M. Validation of open:closed arm entries in an elevated plus-maze as a measure of anxiety in the rat. J Neurosci Meth. 1985;14:149–167. doi: 10.1016/0165-0270(85)90031-7. [DOI] [PubMed] [Google Scholar]
- 16.Farrant M, Nusser Z. Variations on an inhibitory theme: phasic and tonic activation of GABA(A) receptors. Nature Rev Neurosci. 2005;6:215–229. doi: 10.1038/nrn1625. [DOI] [PubMed] [Google Scholar]
- 17.Chadderton P, Margrie TW, Hausser M. Integration of quanta in cerebellar granule cells during sensory processing. Nature. 2004;428:856–860. doi: 10.1038/nature02442. [DOI] [PubMed] [Google Scholar]
- 18.Semyanov A, Walker MC, Kullmann DM. GABA uptake regulates cortical excitability via cell type-specific tonic inhibition. Nat Neurosci. 2003;6:484–490. doi: 10.1038/nn1043. [DOI] [PubMed] [Google Scholar]
- 19.Bai D, et al. Distinct functional and pharmacological properties of tonic and quantal inhibitory postsynaptic currents mediated by gamma-aminobutyric acid(A) receptors in hippocampal neurons. Mol Pharmacol. 2001;59:814–824. doi: 10.1124/mol.59.4.814. [DOI] [PubMed] [Google Scholar]
- 20.McCartney MR, Deeb TZ, Henderson TN, Hales TG. Tonically active GABAA receptors in hippocampal pyramidal neurons exhibit constitutive GABA-independent gating. Mol Pharmacol. 2007;71:539–548. doi: 10.1124/mol.106.028597. [DOI] [PubMed] [Google Scholar]
- 21.Wlodarczyk AI, Sylantyev S, Herd MB, Kersanté F, Lambert JJ, Rusakov DA, Linthorst AC, Semyanov A, Belelli D, Pavlov I, Walker MC. GABA-independent GABAA receptor openings maintain tonic currents. J Neurosci. 2013;33:3905–3914. doi: 10.1523/JNEUROSCI.4193-12.2013. [DOI] [PMC free article] [PubMed] [Google Scholar]
- 22.Brickley SG, Mody I. Extrasynaptic GABA(A) receptors: their function in the CNS and implications for disease. Neuron. 2012;73:23–34. doi: 10.1016/j.neuron.2011.12.012. [DOI] [PMC free article] [PubMed] [Google Scholar]
- 23.Herman MA, Contet C, Justice NJ, Vale W, Roberto M. Novel subunit-specific tonic GABA currents and differential effects of ethanol in the central amygdala of CRF receptor-1 reporter mice. J Neurosci. 2013;33:3284–3298. doi: 10.1523/JNEUROSCI.2490-12.2013. [DOI] [PMC free article] [PubMed] [Google Scholar]
- 24.Heldt SA, Ressler KJ. Training-induced changes in the expression of GABAA-associated genes in the amygdala after the acquisition and extinction of Pavlovian fear. Eur J Neurosci. 2007;26:3631–3644. doi: 10.1111/j.1460-9568.2007.05970.x. [DOI] [PMC free article] [PubMed] [Google Scholar]
- 25.Tasan RO, et al. Altered GABA transmission in a mouse model of increased trait anxiety. Neurosci. 2011;183:71–80. doi: 10.1016/j.neuroscience.2011.03.051. [DOI] [PMC free article] [PubMed] [Google Scholar]
- 26.Harris D, et al. Selective influence on contextual memory: physiochemical properties associated with selectivity of benzodiazepine ligands at GABAA receptors containing the alpha5 subunit. J Med Chem. 2008;51:3788–3803. doi: 10.1021/jm701433b. [DOI] [PubMed] [Google Scholar]
- 27.Savic MM, et al. PWZ-029, a compound with moderate inverse agonist functional selectivity at GABA(A) receptors containing alpha5 subunits, improves passive, but not active, avoidance learning in rats. Brain Res. 2008;1208:150–159. doi: 10.1016/j.brainres.2008.02.020. [DOI] [PMC free article] [PubMed] [Google Scholar]
- 28.Clement Y, et al. Gabra5-gene haplotype block associated with behavioral properties of the full agonist benzodiazepine chlordiazepoxide. Behav Brain Res. 2012;233:474–482. doi: 10.1016/j.bbr.2012.05.041. [DOI] [PubMed] [Google Scholar]
- 29.Huber D, Veinante P, Stoop R. Vasopressin and oxytocin excite distinct neuronal populations in the central amygdala. Science. 2005;308:245–248. doi: 10.1126/science.1105636. [DOI] [PubMed] [Google Scholar]
- 30.Cai H, Haubensak W, Anthony TE, Anderson DJ. Central amygdala PKC-delta neurons mediate the influence of multiple anorexigenic signals. Nat Neurosci. 2014;17:1240–1248. doi: 10.1038/nn.3767. [DOI] [PMC free article] [PubMed] [Google Scholar]
- 31.Mitchell SJ, Silver RA. Shunting inhibition modulates neuronal gain during synaptic excitation. Neuron. 2003;38:433–445. doi: 10.1016/s0896-6273(03)00200-9. [DOI] [PubMed] [Google Scholar]
- 32.Franklin KJB, Paxinos G. The Mouse Brain in Stereotaxic Coordinates. New York, NY: Academic Press; 1997. [Google Scholar]
- 33.Hörtnagl H, et al. Patterns of mRNA and protein expression for 12 GABAA receptor subunits in the mouse brain. Neuroscience. 2013;236:345–372. doi: 10.1016/j.neuroscience.2013.01.008. [DOI] [PMC free article] [PubMed] [Google Scholar]
- 34.Pirker S, Schwarzer C, Wieselthaler A, Sieghart W, Sperk G. GABA(A) receptors: immunocytochemical distribution of 13 subunits in the adult rat brain. Neuroscience. 2000;101:815–850. doi: 10.1016/s0306-4522(00)00442-5. [DOI] [PubMed] [Google Scholar]
- 35.Ventura A, et al. Cre-lox-regulated conditional RNA interference from transgenes. Proc Natl Acad Sci U S A. 2004;101:10380–10385. doi: 10.1073/pnas.0403954101. [DOI] [PMC free article] [PubMed] [Google Scholar]
Associated Data
This section collects any data citations, data availability statements, or supplementary materials included in this article.